Significance
Blue phases represent distinct liquid states of matter having a high viscosity, finite shear modulus, and Bragg reflections in the visible spectrum. These properties arise from a highly ordered defect structure, unique amongst complex liquids, which is stable only over a narrow range of temperature. The number and characteristics of the corresponding unit cells could in principle be altered by confinement. In this work we show that the stability of blue phases can be increased by preparing them into small droplets. We demonstrate that defect structure, color, and morphology can be manipulated by controlling droplet size, temperature, and anchoring, thereby offering intriguing opportunities for optical devices based on chiral liquid crystals.
Keywords: blue phases, chiral liquid crystals, droplets, confinement
Abstract
Blue phases of liquid crystals represent unique ordered states of matter in which arrays of defects are organized into striking patterns. Most studies of blue phases to date have focused on bulk properties. In this work, we present a systematic study of blue phases confined into spherical droplets. It is found that, in addition to the so-called blue phases I and II, several new morphologies arise under confinement, with a complexity that increases with the chirality of the medium and with a nature that can be altered by surface anchoring. Through a combination of simulations and experiments, it is also found that one can control the wavelength at which blue-phase droplets absorb light by manipulating either their size or the strength of the anchoring, thereby providing a liquid–state analog of nanoparticles, where dimensions are used to control absorbance or emission. The results presented in this work also suggest that there are conditions where confinement increases the range of stability of blue phases, thereby providing intriguing prospects for applications.
Blue phases of liquid crystals (LCs) are characterized by a local director field that forms double-twisted cylinders, arranged into defect regions that are periodically repeated in space (1, 2). The symmetry properties of blue phases (BPs) have attracted considerable attention, as have their potential applications in a wide range of technologies (3–7). Theoretical and computational studies of the bulk structure and dynamics of BPs have helped elucidate their nature (1, 8, 9–15) in considerable detail. In the bulk, however, BPs are only found in a narrow range of temperature, between the cholesteric and the isotropic phases (1–6, 10–18), thereby placing limits on their practical utility. Recent efforts have therefore focused on increasing their stability over wider ranges of temperature and chirality, for example through addition of nanoparticles (19, 20, 21–23), polymers (24–26), or by manipulating their flexoelectricity (14).
Confined chiral liquid crystals are of interest for applications in optical devices (27–31). Simulations of chiral LCs in channels have shown that their defect structure can be manipulated through confinement, thereby raising intriguing prospects for technology (32–35). Chiral LC droplets have also been studied both numerically (36–38) and experimentally (39, 40). More recent, intriguing simulations of planar chiral droplets with strong anchoring by Seč et al. (41) have examined their phase behavior as a function of chirality. In particular, it was reported that the twist bipolar structure (BS) is stable in the low chirality regime, whereas the radial spherical structure (RSS) is preferred at high chirality. The BS state has a cylindrical symmetry, where the director field is uniform along the symmetry axis of the droplet and rotates in the perpendicular direction forming bent cholesteric layers. In the RSS state, the director field also forms curved cholesteric layers, but in this case there are two disclination lines that form a double helix from the bottom to the surface. The radial direction is normal to the cholesteric layers everywhere except in the vicinity of the disclination lines (41). Other configurations, such as the so-called diametrical spherical structure (DSS), where the director field forms concentric tori of double twist cylinders, the lyre and the yeti morphologies, which are related each other and the structure of the first one resembles a lyre instrument, represent metastable states whose free energy is well above that of the RSS configuration (by approximately kT). For droplets with strong homeotropic anchoring, the defects form different types of “knots,” particularly at high pitch ( μm) (42). A key feature of that work is that the topological complexity of the system arises from a balance between the tendency by the low-chirality medium in the bulk to adopt a smectic-like structure, and the strong homeotropic anchoring that governs orientation at the droplet’s interface.
Motivated by this body of work, in this study we examine the morphology of chiral LC droplets with planar degenerate anchoring, under conditions that correspond to droplets of common liquid crystals suspended in water. Building on past studies, we present an analysis of such systems under conditions that more closely resemble those realized in experiments, thereby providing an analysis of blue-phase droplets that can be compared with experiments. Overall, our findings indicate that weak, experimentally relevant anchoring conditions lead to a behavior that is at times markedly different from that anticipated on the basis of earlier, strong anchoring assumptions.
Results
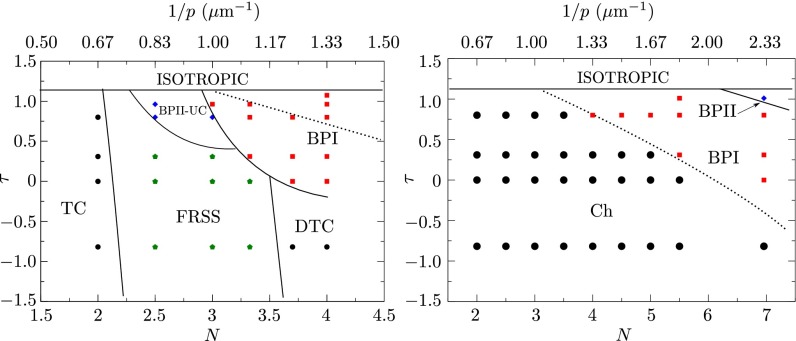
We focus on chiral micro droplets (CμDP) of diameter μm. For completeness, simulations are carried out from different initial conditions, including a uniform state, a random configuration, the bulk ansatz for BPI and BPII (10, 12), and the DSS and RSS configurations (see Supporting Information for details about these initial configurations). Note that the RSS structure represents the stable state for strong planar anchoring and high chirality (41). For droplets of fixed diameter D, the pitch p is varied through a parameter N, defined as , which corresponds to the number of π-turns of the director along a distance D in a bulk chiral liquid crystal (41). The resulting phase diagram, shown in Fig. 1, is given in terms of the reduced temperature, τ, and N or . A comparison with the behavior corresponding to the same material in the bulk is also included in Fig. 1; the dotted line divides the cholesteric and BPI regions and shows that BPI is expected at higher chiralities. An alternative representation of the phase diagram, common in the literature for chiral LCs in the bulk (10, 12, 15), can be obtained by replacing N by the definition of chirality, namely , where is the nematic coherence length and U is a phenomenological parameter that depends on temperature (Methods).
Fig. 1.
(Left) Simulated phase diagram of CμDP with weak planar degenerate anchoring. The morphologies found in the diagram include the twist cylinder (A), the FRSS (B), the deformed twist cylinder (DTC) (C), BPI (E) and blue phase II-unit cell (D). See caption to Fig. 2 for definition of different morphologies and their schematic representation. The solid lines are drawn to delineate the boundaries between different phases. The dotted line divides the cholesteric and BPI regions in the bulk for a system with the same parameters used in this work. (Right) Phase diagram of the bulk behavior where N is the number of π turns of the director over a distance equal to the droplet’s diameter.
Our results indicate that the twist cylindrical structure (TC) is stable in the region of low chirality (). The director field of this structure forms a double twist cylinder, as illustrated in Fig. 2A. For strong planar anchoring, one finds a bipolar structure in this region of the phase diagram (41). As the chirality increases, other double twist cylinders appear, leading to formation of well-defined disclination lines. The structures, however, preserve well-defined symmetries. The splay–bend order parameter (), defined as , can be used to quantify the extent of splay and bend deformations. For and , the minimum free energy configurations are obtained from the ansatz for RSS; however, the final states do not exhibit the RSS symmetry. This can be explained from the fact that a weak planar anchoring allows droplets to adopt a perpendicular orientation at the surface (Fig. S1), leading to what we call a “frustrated radial spherical morphology” (FRSS). Fig. 2B shows the splay–bend isosurfaces for the FRSS structure. In the high-chirality region, , the twist cylindrical structure appears again but is now somewhat deformed, mainly in the central region of the droplet, as a result of bend and splay distortions induced by the high chirality of the system (Fig. 2C). In this case the splay–bend isosurfaces show that the deformation of the director field is a twist paraboloid.
Fig. 2.
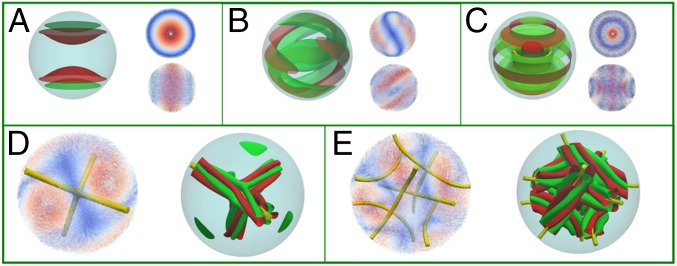
Representative morphology of chiral liquid crystal droplets. (A, B, C) The splay–bend isosurfaces for and are shown in red and green, respectively. We show the z view (Upper) and lateral view (Lower) of the director field for TC (A), FRSS (B), and DTC (C) morphologies. The DTC configuration exhibits a defect region represented by the isosurface with . For BPII (D) and BPI (E), the splay–bend isosurfaces correspond to in red and in green, respectively, and rotate along the line defect with (Fig. S2).
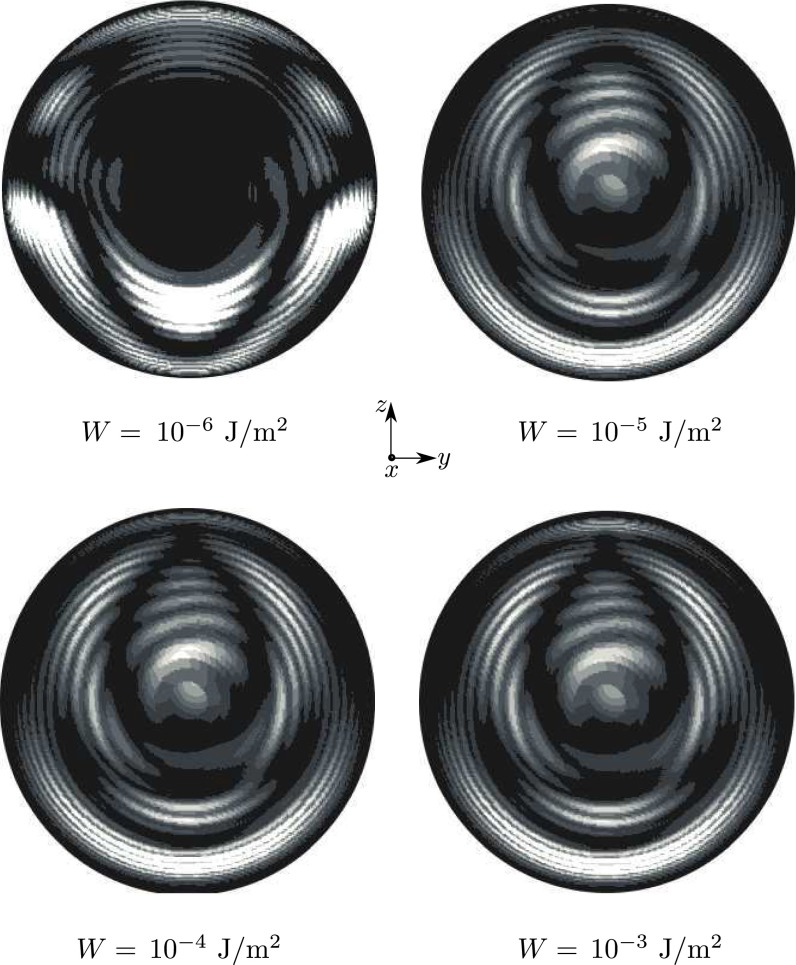
Fig. S1.
Simulated cross-polarizer images of the final structures obtained from the ansatz of the RSS configuration for different anchoring strengths. N = 4, , and D = 1,500 nm.
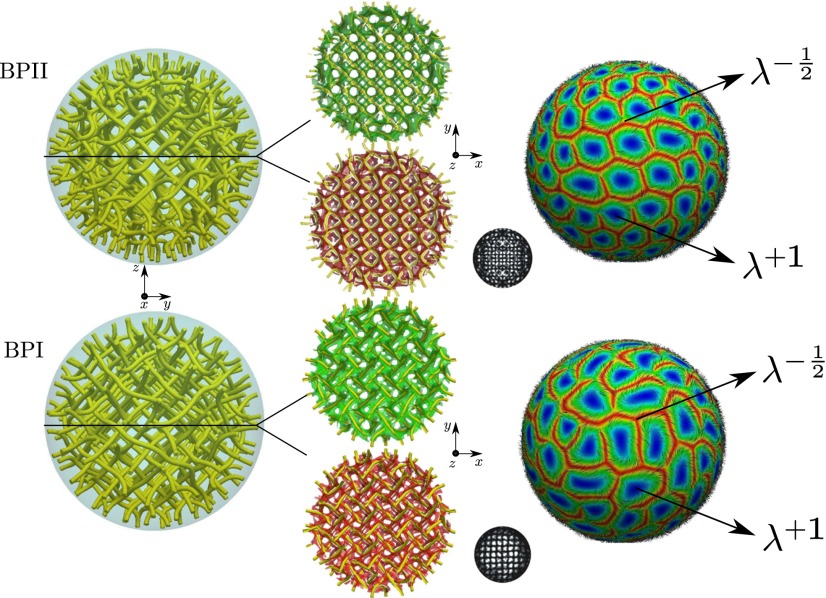
Blue phases arise for and in the vicinity of the isotropic phase. The simulated BPII structure actually corresponds to a confined BPII unit cell (Fig. 2D and Fig. S2). However, as discussed later, it is possible to trap a network of such cells by increasing chirality. As in the bulk, BPI (Fig. 2E) occurs over a wider range of temperature and chirality than BPII. As expected, the number of unit cells increases with N (Fig. 3). Fig. 4 shows representative structures for BPI and BPII at ( nm). For this system, BPI corresponds to the minimum energy configuration and BPII is a metastable state. Confinement increases and breaks the symmetry of the blue phases in the neighborhood of the interface. Although weak, the anchoring strength is sufficient to bend the disclination lines of the blue phases in the proximity of the droplet interface. This can be appreciated in the simulated ideal cross-polarizer images of Fig. 4, which show a well-defined pattern in the central region of the droplet that becomes diffusive or dark near the interface. Note that cross-polarizer images were obtained for a wavelength nm, which is well below the visible spectrum and therefore corresponds to polarized UV rays. From a theoretical point of view, such images provide a useful simulation tool with which to assess the structure of these phases. As with strong homeotropic anchoring, the splay–bend isosurfaces in the BPs can exhibit a helical structure around the defects (42).
Fig. S2.
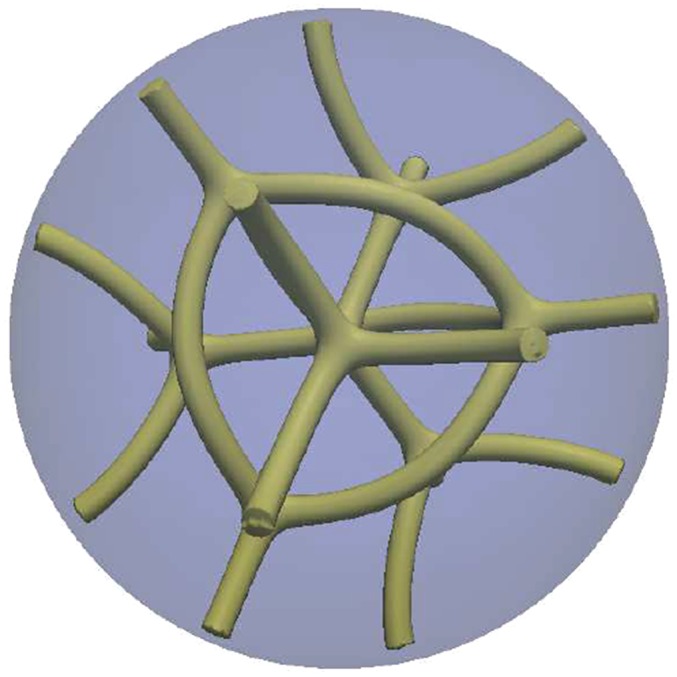
Droplet’s morphology for N = 3. The structure finally relaxes into a configuration with the symmetry of a unit BPII cell.
Fig. 3.

BPI disclination lines in a droplet with μm. As expected, the number of unit cells increases with the chirality.
Fig. 4.
Metastable BPII (Upper) and BPI (Lower) for . (Left) Nematic order parameter isosurfaces of . (Center) Transverse section showing the splay–bend red () and green () isosurfaces. The disclination lines are bent in the proximity of the droplet interface, where the corresponding cross-polarizer images become dark or diffusive. In the central region, however, the structure is well defined. (Right) Director field in the vicinity of the droplet’s surface; the field is characterized by positive and negative lambda defects. The colors correspond to director’s orientation: blue when the director has radial direction and red when it is parallel to the surface.
It is of interest to discuss how the lambda defect cores are distributed on the droplet’s surface. For BPII droplets, either positive or negative defects form a hexagonal array, each having different “lattice” parameters. In contrast, in the case of BPI they do not exhibit a regular structure (Fig. 4). The surface structure of these defects raises intriguing possibilities for controlled localization of nanoparticles. Indeed, recent work has shown that nanoparticles segregate to liquid crystal defects to minimize the free energy of the system (16, 17, 19). The results shown in Fig. 4 indicate that the behavior of the director field on the surface of BP droplets confers an advantage of these systems over their nonchiral counterparts. For example, nanoparticles at the interface of BPII droplets could potentially assembly in different arrays, mediated by the positive and negative defects on the BPII droplet and the type of anchoring, homeotropic or planar, of the nanoparticles.
Going back to the phase diagram of CμDP (Fig. 1), it is of interest to highlight the main differences with respect to the behavior of the corresponding bulk material (8, 10, 12). First, the range of stability of the blue phases is different: for the droplet’s size and anchoring strength considered here, BPI is stable over a wider range of temperature. For CμDP, there is a region of the diagram where the structure of the material adopts the symmetry of a unit BII cell, which is stabilized by confinement; this region is very narrow and could either increase or disappear by changing the droplet’s size or the strength of the anchoring.
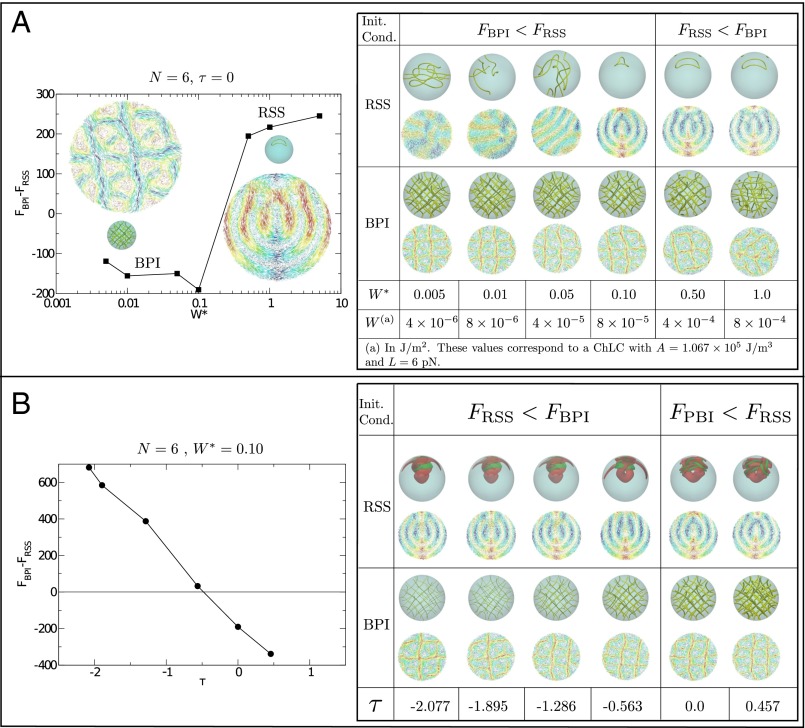
It is well known that the stability of a confined LC phase depends on the thermodynamic conditions and the interplay between the bulk behavior and the restrictions imposed by surfaces or interfaces. For a given material, such an interplay is largely dictated by the droplet’s size and the anchoring strength (Tables S1 and S2). An example is provided by the work of Seč et al. (41), for chiral droplets with strong planar anchoring at constant temperature, where the RSS configuration, theoretically obtained from the ansatz of a pure tangential field, agrees with the strong planar anchoring imposed on the surface and corresponds to the minimum-energy configuration at high chirality. The influence of temperature on the stabilization of the RSS structure, even for strong planar anchoring, must also be considered. Fig. 5A shows the effect of anchoring on the BPI and RSS configurations with nm, where BPI appears as the minimum-energy configuration in the small anchoring regime. An anchoring mediated BPI–RSS transition is predicted at J/m2; strong planar anchoring destroys the symmetry of the BP. Note, however, that the possibility of having a stable BPI phase in large droplets with these anchoring conditions cannot be ruled out. On the other hand, weak planar anchoring allows the material to be tilted at the surface, and the RSS configuration is no longer preferred (Fig. S1). It is also of interest to examine the temperature dependence of the BPI and RSS droplets for anchoring values just below the transition to the RSS morphology. Our results are shown in Fig. 5B. One can appreciate that the temperature range of stability of BPI is decreased as the strength of the anchoring increases. This, in fact, is one of the reasons that BPI droplets are difficult to generate in experiments. From Fig. 5B one can see how the disclination lines (isosurfaces for ) shrink as the temperature is decreased, due to the increment of the nematic order parameter of the bulk. The structure of the phase, however, remains stable; with respect to the RSS, the two escaped disclination lines follow a helical pattern and fuse at the center of the droplet (see the red isosurfaces), in agreement with the observations originally reported by Seč et al. (41). At high temperatures, a disclination line forms a long ring that is surrounded by the splay–bend isosurfaces; the increment of the distortions makes this phase metastable.
Table S1.
Free energy contributions, in units of J/, for different anchoring conditions in a droplet with nm, , and
| Anchoring strength | Initial configuration | Bulk energy | Elastic energy | Surface energy | Total energy | Final configuration |
| J/m2 | Ansatz-BPI | −385.45248 | −450.51693 | 3.55400 | −832.41540 | BPI |
| Ansatz-BPII | −378.89844 | −448.44058 | 3.52160 | −823.81744 | ||
| Ansatz-RSS | −393.90414 | −437.39151 | 2.91441 | −828.38124 | ||
| Uniform | −393.90190 | −437.44326 | 2.90427 | −828.44089 | ||
| J/m2 | Ansatz-BPI | −387.75891 | −444.21968 | 27.31589 | −804.66270 | |
| Ansatz-BPII | −381.35013 | −442.29536 | 27.62039 | −796.02510 | ||
| Ansatz-RSS | −395.67148 | −431.48525 | 20.71062 | −806.44611 | Bipolar | |
| Uniform | −395.67064 | −431.52917 | 21.00240 | −806.19726 | ||
| J/m2 | Ansatz-BPI | −392.20309 | −355.38006 | 30.51513 | −717.06802 | |
| Ansatz-BPII | −385.79512 | −347.20740 | 34.01963 | −698.98289 | ||
| Ansatz-RSS | −399.13072 | −365.98827 | 20.30534 | −744.81366 | Bipolar | |
| Uniform | −399.23611 | −366.08891 | 22.37155 | −742.95347 | ||
| J/m2 | Ansatz-BPI | −392.35208 | −295.23600 | 3.40917 | −684.17890 | |
| Ansatz-BPII | −385.63103 | −275.16193 | 3.95872 | −656.83424 | ||
| Ansatz-RSS | −399.40513 | −325.70054 | 2.26706 | −722.83861 | ||
| Uniform | −399.48442 | −326.06073 | 2.50387 | −723.04127 | Bipolar |
As a comparison, a droplet with nm and has the same chirality. For this droplet size, the minimum-energy configurations are BPI when the anchoring is J/m2, and the bipolar structure for higher values. Note that the bipolar structure with the minimum energy may also come from different initial conditions.
Table S2.
Free energy contributions, in units of J/, for different anchoring in a droplet with nm, , and
| Anchoring strength | Initial configuration | Bulk energy | Elastic energy | Surface energy | Total energy | Final configuration |
| J/m2 | Ansatz-BPI | −404.36884 | −247.16700 | 3.58530 | −647.95600 | |
| Ansatz-BPII | −397.78170 | −230.44345 | 3.45230 | −624.77290 | ||
| Ansatz-RSS | −411.38346 | −260.78790 | 3.15115 | −669.02024 | ||
| Uniform | −411.38262 | −260.80503 | 3.12412 | −669.06353 | TC | |
| J/m2 | Ansatz-BPI | −405.71585 | −241.64309 | 27.22327 | −620.13568 | |
| Ansatz-BPII | −399.17344 | −225.23744 | 26.76876 | −597.64213 | ||
| Ansatz-RSS | −412.58277 | −254.93331 | 22.19049 | −645.32558 | BS | |
| Uniform | −412.58250 | −254.95490 | 22.30840 | −645.22900 | ||
| J/m2 | Ansatz-BPI | −405.12915 | −157.95290 | 26.22838 | −536.85370 | |
| Ansatz-BPII | −413.11891 | −188.16580 | 20.06956 | −581.21514 | ||
| Ansatz-RSS | −413.06714 | −188.12940 | 19.27795 | −581.91859 | BS | |
| Uniform | −413.11874 | −188.16636 | 20.07032 | −581.21478 | ||
| J/m2 | Ansatz-BPI | −403.43615 | −108.29037 | 2.91925 | −508.80726 | |
| Ansatz-BPII | −412.17657 | −153.15245 | 2.20123 | −563.12778 | BS | |
| Ansatz-RSS | −412.13077 | −153.01743 | 2.10455 | −563.04364 | ||
| Uniform | −412.17653 | −153.15236 | 2.20133 | −563.12755 | BS |
For this droplet size, the minimum-energy configurations are TC when the anchoring is J/m2 and the bipolar structure for higher values. Note that BPII does not appear (for the highest anchoring it equilibrates to the BS morphology), suggesting that the small region where it arises for D = 1,500 nm decreases with system size.
Fig. 5.
(A) (Left) Anchoring dependence of the free energy difference () between BPI and RSS droplets with ( nm). (Right) Final configurations showing the effect of anchoring strength on the RSS and BPI morphologies; line defects correspond to isosurfaces with . (B) (Left) vs. τ; (Right) Final configurations showing the effect of temperature (line defects as before). Splay–bend isosurfaces correspond to and .
As mentioned earlier, the periodic structure of disclination lines in blue phases gives rise to Bragg-like reflections. For a normally incident line, the reflection wavelength is related to the lattice constant of the BP, a, the refractive index n, and the incident plane according to
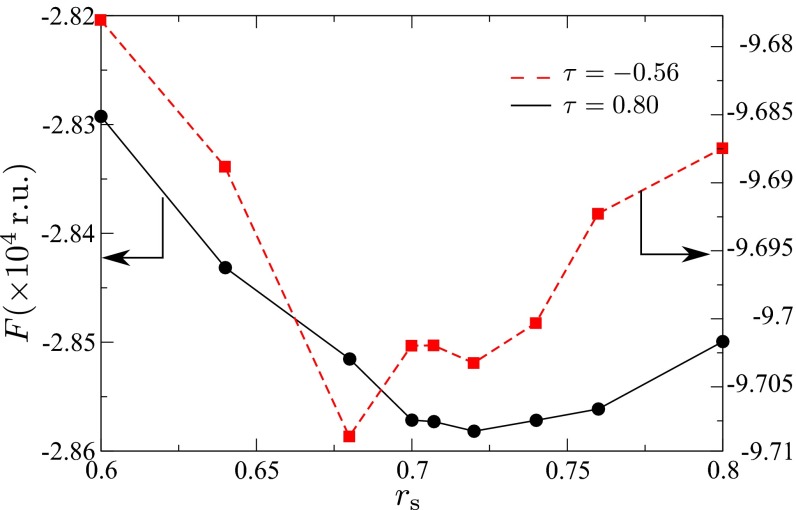
In blue phases, the minimum free energy corresponds to a lattice spacing that is higher than the cholesteric pitch (8, 10). On the other hand, the BP lattice cell contracts as the temperature increases, resulting in a gradual color change of the BP (43). This effect can be described by multiplying the magnitude of the original blue phase wave vector by a red shift, . Fig. 6 shows, for , the free energy of a BP droplet as a function of the red shift at two reduced temperatures. For , the lattice spacing is nm, but when it increases to the spacing decreases to nm. For incident light normal to the interface, on the [110] plane, and a refractive index of , droplets of ( nm) should reflect light at a wavelength of nm (red), when , and at a wavelength of nm (orange) when . The structure of disclination lines is altered by confinement, and can also influence reflection. To measure this effect, one can compare the periodicity of the BPI structure in the droplet to that of the bulk through a scalar order parameter along the x axis at the middle of both systems. As shown in Fig. 7A, in the core of the droplet () the BPI structure is essentially identical to that of the bulk; however, as one moves radially toward the droplet interface (in order of increasing x), the cells shrink slightly until they eventually stretch and deform in the immediate vicinity of the interface. It is important to note that such a deformation occurs primarily in a region whose dimensions are comparable to those of the unit cell size, and should not alter considerably the wavelength of reflected light.
Fig. 6.
Free energy dependence of the redshift (reduced units) for a droplet with . The unit cell and the redshift for a BPI are related through , where p is the pitch.
Fig. 7.
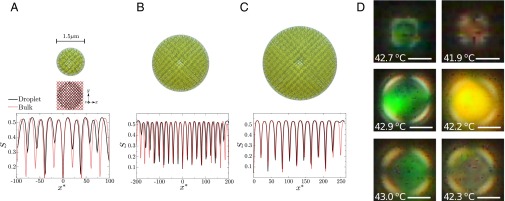
(A–C) (Upper) BPI droplets with and D = 1.5, 3.0, and 3.75 μm, respectively. (A) (Center) Projection on the plane of the defect structure of a BPI droplet with for bulk (red) and droplet (black). (A–C) (Lower) Scalar order parameter along the x axis. The reduced distance, , satisfies . Each minimum corresponds to a region in the proximity of a disclination line core. (D) Crossed-polarized reflection mode micrographs of BPI droplets. Droplets in Top and Center were subjected to cooling from the isotropic phase whereas the droplet in Bottom was heated from the cholesteric phase. Scale bars, (Upper) 2 μm, (Center and Bottom) 4 μm.
To explore possible size effects, we also performed simulations of larger BPI droplets with weak planar anchoring, J/m2, chiral pitch nm and and , which correspond to and 26, respectively. The results show basically the same behavior obtained for droplets with : a unaltered BPI at the core of the system, surrounded by increasingly stretched unit cells in the proximity of the interface (Fig. 7 B and C). These results suggest that simulations of CμD with are sufficiently large to anticipate the structural properties of larger droplets, particularly when we recall that for the anchoring conditions considered here confinement deforms the BP unit cells mainly in the first 200 nm from the interface along the radial direction.
Recent experiments on confined BPμD phases have been reported by Kemiklioglu and Chien for polymer-encapsulated droplets (44). Although the diameters considered in that work were larger than those examined here, typically above 10 μm, it has now become possible to reach smaller sizes through strategies presented in the recent literature (45). By adopting such strategies, we were able to generate in our laboratory droplets of comparable size to those addressed in our simulations. Fig. 7D shows experimental micrographs corresponding to BPI droplets with nm and μm, along with the corresponding images in reflection mode of polarized light. These experimental results serve to confirm that the BPI structure is indeed stable, and that the wavelength of the reflected light is basically the same than in bulk, but with a red shift in the vicinity of the interphase, thereby confirming our theoretical prediction concerning the strain of the unit cells as the interface is approached.
To provide an additional experimental verification of the predictions outlined above, we also conducted measurements of the temperature dependence of the color appearance of BP droplets. Specifically, we characterized optically the colors reflected from small and large BPI droplets dispersed in water. Fig. 7D (Top and Center) show micrographs from reflection mode polarized light of 2- and 8-μm diameter BPI droplets at two different temperatures. The similarities in the colors between two different droplets are evident in the images. At elevated temperatures, the droplets are green, whereas at lower temperatures the droplets are yellow-orange, indicating an expansion of the lattice size upon cooling for both sizes. We note that the experiments performed in the heating direction confirm that the colors indeed correspond to the equilibrium colors reflected from droplets (Fig. 7, Bottom). To determine the extent of expansion upon cooling, we collected UV-vis spectra of 20-μm-thick BPI films sandwiched between two glass slides. We determined that the green and yellow-orange colors reflected from the droplets correspond to the reflections from [110] planes of the BPI lattice. The wavelengths were measured as 530 nm at 44.0 °C, and 570 nm at 43.0 °C, which correspond to lattice sizes of 250 nm at 44.0 °C, and 270 nm at 43.0 °C (here we note that these colors correspond to the phase boundaries of the BPI in films). These values correspond to a lattice expansion of 8% upon cooling 1 °C, which is also consistent with the 5.8% expansion predicted in our simulations. Taken together, our experimental observations serve to confirm the predictions of the model, particularly the temperature-dependent BP lattice expansion, and provide evidence suggesting that simulations of small droplets can be used to anticipate the behavior of larger sized droplets.
Discussion
Overall, the findings presented in this work show that the phase behavior of chiral liquid crystals confined into microdroplets with weak planar degenerate anchoring is significantly different from that of the corresponding bulk material. In particular, the BPI morphology is stable in a region close to the isotropic phase and in the high-chirality regime. At the same time, confinement into droplets with weak planar anchoring enlarges considerably the range of stability of blue phases with respect to that observed in the bulk. For example, a phase with a BPII unit cell symmetry exists in a narrow region of the phase diagram, and the BPII phase appears as a metastable state for other values of τ and N. The main effect of anchoring, even weak anchoring, is to change the topology of the defects in the vicinity of the droplet’s interface. However, this effect is not strong enough to completely destabilize the material’s morphology. Our simulations suggest that blue phases are only destabilized when either the diameter is reduced, or when the anchoring is increased (Tables S1 and S2). In the latter case, anchoring-mediated phase transitions may even take place. Our experiments serve to confirm predictions that BP droplets show Bragg reflections in the visible regime, as they do in the bulk, and that one can control these by manipulating droplet size and temperature. With respect to the droplet’s color, simulations show that for a given droplet diameter the size of the unit cells depends on temperature and anchoring. The former determines the size of the unit cells at the core of the droplet, and the latter is responsible of how these cells deform when confined, leading to the redshift observed at the borders of the droplets in the experimental images (Fig. 7D). Based on the results shown in Fig. 6, we anticipate that there is only a unit cell size that fully minimizes the free energy of the system for a given temperature, implying that the gradual color change observed in experiments is the same upon heating and upon cooling. Our results also show that, depending on the particular blue phase, it is possible to form ordered arrays of defect cores at the droplet’s surfaces, thereby offering opportunities for controlled placement of functionalized nanoparticles. More generally, the behavior outlined in this work points to intriguing possibilities for using BP droplets in sensing or hierarchical materials applications that rely on a rich but controllable phase behavior.
Methods
Simulations.
The liquid crystals considered here are described in terms of a continuum mean field Landau–de Gennes free energy model. The direction of a given molecule and the local average molecular orientation are represented as a and n, respectively. The scalar order parameter is defined as , with ; the brackets denote a spatial average. The tensor order parameter, , is defined by and is used to express the total free energy as
| [1] |
The accounts for the short-range interactions, it is given by
where A is a constant and U is a dimensionless parameter related to the reduced temperature by . In Eq. 1, represents the long-range elastic free energy, , where L is the elastic constant, and is the inverse of the pitch that measures the chirality of the system (and vanishes for nonchiral systems). Here is the Levi–Civita tensor. The surface free energy is given by a Fournier–Galatola (46) expression of the form, where W is the degenerate planar anchoring strength. The Q tensor satisfies , with . Note that denotes the projection of on the surface, defined with surface normal as , where is the projection operator.
The following values, which are well in the range expected for common chiral liquid crystals, were used for all calculations: N, J/m3 (1, 23). A lattice array with mesh size of nm was used to perform the simulations (approximately four million lattice sites were used to simulate a droplet). The minimization of the free energy was achieved by means of the Euler–Lagrange equation with appropriate boundary conditions [additional details are provided in the Supporting Information and in the literature (47, 48)]. Cross-polarizer images were obtained trough the Jones formalism, which enables simulation of the changes in polarization and phase shift when the light passes through a polarizer, the droplet, and the analyzer. A detailed explanation can be found in the original literature (49). In this work we used nm with the goal of providing an additional means of interrogating the structure of the droplet.
Experiments.
The 37.5 wt% 4-(1-methylheptyloxycarbonyl)phenyl-4-hexyloxybenzoate (S-811) in MLC 2142 mixtures were prepared by using toluene as a cosolvent. After mixing with an ultrasonic cleaner, toluene was evaporated overnight under vacuum at 60 °C. Blue-phase droplet emulsions were prepared by emulsifying 6 μL of 37.5 wt% S-811/MLC 2142 mixtures in 2 mL deionized water using a T25 digital ULTRA-TURRAX homogenizer equipped with an S25 N-10G dispersing element. Emulsions were then introduced into the optical cell made by sandwiching a glass slide and a coverslip using 100-μm-thick spacers and sealed using 1-min epoxy. Optical characterization was performed using cross-polarized and reflection mode with an Olympus BX60 microscope with a 50x objective. Samples were cooled from the isotropic phase using a Mettler Toledo FP90 central processor controlling FP82HT hot stage at a rate 0.5 °C/min. Additional information about the materials used here is provided in the SI Materials.
SI Ginzburg–Landau Relaxation
Minimization of the free energy is achieved by means of the Euler–Lagrange equation:
| [S1] |
with boundary conditions given by:
| [S2] |
where ν is the surface normal vector. Applying the derivative expression to the Landau–de Gennes free energy with a symmetric-traceless operator yields:
| [S3] |
In this work, an iterative Ginzburg–Laudau relaxation is applied to find the solutions of these equations. Assigning a relaxation coordinate t to the minimization process, the evolution of the Q tensor order parameter is given by:
| [S4] |
where is the time interval between two iteration steps, the choice of which depends on the system studied. Parameter represents a relaxation constant and denotes
SI Initial Conditions
Initial configurations used for BPI and BPII are as follows (in all cases the components , , , and are obtained by cyclic permutation from those given below) (13): For BPI:
| [S5] |
| [S6] |
For BPII:
| [S7] |
| [S8] |
where A = 0.2 for the amplitude of initialization. The strength of chirality is given by , where r is a pure number known as the redshift.
Initial configurations for RSS and DSS are generated from (37)
| [S9] |
where ; m is the winding number of the disclination line ( for RSS and for DSS); and and are unit vectors in spherical coordinates.
The frustrated order of the radial spherical structure can be attributed to weak anchoring. Fig. 1 shows how the RSS structure is maintained over a wide range of anchoring, but for the weakest anchoring it is lost.
SI Materials
MLC 2142 and 4-(1-methylheptyloxycarbonyl)phenyl-4-hexyloxybenzoate (S-811) were purchased from Merck. Fisher Finest Premium Grade glass slides and coverslips were obtained from Fisher Scientific. Toluene was obtained from Sigma Aldrich. Purification of the water (18.2 M cm resistivity at 25 °C) was performed with a Milli-Q water system (Millipore). One-minute epoxy glue was obtained from Henkel.
Acknowledgments
This work is supported by the Department of Energy, Basic Energy Sciences, Materials Science and Engineering Division, Biomaterials Program, through DE-SC004025. The calculations reported here were performed on The University of Chicago Research Computing Center. The authors also acknowledge an Innovative and Novel Computational Impact on Theory and Experiment (INCITE) grant at Argonne National Laboratory which permitted additional large-scale simulations of droplets. J.A.M.-G. is grateful for the Consejo Nacional de Ciencia y Tecnologia (CONACYT) Fellowship 250263.
Footnotes
The authors declare no conflict of interest.
This article is a PNAS Direct Submission.
This article contains supporting information online at www.pnas.org/lookup/suppl/doi:10.1073/pnas.1514251112/-/DCSupplemental.
References
- 1.Wright DC, Mermin ND. Crystalline liquids: The blue phases. Rev Mod Phys. 1989;61:385–433. [Google Scholar]
- 2.Crooker PP. 1983. The cholesteric blue phase: A progress report. Mol Liq Cryst, 98(1):31–45.
- 3.Stegemeyer H, Blumel T, Hiltrop K, Onusseit H, Porsch F. Thermodynamic, structural and morphological studies on liquid-crystalline blue phases. Liq Cryst. 1986;1(1):3–28. [Google Scholar]
- 4.Crooker PP. Chirality in Liquid Crystals. Springer; Berlin: 2001. [Google Scholar]
- 5.Oswald P, Pieranski P. Nematic and Cholesteric Liquid Crystals. Taylor & Francis; Boca Raton, FL: 2005. [Google Scholar]
- 6.Hirotsugu K. Liquid Crystalline Blue Phases. Springer; Berlin: 2008. [Google Scholar]
- 7.Pansu B, Grelet E, Li MH, Nguyen HT. Hexagonal symmetry for smectic blue phases. Phys Rev E Stat Phys Plasmas Fluids Relat Interdiscip Topics. 2000;62(1 Pt A):658–665. doi: 10.1103/physreve.62.658. [DOI] [PubMed] [Google Scholar]
- 8.Grebel H, Hornreich RM, Shtrikman S. Landau theory of cholesteric blue phases. Phys Rev A. 1984;30(6):3264–3278. [Google Scholar]
- 9.Jian-Jun L, Guo-chen Y, Man S. Microscopic theory of blue phases I and II of liquid crystal. Commum Theor Phys. 2004;42(1):131–140. [Google Scholar]
- 10.Dupuis A, Marenduzzo D, Yeomans JM. Numerical calculations of the phase diagram of cubic blue phases in cholesteric liquid crystals. Phys Rev E Stat Nonlin Soft Matter Phys. 2005;71(1 Pt 1):011703. doi: 10.1103/PhysRevE.71.011703. [DOI] [PubMed] [Google Scholar]
- 11.Alexander GP, Yeomans JM. Stabilizing the blue phases. Phys Rev E Stat Nonlin Soft Matter Phys. 2006;74(6 Pt 1):061706. doi: 10.1103/PhysRevE.74.061706. [DOI] [PubMed] [Google Scholar]
- 12.Alexander GP, Yeomans JM. Numerical results for the blue phases. Liq Cryst. 2009;36(10-11):1215–1227. [Google Scholar]
- 13.Ravnik M, Alexander GP, Yeomans JM, Žumer S. Mesoscopic modelling of colloids in chiral nematics. Faraday Discuss. 2010;144:159–169, discussion 203–222, 467–481. doi: 10.1039/b908676e. [DOI] [PubMed] [Google Scholar]
- 14.Castles F, Morris SM, Terentjev EM, Coles HJ. Thermodynamically stable blue phases. Phys Rev Lett. 2010;104(15):157801. doi: 10.1103/PhysRevLett.104.157801. [DOI] [PubMed] [Google Scholar]
- 15.Tiribocchi A, Gonnella G, Marenduzzo D, Orlandini E. Switching dynamics in cholesteric blue phases. Soft Matter. 2011;7(7):3295–3306. [Google Scholar]
- 16.Rahimi M, et al. Nanoparticle self-assembly at the interface of liquid crystal droplets. Proc Natl Acad Sci USA. 2015;112(17):5297–5302. doi: 10.1073/pnas.1422785112. [DOI] [PMC free article] [PubMed] [Google Scholar]
- 17.Stratford K, Henrich O, Lintuvuori JS, Cates ME, Marenduzzo D. Self-assembly of colloid-cholesteric composites provides a possible route to switchable optical materials. Nat Commun. 2014;5(06):3954. doi: 10.1038/ncomms4954. [DOI] [PubMed] [Google Scholar]
- 18.Bowling MB, Collings PJ, Booth CJ, Goodby JW. Phase diagrams for the blue phases of highly chiral liquid crystals. Phys Rev E Stat Phys Plasmas Fluids Relat Interdiscip Topics. 1993;48(5):4113–4115. doi: 10.1103/physreve.48.4113. [DOI] [PubMed] [Google Scholar]
- 19.Ravnik M, Alexander GP, Yeomans JM, Žumer S. Three-dimensional colloidal crystals in liquid crystalline blue phases. Proc Natl Acad Sci USA. 2011;108(13):5188–5192. doi: 10.1073/pnas.1015831108. [DOI] [PMC free article] [PubMed] [Google Scholar]
- 20.Fukuda J. Stability of cholesteric blue phases in the presence of a guest component. Phys Rev E Stat Nonlin Soft Matter Phys. 2012;86(4 Pt 1):041704. doi: 10.1103/PhysRevE.86.041704. [DOI] [PubMed] [Google Scholar]
- 21.Rozic B, et al. 2011. Theoretical and experimental study of the nanoparticle-driven blue phase stabilisation. Eur Phys J E, 34(17):17.
- 22.Hiroyuki Y, et al. Nanoparticle-stabilized cholesteric blue phases. Appl Phys Express. 2009;2(12):121501. [Google Scholar]
- 23.Hur S-T, Gim M-J, Yoo H-J, Choi S-W, Takezoe H. Investigation for correlation between elastic constant and thermal stability of liquid crystalline blue phase I. Soft Matter. 2011;7(19):8800. [Google Scholar]
- 24.Kasch N, Dierking I, Turner M. Stabilization of the liquid crystalline blue phase by the addition of short-chain polystyrene. Soft Matter. 2013;9(19):4789–4793. [Google Scholar]
- 25.Kemiklioglu E, Hwang JY, Chien LC. Stabilization of cholesteric blue phases using polymerized nanoparticles. Phys Rev E Stat Nonlin Soft Matter Phys. 2014;89(4):042502. doi: 10.1103/PhysRevE.89.042502. [DOI] [PubMed] [Google Scholar]
- 26.Guo J. Stabilizing blue phases of a simple cyanobiphenyl compound by addition of achiral mesogen monomer with a branched end group and chiral hydrogen-bonded assemblies. J Mater Chem C Mater Opt Electron Devices. 2013;1(1):947–957. [Google Scholar]
- 27.Castles F, et al. Stretchable liquid-crystal blue-phase gels. Nat Mater. 2014;13(8):817–821. doi: 10.1038/nmat3993. [DOI] [PubMed] [Google Scholar]
- 28.Castles F, et al. Blue-phase templated fabrication of three-dimensional nanostructures for photonic applications. Nat Mater. 2012;11(7):599–603. doi: 10.1038/nmat3330. [DOI] [PubMed] [Google Scholar]
- 29.Lin T-H, et al. Red, green and blue reflections enabled in an optically tunable self-organized 3D cubic nanostructured thin film. Adv Mater. 2013;25(36):5050–5054. doi: 10.1002/adma.201300798. [DOI] [PubMed] [Google Scholar]
- 30.Sato M, Yoshizawa A. Electro-optical switching in a blue phase III exhibited by a chiral liquid crystal oligomer. Adv Mater. 2007;19(23):4145–4148. [Google Scholar]
- 31.Yokoyama S, Mashiko S, Kikuchi H, Uchida K, Nagamura T. Laser emission from a polymer-stabilized liquid-crystalline blue phase. Adv Mater. 2006;18(1):48–51. [Google Scholar]
- 32.Fukuda J, Žumer S. Cholesteric blue phases: Effect of strong confinement. Liq Cryst. 2010;37(6-7):875–882. [Google Scholar]
- 33.Fukuda J, Žumer S. Novel defect structures in a strongly confined liquid-crystalline blue phase. Phys Rev Lett. 2010;104(1):017801. doi: 10.1103/PhysRevLett.104.017801. [DOI] [PubMed] [Google Scholar]
- 34.Ravnik M, Fukuda J, Yeomans JM, Žumer S. Confining blue phase colloids to thin layers. Soft Matter. 2011;7(21):10144–10150. [Google Scholar]
- 35.Henrich O, Stratford K, Marenduzzo D, Coveney PV, Cates ME. Confined cubic blue phases under shear. J Phys Condens Matter. 2012;24(28):284127. doi: 10.1088/0953-8984/24/28/284127. [DOI] [PubMed] [Google Scholar]
- 36.Volovik GE. Large-scale continuous theory of cholesterics. Pis’ma Z Eksp Teor Fiz. 1979;29(6):357–360. [Google Scholar]
- 37.Bezic J, Žumer S. Structure of cholesteric liquid crystals with parallel surface anchoring. Liq Cryst. 1992;11(4):593–619. [Google Scholar]
- 38.Bajc J, Bezic J, Žumer S. Chiral nematic droplets with tangential anchoring and negative dielectric anisotropy in an electric field. Phys Rev E Stat Phys Plasmas Fluids Relat Interdiscip Topics. 1995;51(3):2176–2189. doi: 10.1103/physreve.51.2176. [DOI] [PubMed] [Google Scholar]
- 39.Kurik MV, Lavrentovich OD. Topological defects of cholesteric liquid crystals for volumes with spherical shape. Mol Cryst Liq Cryst (Phila Pa) 1982;72:239–246. [Google Scholar]
- 40.Xu F, Crooker PP. Chiral nematic droplets with parallel surface anchoring. Phys Rev E Stat Phys Plasmas Fluids Relat Interdiscip Topics. 1997;56(6):6853–6860. doi: 10.1103/physreve.49.3061. [DOI] [PubMed] [Google Scholar]
- 41.Seč D, Porenta T, Ravnik M, Žumer S. Geometrical frustration of chiral ordering in cholesteric droplets. Soft Matter. 2012;8(48):11982. [Google Scholar]
- 42.Seč D, Copar S, Žumer S. Topological zoo of free-standing knots in confined chiral nematic fluids. Nat Commun. 2014;5(01):3057. doi: 10.1038/ncomms4057. [DOI] [PubMed] [Google Scholar]
- 43.Johnson DL, Flack JH, Crooker PP. Structure and properties of the cholesteric blue phases. Phys Rev Lett. 1980;45(8):641–644. [Google Scholar]
- 44.Kemiklioglu E, Chien L-C. Polymer-encapsulated blue phase liquid crystal droplets. Appl Phys Express. 2014;7(9):091701. [Google Scholar]
- 45.Miller DS, Abbott NL. Influence of droplet size, pH and ionic strength on endotoxin-triggered ordering transitions in liquid crystalline droplets. Soft Matter. 2013;9(2):374–382. doi: 10.1039/C2SM26811F. [DOI] [PMC free article] [PubMed] [Google Scholar]
- 46.Fournier J, Galatola P. Modeling planar degenerate wetting and anchoring in nematic liquid crystals. Europhys Lett. 2005;72(3):403–409. [Google Scholar]
- 47.Ravnik M, Žumer S. Landau-de Gennes modelling of nematic liquid crystals colloids. Liq Cryst. 2009;36(10-11):1201–1214. [Google Scholar]
- 48.Tomar V, Hernández SI, Abbott NL, Hernández JP, de Pablo JJ. Morphological transitions in liquid crystal nanodroplets. Soft Matter. 2012;8(33):8679–8689. [Google Scholar]
- 49.Ondris-Crawford R, et al. Microscope textures of nematic droplets in polymer dispersed liquid crystals. J Appl Phys. 1991;69(9):6380–6386. [Google Scholar]


