Significance
Richard Feynman famously described the hypothesis “All things are made of atoms” as among the most significant of all scientific knowledge. How atoms are arranged in “things” is an interesting and natural question. However, aside from perfect crystals and ideal gases, understanding these arrangements in an insightful yet tractable manner is challenging. We introduce a unified mathematical framework for classifying and identifying local structure in imperfect condensed matter systems using Voronoi topology. This versatile approach enables visualization and analysis of a wide range of complex atomic systems, including highly defected solids and glass-forming liquids. The proposed framework presents a new perspective into the structure of discrete systems of particles, ordered and disordered alike.
Keywords: structure classification, Voronoi topology, atomic systems visualization
Abstract
Physical systems are frequently modeled as sets of points in space, each representing the position of an atom, molecule, or mesoscale particle. As many properties of such systems depend on the underlying ordering of their constituent particles, understanding that structure is a primary objective of condensed matter research. Although perfect crystals are fully described by a set of translation and basis vectors, real-world materials are never perfect, as thermal vibrations and defects introduce significant deviation from ideal order. Meanwhile, liquids and glasses present yet more complexity. A complete understanding of structure thus remains a central, open problem. Here we propose a unified mathematical framework, based on the topology of the Voronoi cell of a particle, for classifying local structure in ordered and disordered systems that is powerful and practical. We explain the underlying reason why this topological description of local structure is better suited for structural analysis than continuous descriptions. We demonstrate the connection of this approach to the behavior of physical systems and explore how crystalline structure is compromised at elevated temperatures. We also illustrate potential applications to identifying defects in plastically deformed polycrystals at high temperatures, automating analysis of complex structures, and characterizing general disordered systems.
Condensed matter systems are often abstracted as large sets of points in space, each representing the position of an atom, molecule, or mesoscale particle. Two challenges frequently encountered when studying systems at this scale are classifying and identifying local structure. Simulation studies of nucleation, crystallization, and melting, for example, as well as those of defect migration and transformation, require a precise understanding of which particles are associated with which phases, and which are associated with defects. As these systems are abstracted as large point sets, these dual challenges of classifying and identifying structure reduce to ones of understanding arrangements of points in space.
A primary difficulty in classifying structure in spatial point sets arises from a tension between a desire for completeness and the necessity for practicality. The local neighborhood of a particle within an ensemble of particles can be completely described by a list of relative positions of each of its neighbors. However, although such a list of coordinates is complete in some sense, this raw data provides little direct insight, leaving us wanting for a practical and more illuminating description. This tension is often mediated by the choice of an “order parameter,” which distills structural data into a single number or vector, and which is constructed to be both informative and computationally tractable (1).
A central limitation of conventional order parameters is exhibited in degeneracies that arise in describing neighborhoods that are structurally distinct but map to identical order parameter values. Some order parameters classify particles in face-centered cubic (FCC) and body-centered cubic (BCC) crystals identically, whereas others classify particles in FCC and hexagonal close-packed (HCP) crystals identically (2). Similarly, particles located near defects in a low-temperature crystal can have order parameter values identical to those of particles in a high-temperature defect-free crystal. These degeneracies point to an inherent incompleteness in such order parameter classifications of local structure. Consequently, different order parameters are necessary to study different systems (1, 2).
In this paper, we propose a mathematical framework to classify local structure that avoids much of the degeneracy encountered in other approaches and which, therefore, is equally applicable to all ordered and disordered systems of particles. More specifically, the local structure around a particle is classified using the topology of its Voronoi cell (see Fig. 1). Families of Voronoi cell topologies are constructed by considering those topologies that can result from infinitesimal perturbations of an ideal structure. We demonstrate that this classification scheme is consistent with the manner in which local ordering changes in high-temperature single crystals as the temperature is raised toward their melting points. We highlight a potential use of this approach for visualizing defects in crystalline solids at high temperatures, and contrast it with previous methods. We then demonstrate an application of this approach to the automated analysis of the evolution of complex structures, where conventional methods are often inadequate. Finally, we show an application in which this approach is used to provide robust statistical−structural descriptors for characterizing disordered systems.
Fig. 1.
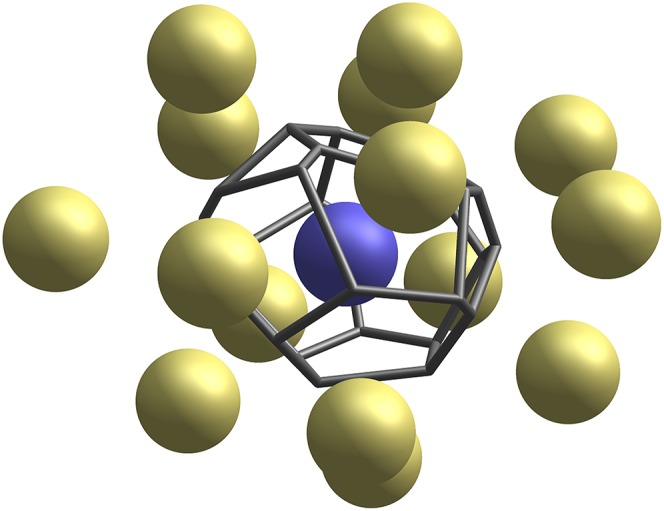
The frame of a Voronoi cell of a central particle (blue), surrounded by its nearest neighbors (gold). The topology of the Voronoi cell captures structural information about the local neighborhood.
Theory
The Configuration Space of Local Structure.
A deeper understanding of local structure can be developed through consideration of all possible arrangements of neighbors of a central particle. The local neighborhood of a particle within an ensemble of particles can be completely described by a vector of relative positions of its n nearest neighbors: , where is the relative position of the ith neighbor of a central particle. For suitably large n, any question about the local neighborhood of a particle can be answered through complete knowledge of . We use to denote the configuration space of all possible arrangements of n nearest neighbors,
| [1] |
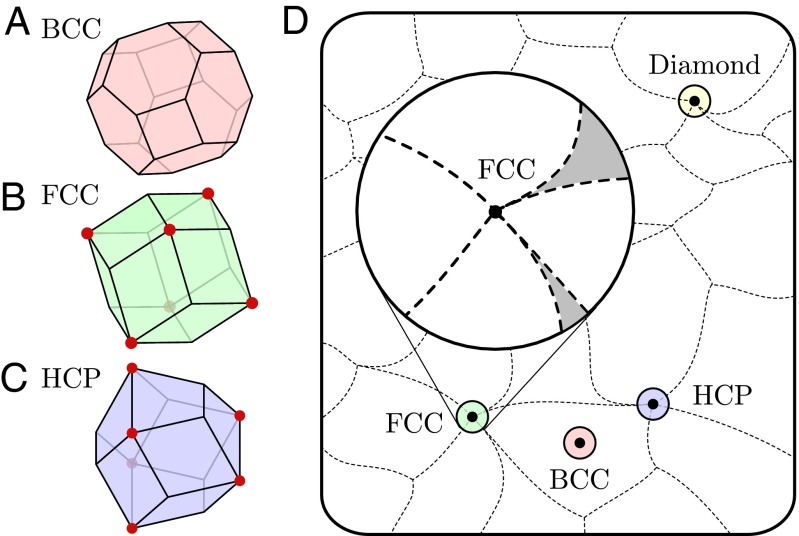
Each point in thus corresponds to a specific local arrangement of particles. Fig. 2D provides a schematic of and highlights points corresponding to local arrangements of BCC, FCC, HCP, and diamond structures. As defined in Eq. 1, the dimension of is ; ignoring rotations and scaling reduces the dimension of by 4. Ignoring permutations of the n neighbors and disallowing multiplicities further changes the geometry and topology of , but not its dimension.
Fig. 2.
Voronoi cells of particles in (A) BCC, (B) FCC, and (C) HCP crystals. Vertices at which more than four Voronoi cells meet are marked by red circles. Small perturbations of the particle positions result in topological changes near these vertices. (D) Schematic of , the space of all possible configurations of n neighbors. This space can be divided into regions on which the Voronoi cell topology is constant. The topology of a point that lies on the boundaries of multiple regions is unstable, and infinitesimal perturbations of the neighbors will result in a change of topology. Inset shows the neighborhood around ; unshaded regions indicate primary types, and shaded ones indicate secondary types.
Order parameters can be thought of as functions that map to a lower-dimensional order parameter space; order parameter spaces most commonly used are , where d is substantially smaller than . Each choice of order parameter results in a different subdivision of into regions on which that order parameter is constant; for real-valued continuous functions, these regions are commonly known as level sets. To help understand the degeneracy observed in continuous order parameter methods, consider that for every continuous mapping ϕ from an unbounded high-dimensional space to a lower-dimensional space, there exist points arbitrarily far apart, but for which and are identical (3). The continuity of an order parameter thus entails the kind of degeneracy highlighted above. In contrast, discrete order parameters are not subject to this limitation, as distances between points with identical order parameter values can be bounded. This motivates the question of how to reasonably subdivide . We now show that Voronoi topology offers one such approach.
Voronoi Topology.
For a fixed set of particles, the Voronoi cell of a central particle is the region of real space closer to that particle than to any other (4). Fig. 1 illustrates a central particle, its Voronoi cell, and 15 neighboring particles. Two particles whose Voronoi cells share a face are called neighbors. We identify two Voronoi cells as having the same topology, or “topological type,” if there exists a one-to-one correspondence between their sets of faces that preserves adjacency.
The topology of the Voronoi cell of a particle describes the manner in which neighbors of a particle are arranged relative to it. An n-sided face, for example, indicates a pair of particles that have n neighbors in common. The topology of a Voronoi cell thus provides a robust description of how neighbors are arranged relative not only to a central particle but also to one another. In this sense, it is a good description of local structure.
Voronoi cell topology also provides a natural decomposition of into regions in which the Voronoi cell topology is constant, as illustrated in Fig. 2D. We consider this decomposition natural because it allows us to coarse-grain the effects of small perturbations on local structure. Small perturbations of the particle coordinates correspond to small displacements in , and because the Voronoi topology does not change for almost all points under small perturbations, these small perturbations, which are often unimportant, are naturally ignored without the introduction of an artificial cutoff (2).
Voronoi cell topology was first introduced by Bernal and others to study the atomic structure of liquids (5–7), and has been subsequently applied to study a wide range of condensed matter systems, including random sphere packings (7, 8), finite-temperature crystals (9), and metallic glasses (10). In those studies, however, the topology of a cell was characterized by counting its types of faces (e.g., triangles and quadrilaterals), but it ignored the way in which those faces are arranged. Although this limited description has been used to study some aspects of crystallization (11), it cannot distinguish particles whose local environments are FCC from those whose local environments are HCP, as both Voronoi cells have 12 four-sided faces. In previous work (12, 13), the authors have shown how to use a graph-tracing algorithm introduced by Weinberg (14) to efficiently compute strings that encode a complete description of the Voronoi cell topology; see Materials and Methods for further details.
A second limitation arising in traditional Voronoi approaches results from abrupt changes in topology due to small geometric perturbations. Consider, for example, that Voronoi cells of particles in FCC and HCP crystals are topologically unstable: Because some vertices are shared by more than four Voronoi cells (see Fig. 2), infinitesimal perturbations of the particle positions, such as those arising from nonhydrostatic strain or thermal vibrations, will change their topology (15). This problem has been sufficiently challenging to limit the utility of conventional Voronoi approaches in studying even slightly perturbed crystal structures (2). This problem can be solved through the classification of topological types described in the following section.
Theory of λ-Types.
In this section, we show how topological types can be classified using the approach developed in The Configuration Space of Local Structure and Voronoi Topology. On a basic level, every arrangement of neighbors relative to a central particle can be described by its Voronoi cell topology. Families of topological types associated with a particular structure can then be defined as sets of types obtained through infinitesimal perturbations of that structure. This classification scheme enables a description of the effects of small strains and thermal vibrations on local structure, and provides a robust framework suitable for theoretical and numerical analysis.
Every local arrangement of neighbors λ is described by a distinct point in , and subsequently corresponds to a unique Voronoi cell topology . For example, if BCC, then describes a particle that has the same local environment as a particle in a perfect BCC crystal; its Voronoi cell topology is the truncated octahedron, illustrated in Fig. 2A.
A suitable distance function on allows us to define sets of topological types associated with infinitesimal perturbations as follows. We let be a ball of radius ε centered at . This region of corresponds to configurations obtained through small perturbations of a particle and its neighbors, where ε controls the magnitude of such a perturbation. The set of topological types obtained from all possible perturbations of with magnitude smaller than ε is denoted . We define the family of topological types associated with infinitesimal perturbations of λ as the limiting set
| [2] |
In more physical terms, is the set of all topological types that can be obtained through arbitrarily small perturbations of a central particle and its neighbors. The Voronoi cell topology of points in the interior of a region in remains unchanged by small perturbations. In contrast, points such as and are located at the boundaries of multiple regions, and small perturbations entail a change in Voronoi cell topology. Thus, and consist of multiple topological types, whereas , located in the interior of a region, consists of a single type. If a topological type is in , then we say that it is a λ-type. Note that a topological type can belong to multiple families; this indeterminacy will be considered below. This classification of λ-types allows us to account for topological instability without modifying the sample data by collapsing edges or faces using ad hoc criteria (e.g., cutoffs) (2, 9).
Among λ-types, a further distinction can be drawn based on the manner in which the Voronoi cell topology subdivides . Using a suitable volume measure Vol, we define the ideal frequency of a topological type τ relative to as follows:
| [3] |
where is the set of points in whose Voronoi cells have topology τ. If , we call τ a primary λ-type; if , we call it a secondary λ-type. The Inset in Fig. 2D highlights a number of regions incident with . Some of those regions meet at finite solid angles; therefore, their fractional volumes within an ε-ball converge to positive values as ; these are primary FCC types. In contrast, fractional volumes tend to zero as for other regions that meet at cusps; these are secondary FCC types.
The distinction between primary and secondary types appears to result from the manner in which topological instabilities resolve when perturbed. To illustrate this distinction, Fig. 3A shows an unstable vertex shared by six Voronoi cells in FCC or HCP crystals; such vertices are marked by red circles in Figs. 2 B and C. Fig. 3B depicts the most common manner in which such an unstable vertex resolves upon small perturbations of neighboring particles (15). In this resolution, a new four-sided face is formed between two nonadjacent Voronoi cells; all unstable vertices resolve in this manner in primary types. A less common resolution can also occur as a result of cooperative motion of neighboring particles. In this resolution, depicted in Fig. 3C, two triangular faces are created (11); secondary types can include such resolutions.
Fig. 3.

(A) An unstable vertex shared by six Voronoi cells in FCC or HCP crystals; such vertices are marked by red circles in Fig. 2 B and C. A small perturbation will cause the vertex to resolve into either (B) a four-sided face or (C) a pair of adjacent triangular faces; these resolutions are associated with primary and secondary types, respectively.
Determining is feasible through consideration of all possible ways in which unstable vertices can resolve. For example, the ideal FCC Voronoi cell, illustrated in Fig. 2B, has six unstable vertices. In primary types, each such vertex resolves in a manner illustrated in Fig. 3B, in one of three directions. More specifically, the unstable vertex can transform in such a way that the central cell gains a square face, or else gains an edge in one of two directions. We consider all possible combinations of these resolutions over the six unstable vertices, and calculate the topological types of the resulting polyhedra using the algorithm developed in ref. 13; a total of 44 distinct topological types occur in this manner. In secondary types, unstable vertices can also resolve in the manner illustrated in Fig. 3C, or else remain unstable. An additional 6,250 topological types can occur in this manner. A similar approach can be followed to determine for other structures. Additional details can be found in Supporting Information.
Finite-Temperature Crystals
The proposed distinction between primary and secondary types is supported by atomistic simulation. We studied the atomic structure of three model materials, BCC tungsten (16), FCC copper (17), and HCP magnesium (18), at elevated temperatures using molecular dynamics (MD) a canonical ensemble (NPT) (19). Simulated systems contained 1,024,000, 1,372,000, and 1,029,600 atoms, respectively, in periodic supercells. In each simulation, a defect-free crystal was heated from in increments of 50 K and equilibrated for 50 ps at each temperature. Fig. 4 shows how the distribution of topological types changes with temperature; each curve indicates the frequency of a single topological type.
Fig. 4.

Frequencies of all λ-types and all non-λ-types that appear in the single-crystal (A) BCC tungsten, (B) FCC copper, and (C) HCP magnesium as a function of temperature upon heating from to 150% of the bulk melting temperature. Blue curves indicate primary λ-types, pink curves indicate secondary λ-types, and gray curves indicate non-λ-types. Thick curves indicate the sum of all frequencies of the corresponding color; note that there is only one primary λ-type and no secondary λ-types for BCC.
Types can be grouped according to the shape of their frequency curves. Frequencies of one group of types approach finite values as , and change very little with temperature (blue curves in Fig. 4). Frequencies of a second group rapidly approach zero as (pink curves). Types of a third group only appear at high temperatures (gray curves). Remarkably, these groups correspond exactly to the sets of primary λ-types, secondary λ-types, and non-λ-types for each system, as enumerated using the analysis of instabilities, described above. The theory of λ-types is thus consistent with observed results and suggests an approach for analyzing thermal effects.
One noteworthy feature of Fig. 4 is the similarity between FCC and HCP, in contrast to BCC. These general behaviors appear to depend primarily on the crystal structure rather than on bonding particulars. Indeed, preliminary investigations show that when atoms in BCC, FCC, and HCP crystals are perturbed from their equilibrium positions with a Gaussian noise whose magnitude scales with temperature [i.e., an Einstein model (20)], the distribution of topological types changes in a manner similar to that observed in Fig. 4.
A second notable feature is the total frequency of λ-types in the liquid phases of the three systems. In liquid tungsten, the unique BCC type accounts for less than of all atoms just above , where is the bulk melting temperature. In contrast, liquid copper consists of roughly 20% FCC types, and liquid magnesium consists of roughly 30% HCP types, just above . These structural data are relevant in studying physical processes such as crystallization (21) and melting (22).
A third feature that stands out is the high fraction of λ-types in the FCC and HCP samples at temperatures just below melting. In FCC, 94% of all atoms are classified as having FCC local structure just below melting; in HCP, this number is 96%. At 0.85 , these numbers are over 99% in both systems. This suggests a natural use of λ-types for identifying structure in highly perturbed atomistic systems, such as those at high temperatures.
We next consider several applications of the proposed approach to illustrate some of its unique features.
Defect Visualization
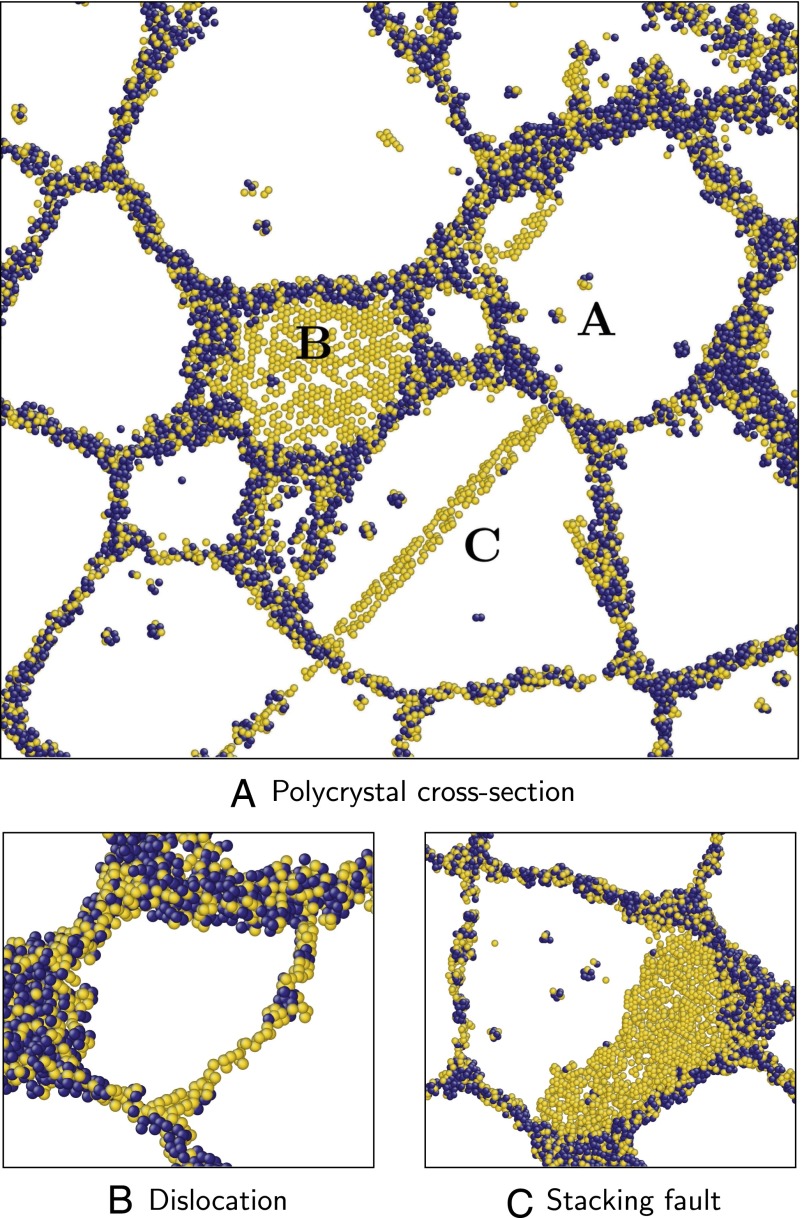
As noted, the high frequencies of λ-types in single crystals, even at extremely high temperatures, suggest their use for visualization of local structure in atomic systems. Fig. 5 shows thin cross-sections from an FCC aluminum polycrystal prepared using MD (23). The sample was obtained by annealing a microstructure obtained through simulated grain growth (24), plastically deforming it at low temperature, and then thermalizing it at . In these figures, atoms that are FCC types are not shown for clarity; among the remaining atoms, those that are HCP types are shown in gold, and all other atoms are shown in dark blue.
Fig. 5.
Polycrystalline aluminum at 938 K (); the width of each cross-section is 2 nm. Atoms that are FCC types are not shown for clarity. Of the ones remaining, those that are HCP types are shown in gold, and all other atoms are shown in dark blue. Grain boundaries are seen as a network of non-FCC types (dark blue and gold atoms). In cross-section A, defects are labeled as follows: vacancies, A; twin boundary, B; and stacking fault, C. Cross-sections B and C show magnified images of a dislocation and stacking fault. (A) Polycrystal cross-section. (B) Dislocation. (C) Stacking fault.
In Fig. 5A, grain boundaries can be identified as a network of non-FCC-type atoms. Vacancies (region A) can be identified within the grain interiors as small clusters of non-FCC-types; as only a thin cross-section of the material is shown, not all atoms adjacent to these defects appear in the figure. A twin boundary (region B) and stacking fault (region C) can be identified as one and two layers of gold-colored (HCP, non-FCC type) atoms, respectively. Fig. 5 B and C shows magnified images of a dislocation and a stacking fault inclined at a low angle relative to the cross-section plane.
As noted earlier, individual Voronoi topologies can belong to multiple families; we use the term “indeterminate type” to refer to such cases. This indeterminacy complicates the visualization procedure suggested here, as many types in also belong to . For this reason, some atoms that belong to the twin boundaries and stacking faults are not seen in Fig. 5 A and C. This shortcoming can be easily addressed within the topological framework, and is discussed in Supporting Information.
The utility of the proposed topological framework for local structure classification and identification is useful for finite-temperature simulations of atomic systems containing defects. Of particular interest are the many phenomena that are only of interest at high temperature, such as dislocation climb (25), interface thermal fluctuation (26), and defect kinetics under irradiation conditions (27). Conventional visualization methods require quenching or temporally averaging a sample before crystal defect analysis (2). In general, we do not know whether this “tampering” with the data leads to significant discrepancies between the observed structures and the actual finite-temperature ones. Remarkably, the proposed approach identifies all defects in Fig. 5 and does not erroneously identify any bulk atoms as being adjacent to defects, all at very high temperature and without quenching or time averaging. The topological approach thus provides a natural method for identifying and visualizing local structure that involves no ad hoc cutoff parameters and is robust at high temperatures. This opens a new opportunity for in situ structure analysis of atomic simulations at temperature, potentially identifying new high-temperature mechanisms and defect structures.
Comparison with Other Methods
Although a complete survey of existing methods for analyzing structure in high-temperature atomic systems is beyond the scope of this introductory paper, we briefly consider how visualization using λ-types compares with three of the most frequently used order parameters: centrosymmetry (CS) (28), bond angle analysis (29), and adaptive common neighbor analysis (2, 30).
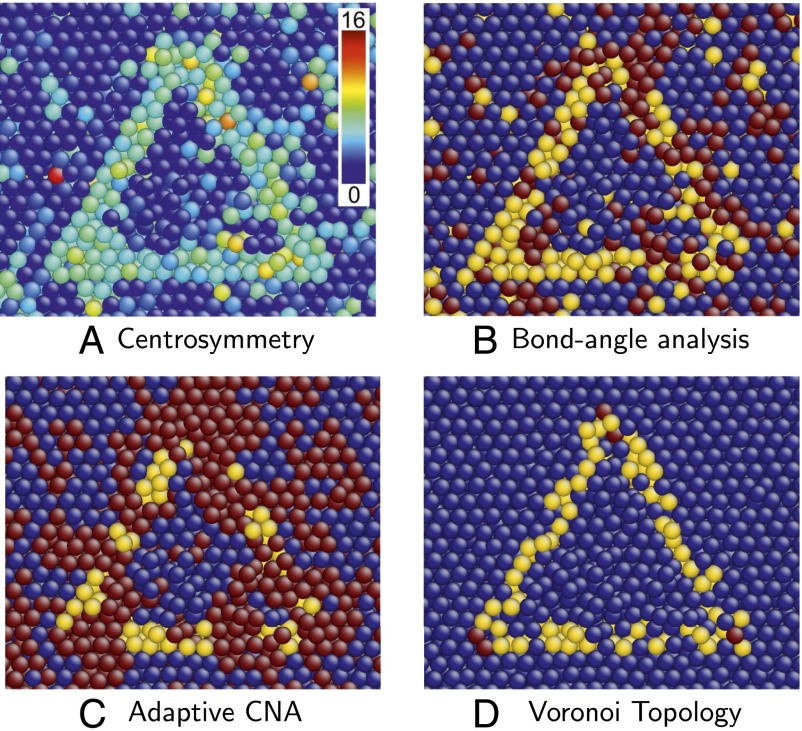
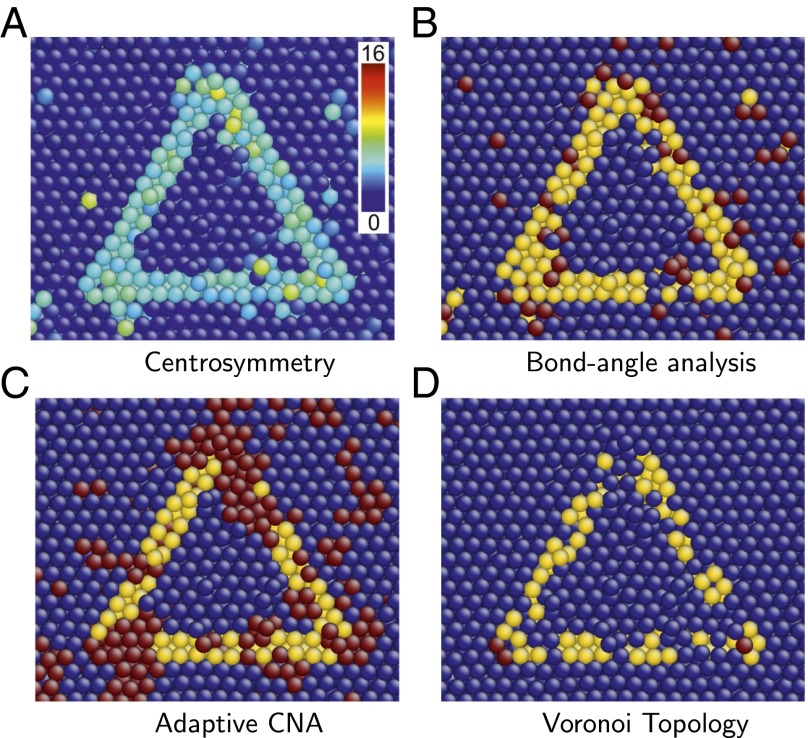
As a concrete example, we consider a stacking fault tetrahedron (SFT) (31) in a high-temperature FCC aluminum single crystal. An SFT is a 3D defect consisting of four stacking faults that form the faces of a tetrahedron. The interior of an SFT is an FCC crystal; its edges are stair rod dislocations (25). Fig. 6 illustrates a cross-section through the center of an SFT and parallel to one of its four faces; the intersection of the SFT boundary with the viewing plane is an equilateral triangle. This perfect SFT was constructed in FCC copper and then thermalized at 0.85 . CS, bond angle, and adaptive common neighbor analyses were all performed using the OVITO software package (32).
Fig. 6.
Cross-section of an SFT in copper at 85% of its melting temperature, colored using several popular visualization approaches, and the proposed one. In B and C, dark blue, yellow, and red indicate atoms in FCC, HCP, and other local environments, respectively. In D, dark blue, yellow, and red indicate atoms that are FCC types, HCP but not FCC types, and all other types, respectively. (A) CS. (B) Bond angle analysis. (C) Adaptive common-neighbor analysis (CNA). (D) Voronoi topology.
Fig. 6A shows atoms colored using the CS order parameter. In this coloring, atoms belonging to faces of the SFT have higher CS values than those in the FCC environment, as expected. Note, however, that many atoms inside and outside the SFT also have high CS values. Such atomic environments do not, however, indicate crystal defects but rather result from thermal fluctuations that locally distort the atomic environment. The inability of the CS order parameter to distinguish structural defects from thermal perturbations requires users to quench a system before analyzing it.
Fig. 6 B and C shows atoms colored using bond angle analysis and adaptive common neighbor analysis, respectively, also at 0.85 . In these images, many atoms belonging to the SFT faces are classified as having HCP local structure, as expected. However, both methods identify many atoms away from the stacking faults as structural defects, despite the absence of other defects in the crystal. Moreover, application of bond angle analysis incorrectly identifies many atoms in the bulk as having HCP local structure. Although the general shape of the SFT can be discerned in Fig. 6 B and C, the details are ambiguous, and automated location of the SFT in an atomic ensemble is difficult or impossible at the simulation temperature.
These results are in contrast with the picture produced using Voronoi topology, illustrated in Fig. 6D. The approach taken here provides the clearest representation of the SFT. In this case, every atom characterized as being in an HCP environment is on an SFT face, without exception, despite the high temperature and the strain fields of the constituent partial dislocations. Moreover, all atoms not at the surface of the SFT are correctly identified as being FCC type. Finally, atoms lying at the corners of the triangular cross-section through the SFT triangle are identified as neither stacking faults (HCP type) nor bulk type but as having a distinct local structure; these are the dislocation cores. The sole weakness of this visualization procedure results from indeterminate types that belong to both and and whose neighborhoods are identified as FCC rather than HCP. This limitation can be addressed and is discussed in Supporting Information.
This topological approach to structure visualization can also be applied to low-temperature systems such as those obtained through quenching (inherent structures); an example can be found in Supporting Information.
Grain Boundary Characterization and Analysis
The proposed framework also enables the analysis of structurally complex systems in an automated manner. To illustrate this capability, we analyze how a particular grain boundary transforms between a series of distinct structures as a result of absorbing point defects, as it may, for example, under irradiation conditions.
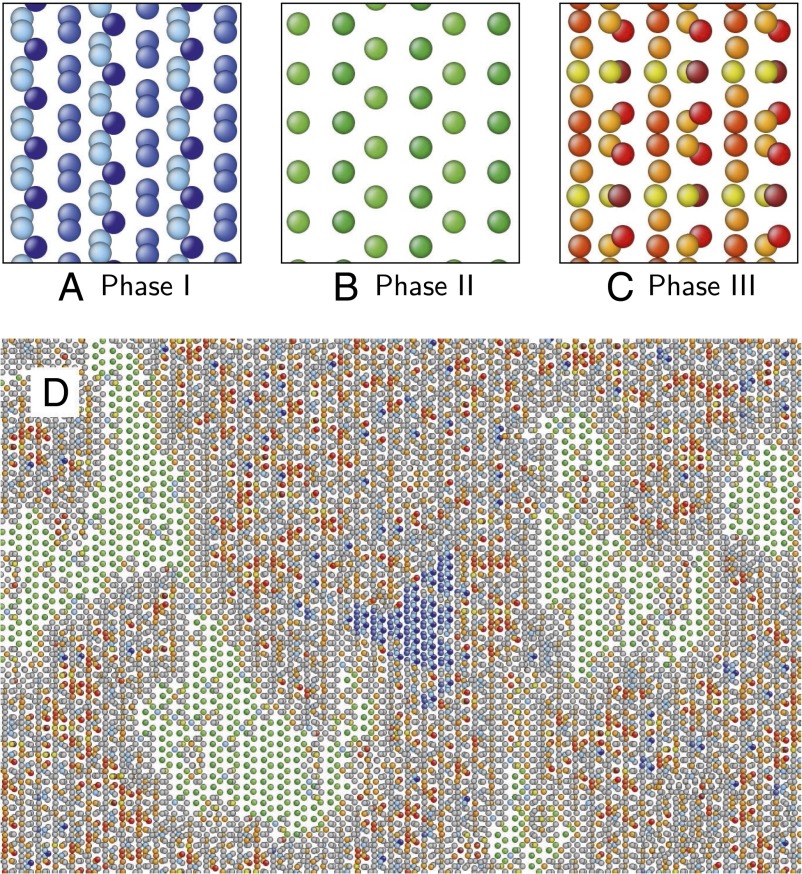
In particular, we consider a [001] (310) symmetric tilt boundary in a BCC tungsten bicrystal. This grain boundary exhibits three structurally distinct, stable phases. We begin by characterizing these phases using the Voronoi topologies of the constituent atoms; these phases are illustrated in Fig. 7 A−C. Atoms are colored according to their topological type; BCC-type atoms are not shown for clarity. Phase I consists of three distinct topological types, colored in different shades of blue; phase II consists of two distinct topological types, colored in shades of green; and phase III consists of six topological types, colored in shades of red, orange, and yellow.
Fig. 7.
(A−C) Three structurally distinct stable phases of the [001] (310) symmetric tilt boundary in BCC tungsten, arbitrarily labeled phase I (A), phase II (B), and phase III (C). Atoms are colored according to topological type, each assigned a unique color; BCC-type atoms are not shown for clarity. (D) An image from a large simulation of the same boundary, initially constructed uniformly of the phase I structure, and into which self-interstitial atoms have been randomly placed at a constant rate at 1,500 K. Atoms are colored by topological type, as shown in A−C; BCC-type atoms are not shown for clarity; all other atoms are shown in gray.
We initialize the simulation by constructing a large bicrystal containing a [001] (310) symmetric tilt boundary at 0 K and uniformly of the phase I structure. The sample is then heated to 1,500 K, and equilibrated at this temperature for 4 ns. Self-interstitial atoms are then inserted into random locations in the boundary plane at a rate of 1.62 atoms per square nanometer per nanosecond. We analyze the resulting grain boundary structure throughout the MD simulation using Voronoi topology. Fig. 7D shows a grain boundary with distinct domains of all three grain boundary phases, suggesting a phase transition driven by absorption of self-interstitial atoms.
To study the transformation of the grain boundary structure, we track the fraction of each phase present during the evolution. We begin by counting the number of atoms in the sample with topological types associated with each of the three phases. We next calculate the number of non-BCC-type atoms per square nanometer in each of the three phases. Finally, we normalize the λ-type counts for the three phases by dividing by the number of λ-types per unit area and the total grain boundary area.
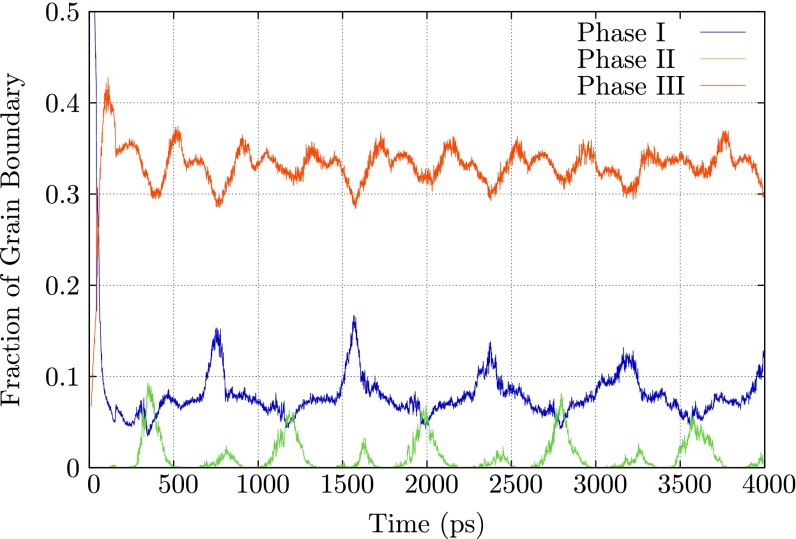
Fig. 8 shows the fraction of the three phases over time, starting when the first self-interstitial atom is added to the grain boundary. During the initial 100 ps, there is a sharp decrease in phase I, accompanied by a rapid growth of phase III. After ∼300 ps, the grain boundary structure settles into a pattern of increasing and decreasing phase I, phase II, and phase III fractions, all with the same period. The minimum in the phase III fraction corresponds to the maximum in the phase I fraction, and the maximum in the phase II fraction corresponds to minima in the phase I and III fractions. The period is commensurate with the time required to add a full (310) plane of atoms to the sample. At this temperature, the equilibrium grain boundary structure is dominated by phase III, phase I (the equilibrium structure at 0 K) never completely disappears, and phase II is present only in a very small fraction of the grain boundary.
Fig. 8.
The fraction of the [001] (310) symmetric tilt boundary in BCC tungsten occupied by its structurally distinct, stable phases during the insertion of self-interstitial atoms at a fixed rate.
This example illustrates the power of the topological approach for automating structure analysis in systems with complex defect structures and for determining defect statistics. We defer a more complete analysis of this example to a future study of grain boundary structure evolution during irradiation.
Disordered Structures
Finally, we consider how the proposed approach can be used to characterize disordered systems such as liquids and glasses. In contrast to conventional order parameters—which are typically useful for studying either ordered or disordered systems, but not both—the approach taken here can be applied effectively to all kinds of systems. As the topological type of each Voronoi cell provides a robust structural description of the local neighborhood of a particle, the distribution of topological types in a system can be interpreted as a statistical−topological description of the system as a whole. This ability to characterize both ordered and disordered systems within the same framework is of particular importance for studying phase transitions between ordered and disordered phases, as well as between distinct disordered phases.
Using MD, we simulate two disordered systems of copper atoms: a high-temperature liquid (HTL) equilibrated at roughly , and a glass-forming liquid (GFL) obtained by undercooling the initial liquid to roughly ; each system contained 1,372,000 atoms. The distributions of topological types in the two systems enable us to describe structural features of the systems in a robust and quantitative manner, and to observe structural differences between them.
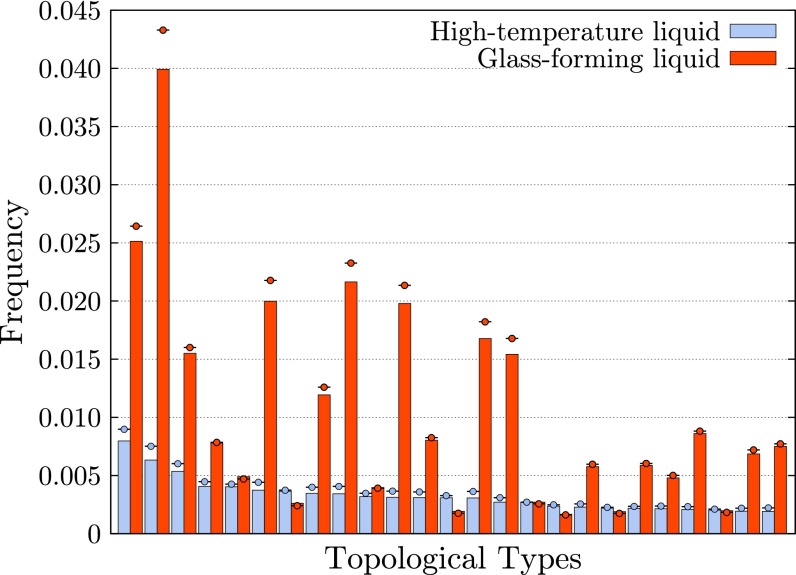
Bars in Fig. 9 show frequencies of the 50 most common topological types in the HTL, and corresponding frequencies in the GFL. The most common types in the HTL do not occur nearly as frequently as the most common types in the GFL. In particular, the sum of frequencies of the 5 most common topological types in the GFL is greater than the sum of frequencies of the 50 most common types in the HTL. In this sense, the GFL is substantially more ordered than the HTL. Note that in an ideal gas, in which there is no interaction between particles, the distribution of types is considerably less concentrated than in either of these systems (33).
Fig. 9.
Frequencies of the 25 most common topological types in liquid copper at , and corresponding frequencies in the GFL copper at ; circles indicate frequencies in quenched samples.
Circles in Fig. 9 indicate corresponding frequencies in systems obtained by quenching these two systems. When quenched, frequencies of these common types change only modestly. This again indicates that the current method is relatively insensitive to thermal vibrations.
Other means of quantifying disorder in atomic systems have been widely developed, and have been used to distinguish distinct types of disordered systems. Structural correlation functions (1) and configurational entropy (34–36) are both nonlocal descriptors that have been used to study disordered systems. Other recent work has focused on local structural measures (5, 10); our approach is in this vein.
Conclusions and Discussion
We have introduced a mathematical approach toward classifying and identifying local structure of a particle within a system of particles. Applications highlight its utility in analyzing atomistic data sets, such as those produced by molecular dynamic simulations. In particular, the theory of λ-types enables identification and visualization of defects in ordered systems at high temperatures. This capability can play an important role for in situ study of high-temperature mechanisms currently inaccessible to current structure identification methods. The proposed framework also enables a new approach for characterizing and identifying defects. This in turn allows for an automated approach for studying systems in which structural features evolve. Finally, Voronoi topology enables the characterization of disordered systems in a statistical manner, through the distribution of topological types. We have illustrated the potential of this approach in distinguishing an HTL from a GFL.
Any description of structure within a fixed distance of a particle will be unable to capture all long-range structural features of a system. Fig. 5 provides clear examples of this limitation, where an atom with HCP local environment might be part of a twin boundary, stacking fault, or other defect; further analysis is required to distinguish between these. The analysis of local structure introduced here can be integrated into tools such as those developed in ref. 37 to automate long-range structural analysis.
The authors have developed software to automate this analysis, and it is available upon request.
Materials and Methods
Deciding whether two Voronoi cells have the same topological type is equivalent to deciding whether two planar graphs are identical, as the edge boundary of every Voronoi cell is a planar graph. For each particle in a system, we compute a “code” that records the graph structure of the edge boundary network of its Voronoi cell. To do this, we first determine the Voronoi cell using the Voro++ software package (38), which computes a list of faces, each represented as an ordered sequence of vertices. Next, we use a graph-tracing algorithm to compute a code for this planar graph. More specifically, the following algorithm of Weinberg (14) is followed: (a) An initial vertex is chosen and assigned the label 1. (b) An edge adjacent to that vertex is chosen, and travel begins along that edge. (c) If an unlabeled vertex is reached, it is labeled with the next unused integer and we “turn right” and continue. (d) If a labeled vertex is reached after traveling along an untraversed edge, we return to the last vertex along the same edge but in the opposite direction. (e) If a labeled vertex is reached after traveling along an edge previously traversed in the opposite direction, we “turn right” and continue; if that right-turn edge has also been traversed in that direction, we turn along the next right-turn edge available; if all outgoing edges have been traversed, we stop. At this point, each edge in the graph has been traversed once in each direction; the ordered list of the vertices visited is called a code.
Codes are constructed for each choice of initial vertex and edge, and for each of two spatial orientations; all labels are cleared before producing each code. For a Voronoi cell with e edges, 4e codes are generated, each an ordered list of 2e integer labels. Each code completely describes the Voronoi cell topology, and so it is sufficient to only record one of them. A code for a typical Voronoi cell requires less than 100 bytes of storage. Additional details can be found in refs. 12, 14, and 39.
The use of Voronoi topology for structure identification is computationally efficient. In preliminary tests, the Voronoi topology of 1 millions atoms could be calculated on a desktop computer in less than 1 min. By contrast, conventional approaches used in high-temperature structure analysis require that systems be quenched before visualization. A complete quench necessary to obtain the inherent structure can require several hours of computation for a system of comparable size.
Enumerating Primary and Secondary Types
In the main text, we considered families of topological types associated with particular structures. In this section, we provide some additional detail regarding the determination of these families, and report the numbers of types in several of them, as well as in the overlap between multiple families.
The Voronoi cell of BCC is topologically stable in the sense that infinitesimal perturbations of atomic coordinates will not change its topology. Therefore, consists of a single primary type and no secondary types.
In contrast, Voronoi cells of FCC and HCP are unstable, and infinitesimal perturbations of atomic coordinates will change their topologies. The instability of these Voronoi cells can be detected in vertices that are incident with four edges; there are six such unstable vertices in FCC and HCP. As each unstable vertex can either remain unstable, resolve in one of three primary directions, or resolve in one of four secondary directions (see Fig. 3), we must check 262,144 configurations that can result from all infinitesimal perturbations. We compute the topology of each configuration using the algorithm described in Materials and Methods. Multiple configurations can result in the same Voronoi cell topology due to symmetries of the unperturbed configuration.
For FCC, we find 44 primary types and 6,250 secondary types; of the secondary types, only 2,771 have no unstable vertices. Fig. S1 illustrates several Voronoi cells observed in a finite-temperature FCC crystal; their topologies are given by this enumeration technique. For HCP, we find 66 primary types and 21,545 secondary types; of the secondary types, only 9,490 have no unstable vertices.
Fig. S1.

Examples of Voronoi cells in a perturbed FCC crystal.
Although the determination of topological types associated with a particular structure may require substantial computation, this needs only be done once per structure. Lookup tables are then created and subsequently referenced when analyzing atomistic data sets. Data for several common crystal structures are available from the authors upon request.
In the main text, we noted that certain types can belong to several families (indeterminate types). More specifically, we note that the unique type belonging to also belongs to and . Furthermore, and share 23 primary types in common and 1,352 secondary types in common.
Resolving Indeterminate Types
In the main text, we noted practical challenges created by the overlap of multiple families of types. In particular, when attempting to visualize defects in an FCC environment, some atoms were mistakenly identified as belonging to the FCC bulk instead of to the HCP-like defect. Although a thorough analysis of this problem is beyond the scope of this paper, we briefly consider one approach toward resolving it.
Indeterminate types are Voronoi topologies that can be obtained through infinitesimal perturbations of multiple distinct structures. Fig. 2 in the main text shows a number of regions in configuration space incident with both and . One way of deciding whether a point in this region should be classified as FCC or HCP involves computing distances in this configuration space: Points close to should be classified as FCC, and those close to should be classified as HCP. Points closer to than to either or should be classified as BCC.
Although theoretically appealing, there is no practical manner in which to calculate these distances, because of the complicated topology of this configuration space. More specifically, the standard metric on cannot be used due to the actions of the rotation, renormalization, and permutation groups acting on it.
A more practical approach involves perturbing configurations of particles as follows. If the Voronoi type of a particle is indeterminate, we randomly perturb the particle and its nearby neighbors; this corresponds to a small perturbation of in configuration space. The Voronoi cell of the perturbed configuration is calculated; this procedure is repeated several times. If all perturbations result in indeterminate or HCP types (the latter occurring at least once), then the particle is classified as being HCP type.
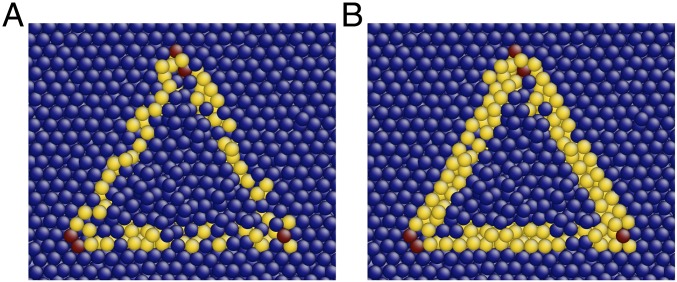
We consider an SFT in a single copper crystal that was heated to 85% of its melting temperature; this system was considered in Comparison with Other Methods. Fig. S2 shows the SFT colored by the approach considered in the main text and by the modification considered here. This modified approach provides a more robust visualization of the SFT than the approach suggested in the main text.
Fig. S2.
A high-temperature single crystal containing an SFT, visualized using (A) the method described in the main text and (B) the modified method proposed here.
Quantitative Comparison at High Temperatures
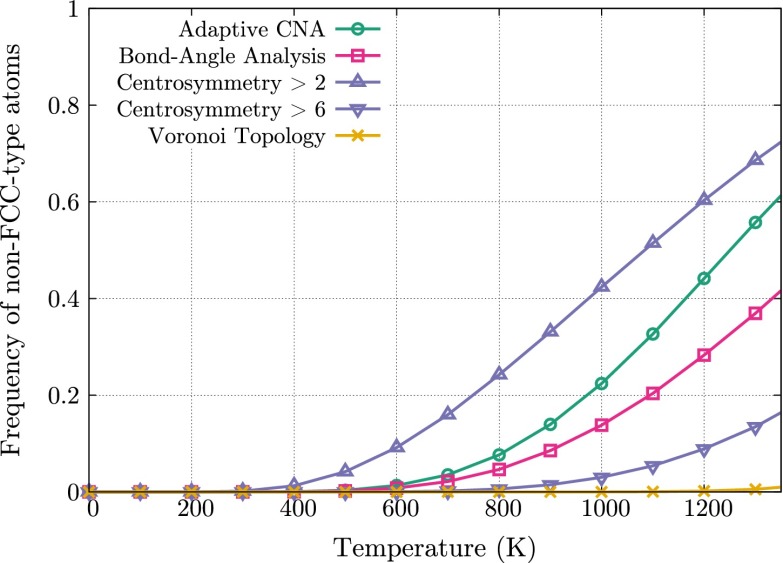
In the main text, we showed that Voronoi topology enables robust visualization of structure in high-temperature systems that cannot be obtained using conventional methods. Here we provide a direct and quantitative comparison beyond visual inspection. We begin with a system containing 1,372,000 copper atoms organized in a perfect crystal, and heat the system to just below its melting point as described in Finite-Temperature Crystals. For each order parameter considered in the main text, we calculate the frequency of atoms in this single crystal that are characterized as non-FCC type as a function of temperature. Close inspection of the system shows that there are no defects.
For each visualization method, we considered the number of atoms in this system characterized as non-FCC type. We used OVITO to compute bond angle analysis, adaptive common neighbor analysis, and CS values for each atom and at each temperature. Fig. S3 shows the frequency of non-FCC-type atoms, as measured by each of the order parameters, as a function of temperature.
Fig. S3.
Frequency of atoms characterized as non-FCC type in a copper crystal.
In contrast to the bond angle and adaptive common neighbor classifications provided by OVITO, CS is reported as a scalar requiring choice of a cutoff; atoms with CS values above this cutoff are not considered FCC. To determine an appropriate cutoff, we considered CS values of atoms adjacent to either a vacancy or an interstitial in an otherwise perfect FCC crystal. Atoms adjacent to a vacancy have a CS value of 6.20; interstitial atoms have a CS value of 13.88. In order that our choice of cutoff allowed for the detection of vacancies, we chose a cutoff of 6. We note that cutoff values as low as 0.5 and 1 can be regularly found in the literature, and so our choice of cutoff is extremely conservative.
At K, bond angle analysis, adaptive common neighbor analysis, and CS incorrectly identify over 36.9%, 55.7%, and 13.5%, respectively, of the atoms as not belonging to the FCC bulk crystal. By contrast, Voronoi topology mistakenly identifies only as such atoms as not belonging to the FCC bulk crystal.
Quenched Systems
The topological approach is not limited to studying finite-temperature systems, and can also be applied to structures obtained through quenching high-temperature samples. Fig. S4 shows the same SFT considered in the main text after quenching to 0 K, colored using the same order parameters considered in the main text.
Fig. S4.
Cross-section of an SFT in copper, after quenching from 85% of its melting temperature, colored using several popular visualization approaches, and Voronoi topology. In B and C, dark blue, yellow, and red indicate atoms in FCC, HCP, and other local environments, respectively. In D, dark blue, yellow, and red indicate atoms that are FCC types, HCP but not FCC types, and all other types, respectively. (A) CS. (B) Bond angle analysis. (C) Adaptive CNA. (D) Voronoi topology.
Although all methods successfully detect the presence of the SFT in the quenched system, CS, bond angle analysis, and adaptive common neighbor analysis also identify atoms outside the SFT as being non-FCC type. These non-FCC-type identifications are the result of small local strains that are not structural defects. Visualization of the sample through Voronoi topology does not result in any such misidentifications, providing the most robust picture of structural defects.
Acknowledgments
We gratefully acknowledge discussions with and assistance from Chris H. Rycroft and Zhaoxuan Wu. Figs. 5−7 were created with AtomEye [40]. E.A.L. and D.J.S. acknowledge support of the National Science Foundation Division of Materials Research through Award 1507013.
Footnotes
The authors declare no conflict of interest.
This article is a PNAS Direct Submission.
This article contains supporting information online at www.pnas.org/lookup/suppl/doi:10.1073/pnas.1505788112/-/DCSupplemental.
References
- 1.Truskett TM, Torquato S, Debenedetti PG. Towards a quantification of disorder in materials: distinguishing equilibrium and glassy sphere packings. Phys Rev E Stat Phys Plasmas Fluids Relat Interdiscip Topics. 2000;62(1 Pt B):993–1001. doi: 10.1103/physreve.62.993. [DOI] [PubMed] [Google Scholar]
- 2.Stukowski A. Structure identification methods for atomistic simulations of crystalline materials. Model Simul Mater Sci Eng. 2012;20(4):045021. [Google Scholar]
- 3.Landweber PS, Lazar EA, Patel N. 2015. On fiber diameters of continuous maps. arXiv:1503.07597.
- 4.Voronoï G. Nouvelles applications des paramètres continus à la théorie des formes quadratiques. Deuxième mémoire. Recherches sur les parallélloèdres primitifs. J Reine Angew Math. 1908;134:198–287. [Google Scholar]
- 5.Bernal JD. A geometrical approach to the structure of liquids. Nature. 1959;183:141–147. [Google Scholar]
- 6.Rahman A. Liquid structure and self-diffusion. J Chem Phys. 1966;45(7):2585–2592. [Google Scholar]
- 7.Finney J. Random packings and the structure of simple liquids. Proc R Soc Lond A Math Phys Sci. 1970;319:479–507. [Google Scholar]
- 8.Bernal JD, Finney JL. Random close-packed hard-sphere model. II. Geometry of random packing of hard spheres. Discuss Faraday Soc. 1967;43:62–69. [Google Scholar]
- 9.Hsu C, Rahman A. Interaction potentials and their effect on crystal nucleation and symmetry. J Chem Phys. 1979;71(12):4974–4986. [Google Scholar]
- 10.Sheng HW, Luo WK, Alamgir FM, Bai JM, Ma E. Atomic packing and short-to-medium-range order in metallic glasses. Nature. 2006;439(7075):419–425. doi: 10.1038/nature04421. [DOI] [PubMed] [Google Scholar]
- 11.Tanemura M, et al. Geometrical analysis of crystallization of the soft-core model. Prog Theor Phys. 1977;58(4):1079–1095. [Google Scholar]
- 12.Lazar EA. 2011. The evolution of cellular structures via curvature flow. PhD thesis (Princeton Univ, Princeton, NJ)
- 13.Lazar EA, Mason JK, MacPherson RD, Srolovitz DJ. Complete topology of cells, grains, and bubbles in three-dimensional microstructures. Phys Rev Lett. 2012;109(9):095505. doi: 10.1103/PhysRevLett.109.095505. [DOI] [PubMed] [Google Scholar]
- 14.Weinberg L. A simple and efficient algorithm for determining isomorphism of planar triply connected graphs. IEEE Trans Circuit Theory. 1966;13(2):142–148. [Google Scholar]
- 15.Troadec J, Gervois A, Oger L. Statistics of Voronoi cells of slightly perturbed face-centered cubic and hexagonal close-packed lattices. Europhys Lett. 1998;42(2):167–172. [Google Scholar]
- 16.Ackland G, Thetford R. An improved N-body semi-empirical model for body-centred cubic transition metals. Philos Mag A. 1987;56(1):15–30. [Google Scholar]
- 17.Mishin Y, Mehl M, Papaconstantopoulos D, Voter A, Kress J. Structural stability and lattice defects in copper: Ab initio, tight-binding, and embedded-atom calculations. Phys Rev B. 2001;63:224106. [Google Scholar]
- 18.Sun D, et al. Crystal-melt interfacial free energies in hcp metals: A molecular dynamics study of Mg. Phys Rev B. 2006;73(2):024116. [Google Scholar]
- 19.Plimpton S. Fast parallel algorithms for short-range molecular dynamics. J Comput Phys. 1995;117(1):1–19. [Google Scholar]
- 20.Einstein A. Planck’s theory of radiation and the theory of specific heat. Ann Phys. 1907;22:180–190. [Google Scholar]
- 21.Kawasaki T, Tanaka H. Formation of a crystal nucleus from liquid. Proc Natl Acad Sci USA. 2010;107(32):14036–14041. doi: 10.1073/pnas.1001040107. [DOI] [PMC free article] [PubMed] [Google Scholar]
- 22.Bai X-M, Li M. Ring-diffusion mediated homogeneous melting in the superheating regime. Phys Rev B. 2008;77(13):134109. [Google Scholar]
- 23.Mishin Y, Farkas D, Mehl M, Papaconstantopoulos D. Interatomic potentials for monoatomic metals from experimental data and ab initio calculations. Phys Rev B. 1999;59(5):3393−3407. [Google Scholar]
- 24.Lazar EA, Mason JK, MacPherson RD, Srolovitz DJ. A more accurate three-dimensional grain growth algorithm. Acta Mater. 2011;59(17):6837–6847. [Google Scholar]
- 25.Hirth JP, Lothe J. Theory of Dislocations. Wiley; New York: 1982. [Google Scholar]
- 26.Foiles SM, Hoyt J. Computation of grain boundary stiffness and mobility from boundary fluctuations. Acta Mater. 2006;54(12):3351–3357. [Google Scholar]
- 27.Fu C-C, Dalla Torre J, Willaime F, Bocquet J-L, Barbu A. Multiscale modelling of defect kinetics in irradiated iron. Nat Mater. 2004;4(1):68–74. [Google Scholar]
- 28.Kelchner CL, Plimpton S, Hamilton J. Dislocation nucleation and defect structure during surface indentation. Phys Rev B. 1998;58(17):11085. [Google Scholar]
- 29.Ackland G, Jones A. Applications of local crystal structure measures in experiment and simulation. Phys Rev B. 2006;73:054104. [Google Scholar]
- 30.Honeycutt JD, Andersen HC. Molecular dynamics study of melting and freezing of small Lennard-Jones clusters. J Phys Chem. 1987;91(19):4950–4963. [Google Scholar]
- 31.Kiritani M. Story of stacking fault tetrahedra. Mater Chem Phys. 1997;50(2):133–138. [Google Scholar]
- 32.Stukowski A. Visualization and analysis of atomistic simulation data with OVITO–The Open Visualization Tool. Model Simul Mater Sci Eng. 2010;18:015012. [Google Scholar]
- 33.Lazar EA, Mason JK, MacPherson RD, Srolovitz DJ. Statistical topology of three-dimensional Poisson-Voronoi cells and cell boundary networks. Phys Rev E Stat Nonlin Soft Matter Phys. 2013;88(6):063309. doi: 10.1103/PhysRevE.88.063309. [DOI] [PubMed] [Google Scholar]
- 34.Krekelberg WP, et al. Generalized Rosenfeld scalings for tracer diffusivities in not-so-simple fluids: Mixtures and soft particles. Phys Rev E Stat Nonlin Soft Matter Phys. 2009;80(6 Pt 1):061205. doi: 10.1103/PhysRevE.80.061205. [DOI] [PubMed] [Google Scholar]
- 35.Goel G, Krekelberg WP, Errington JR, Truskett TM. Tuning density profiles and mobility of inhomogeneous fluids. Phys Rev Lett. 2008;100(10):106001. doi: 10.1103/PhysRevLett.100.106001. [DOI] [PubMed] [Google Scholar]
- 36.Goel G, et al. Available states and available space: Static properties that predict self-diffusivity of confined fluids. J Stat Mech. 2009;2009(04):P04006. [Google Scholar]
- 37.Stukowski A, Bulatov VV, Arsenlis A. Automated identification and indexing of dislocations in crystal interfaces. Model Simul Mater Sci Eng. 2012;20(8):085007. [Google Scholar]
- 38.Rycroft CH. VORO++: A three-dimensional Voronoi cell library in C++ Chaos. 2009;19(4):041111. doi: 10.1063/1.3215722. [DOI] [PubMed] [Google Scholar]
- 39.Weinberg L. On the maximum order of the automorphism group of a planar triply connected graph. SIAM J Appl Math. 1966;14:729–738. [Google Scholar]
- 40.Li J. Atomeye: An efficient atomistic configuration viewer. Model Simul Mater Sci Eng. 2003;11(2):173–177. [Google Scholar]


