Significance
Recent severe droughts in the Amazon basin have increased interest in future climatological and ecological conditions of this region. Future changes in drought and wet periods could have enormous impacts on forest structure, biomass, and composition, but our ability to predict changes in the hydrological regime remains highly uncertain. We evaluate an ensemble of state-of-the-art climate models and demonstrate their accuracy in simulating processes influencing drought in Amazonia. These models provide projections of future properties of drought and wet periods, and indicate that different portions of the Amazon Basin undergo contrasting hydrological futures but will share a tendency toward more hydrological extremes.
Keywords: Amazon Basin, climate, precipitation extremes, CMIP5, drought
Abstract
Future intensification of Amazon drought resulting from climate change may cause increased fire activity, tree mortality, and emissions of carbon to the atmosphere across large areas of Amazonia. To provide a basis for addressing these issues, we examine properties of recent and future meteorological droughts in the Amazon in 35 climate models participating in the Coupled Model Intercomparison Project Phase 5 (CMIP5). We find that the CMIP5 climate models, as a group, simulate important properties of historical meteorological droughts in the Amazon. In addition, this group of models reproduces observed relationships between Amazon precipitation and regional sea surface temperature anomalies in the tropical Pacific and the North Atlantic oceans. Assuming the Representative Concentration Pathway 8.5 scenario for future drivers of climate change, the models project increases in the frequency and geographic extent of meteorological drought in the eastern Amazon, and the opposite in the West. For the region as a whole, the CMIP5 models suggest that the area affected by mild and severe meteorological drought will nearly double and triple, respectively, by 2100. Extremes of wetness are also projected to increase after 2040. Specifically, the frequency of periods of unusual wetness and the area affected by unusual wetness are projected to increase after 2040 in the Amazon as a whole, including in locations where annual mean precipitation is projected to decrease. Our analyses suggest that continued emissions of greenhouse gases will increase the likelihood of extreme events that have been shown to alter and degrade Amazonian forests.
The responses of tropical forests to severe droughts exert strong influences on the global carbon cycle (1, 2). During periods of extended soil water stress, changes in forest physiology and structure reduce the capacity of forests to cycle and store carbon (3–5). In the 2000s, for example, more than half of the Amazon experienced droughts that were severe enough to cause increased tree mortality and reduced tree growth (6). In response to these droughts, 1–2% of the carbon stocks of Amazonian forests were committed to the atmosphere (6, 7), while large amounts were combusted due to widespread fires. Although similar droughts have occurred for millennia (8), and forests have apparently recovered from such events (9), climate change could intensify hydrological extremes over the basin (10). Together with warmer climatic conditions, an increase in the frequency and severity of droughts could push the Amazon region into a new climate envelope (11), potentially releasing to the atmosphere a large part of the 120 Pg of carbon stored in these forests (12). These effects on the carbon stocks of the Amazon could be even more pronounced if forest fires become more common in the region.
There is disagreement about the potential responses of Amazon forests to climate change (13). Earlier versions of climate−vegetation models projected that as climate changed, many forests growing in southeast Amazonia would be replaced by savanna-like ecosystems within the next 50–100 y (14). This shift in vegetation dominance would result mostly from warm and dry climatic conditions (15). However, other projections are less grim. Instead of widespread changes in vegetation states, some models project that increases in air temperature are likely to cause losses in forest carbon stocks but also that increased atmospheric CO2 concentration would promote forest growth and associated carbon accumulation (16). The net result of these two opposing forces appears in some studies to be approximately neutral, although positive vegetation responses to high CO2 concentration remain poorly understood (17).
Interestingly, assessments of the potential future trajectories of Amazonian forests using dynamic global vegetation models (DGVMs) driven by global climate models (e.g., ref. 16) show smaller effects than are seen in field observations and experiments. Field-based studies suggest that severe hydrological droughts tend to reduce both forest growth rates (via reduced photosynthesis) and carbon stocks (via increased tree mortality) (18). At least two factors account for the relatively small effects of hydrological droughts seen in simulations. First, most ecosystem models lack a mechanism to represent short-term carbon losses resulting from severe drought events (4). Powell et al. (19), for instance, showed that commonly used DGVMs were unable to represent the spike in drought-induced tree mortality observed in two large-scale throughfall exclusion experiments conducted in east Amazonia. Based on these results, the authors argued that DGVMs must strive to improve vegetation responses (e.g., mortality) to extreme, relatively short-term weather events.
The second explanation relates to the ability of climate models to represent basic drought conditions. Climate model results drive ecosystem models and provide insights into processes that exert strong influences on the structural dynamics of tropical forests (e.g., drought-induced tree mortality and forest fires). Although several studies have demonstrated a strong association between historical droughts and anomalies in sea surface temperature (SST) [the El Niño−Southern Oscillation (ENSO) and the Atlantic Multidecadal Oscillation (AMO) (20–22)], it has been unclear whether this association holds in projections of future climate, if climate models can reasonably represent basic drought properties, or whether models project increases in drought frequency and intensity. For example, previous studies (e.g., refs. 10 and 23) have reported that climate change is likely to cause increases in average air temperature and could alter average precipitation patterns over the Amazon basin, but they have not quantified how the rate of short-term extreme dry or wet periods will shift as the climate changes.
Here we confront these issues by asking how well the latest generation of climate models (24) simulate observed relationships between SST anomalies and Amazon drought, and what these models suggest about the future of meteorological drought in the region.
Results
Model Evaluation.
The Coupled Model Intercomparison Project Phase 5 (CMIP5) models have been extensively evaluated elsewhere (e.g., ref. 25); we focus on aspects relevant to meteorological drought in the Amazon. Assessing how well the models reproduce observed relationships between SST anomalies in specific regions and Amazon drought addresses physical mechanisms that produce drought, and increases confidence in their representation of Amazon drought mechanisms. This bears more directly on the credibility of future drought projections than does the ability to reproduce historical drought properties, which might be simulated accurately without capturing the underlying physical processes. We also assess the ability of CMIP5 models to capture the pronounced seasonal cycle of precipitation in the Amazon (Supporting Information). Yin et al. (26) also evaluate the performance of these models in simulating Amazon precipitation, focusing more on the performance of individual models and of atmospheric and land surface processes.
We describe how well the CMIP5 models reproduce observed relationships between area-averaged SST anomalies in specific ocean regions and precipitation anomalies throughout the Amazon. This analysis included 29 CMIP5 models for which both SST and precipitation data were available. Relationships involving SSTs in regions used to measure ENSO (e.g., Nino 3.4) are relatively well established (27, 28). Yoon and Zeng (29) pointed out a similar relationship involving SSTs in a region in the North Atlantic. In both regions, region-wide SST anomalies show negative correlations with Amazon precipitation anomalies. The CMIP5 models, as a group, have skill at reproducing these relationships (Fig. 1), although the skill level varies greatly among individual models. Because the phasing of internal variability is random in climate projections, the multimodel mean results shown in Fig. 1 are simply the multimodel mean correlation coefficient, rather than the correlation coefficient based on multimodel mean results. In case the correlation coefficients depend on the length of the data record, for each observational dataset, we calculated simulated correlation coefficients for a period the same length as the observed dataset.
Fig. 1.
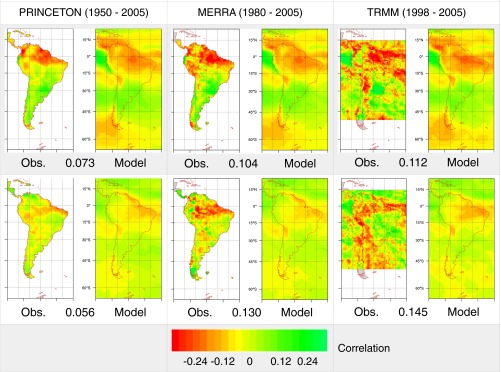
Correlation coefficients between monthly SST anomalies in the Niño 3.4 region (Top) or the region in the North Atlantic identified by Yoon and Zeng (29) (Bottom) and local precipitation anomalies. In each panel, the left-hand map shows the observed correlation, based on HadISST monthly SSTs and one of three observed precipitation datasets, indicated above Top; the right-hand map shows the multimodel mean correlation based on CMIP5 results for the same period. The number at the bottom of each panel is the RMS difference between the simulated field of coefficients and that based on observations, calculated over the Amazon basin. The outline of the basin is visible in Fig. 2.
To assess how well individual models perform relative to an estimate of observational uncertainty, we compared RMS differences in spatial patterns of correlation coefficients between individual models and observations to RMS differences among observational datasets, which capture structural uncertainties in the observations. This analysis was performed for the period of overlap of all three observational datasets (1998 through 2005), and, of the 29 models analyzed, 5 and 17 have RMS differences that are less than the smallest of the interobservational differences for the North Atlantic and El Niño region SSTs, respectively. Thus, by this measure of model performance, a significant number of individual models are performing at a level comparable to apparent observational uncertainties. Also, as we find elsewhere (and as is common in climate model evaluations generally), the model mean result compares more closely to observations than the result of any individual model.
Projected Average Precipitation.
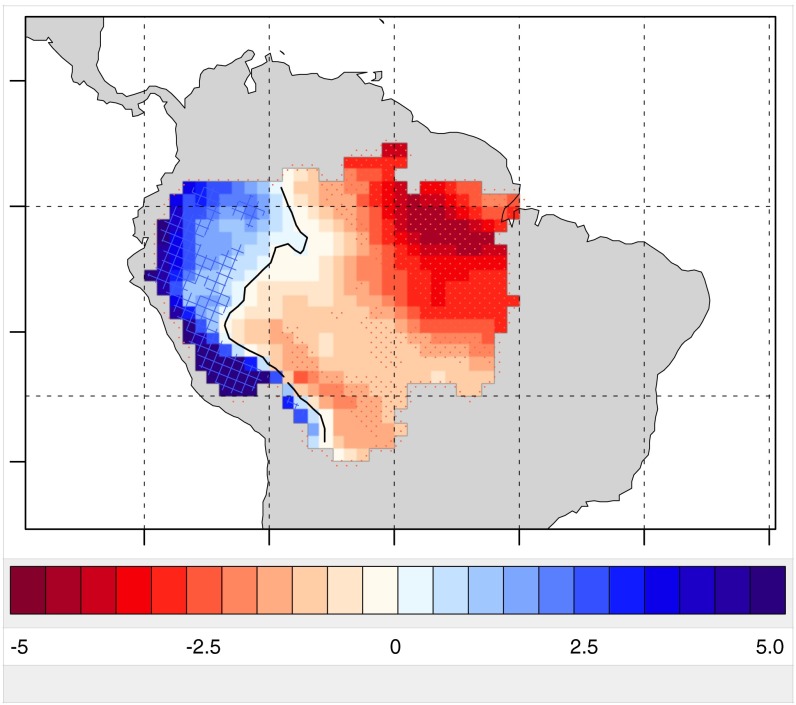
Our results for projected future drought and periods of unusual wetness are best understood in the context of projected changes in mean precipitation, by region and by season. Although mean annual precipitation (MAP) averaged over the Amazon basin is projected to remain largely unchanged, this results from a cancellation of significant regional and seasonal trends (Figs. 2 and 3). Geographically, MAP is projected to increase in the western Amazon and to decrease in the eastern part of the region (Fig. 2). Seasonally, projections indicate that the wettest months (December−April) may become slightly wetter, the driest months (July−September) get drier, and autumnal transition months (September−November) experience strong, drying trends (Fig. 3).
Fig. 2.
Linear trends in simulated multimodel mean annual mean precipitation in the Amazon, 1950–2099. The black line denotes zero trend; we perform some analyses separately for locations with negative and positive trends. Hatching (dots) indicate regions where >2/3 of models have a positive (negative) trend. Units are millimeters per day per century.
Fig. 3.

Projected changes in the seasonal cycle of precipitation in the Amazon. Each curve shows monthly mean precipitation for one month of the year, as a multimodel mean of 35 CMIP5 models, and is smoothed by applying a 10-y running mean. Error bars measure of intermodel agreement (the SE across 35 CMIP models based on smoothed results), and are displayed every 20 y. Vertical axis units are millimeter per day. Note that the error bars are temporally offset from one another for clarity.
Projected regional and seasonal changes may be explained by differential warming of regional SSTs. Yoon and Zeng (29) showed that SSTs in both the eastern tropical Pacific and a specific region of the North Atlantic anticorrellate with precipitation in the Amazon as a whole. More localized analysis shows that the Pacific SSTs correlate most strongly with precipitation in the eastern Amazon, and the North Atlantic SSTs correlate with precipitation more in the western Amazon. We find that SSTs in the Pacific region are projected to warm relatively rapidly, whereas those in the North Atlantic region identified by ref. 29 warm relatively slowly (Supporting Information). Based on observed the relationships just described, this would suggest that projected precipitation should increase in the western Amazon and decrease in the east, as is, in fact, the case. In addition, Yoon and Zeng (29) show that the Pacific region SSTs correlate with rainy season precipitation; hence, relatively rapid warming in this region could contribute to a wetter rainy season.
Projected Drought and Wet Periods.
We use the Standardized Precipitation Index (SPI) (30) to assess spatial−temporal changes in precipitation variability. Because the SPI is based solely on precipitation, it does not account for the tendency of warming temperatures to cause soil drying. We thus focus here on meteorological rather than agricultural or hydrological drought, and note that increasing temperatures may exacerbate the impacts of projected meteorological droughts. In this paper, we show results for yearlong droughts (as measured by 12-mo SPI); results for 3-mo SPI are shown in Supporting Information.
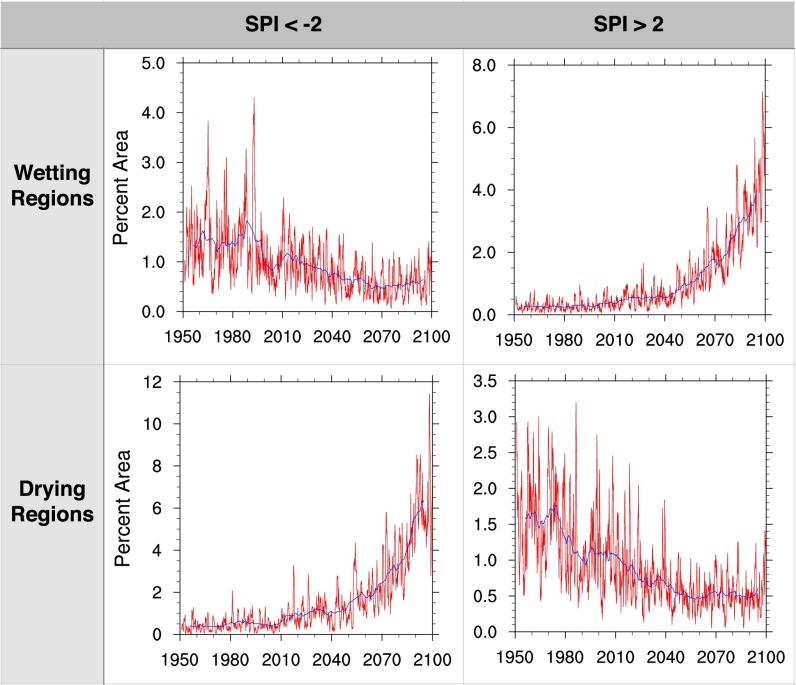
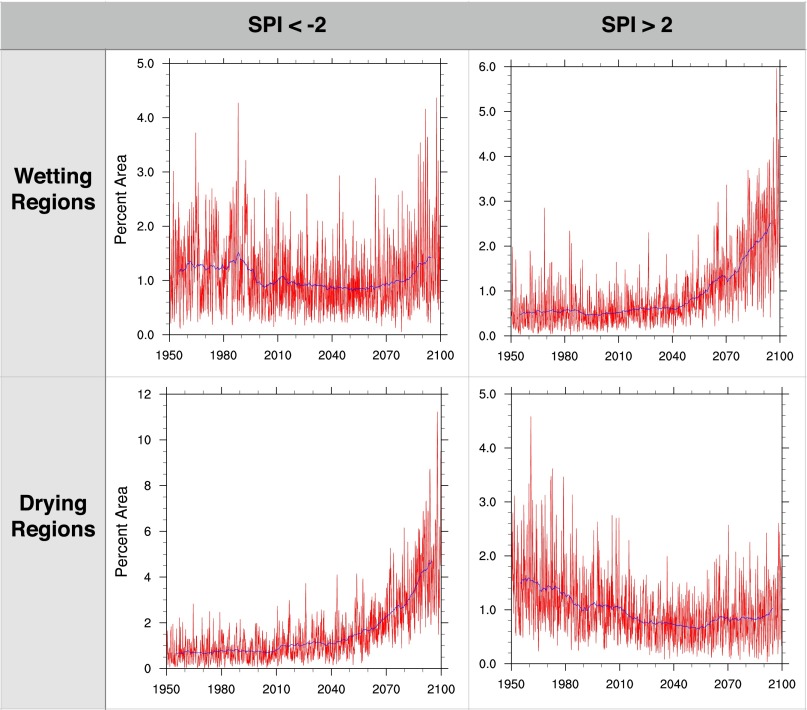
We start by assessing projected changes in the area affected by severe drought and wet periods in the Amazon basin. The CMIP5 models project about a 10-fold increase by 2100 in the drought area (here defined as SPI < −2; Fig. 4) in regions where mean precipitation is projected to decrease (“drying regions”)—most of the Amazon basin. The mechanism responsible for this appears to be a differential warming of SSTs in the eastern tropical Pacific (Supporting Information). SSTs in this region are projected to increase more rapidly than elsewhere, and, as noted above, warm anomalies in this region are associated with Amazon drought in both observations and in the CMIP5 model results. In the relatively small portion of the basin where annual mean precipitation is projected to increase, the area affected by severe drought is projected to decrease slightly (Fig. 4).
Fig. 4.
Multimodel mean projections of percent area in the Amazon affected by severe drought, defined here as SPI < −2 (Left) or unusual wetness, defined as SPI > 2 (Right). Shown are results for regions where annual mean precipitation is projected to increase (Top) and decrease (Bottom). Red curve, monthly results; blue curve, 10-y running mean.
The area affected by unusual wetness—defined here as percent area where SPI exceeds 2—is projected to increase by about an order of magnitude in regions where mean precipitation is projected to also increase (Fig. 4). This results from a combination of increasing mean precipitation and increasing temporal variability in precipitation, which we discuss in the following paragraph. In drying regions, the area of unusual wetness is projected to decrease (Fig. 4).
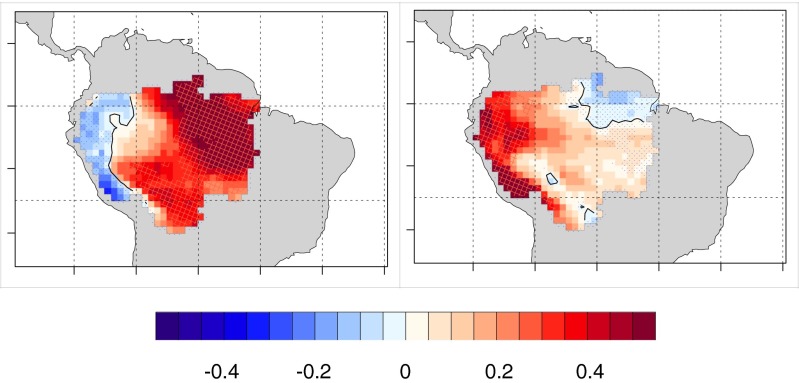
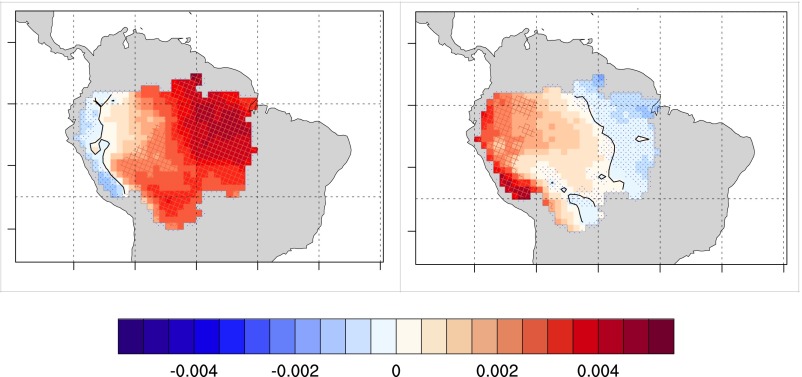
To assess projected changes in drought frequency, we look at the multimodel mean number of months per year experiencing SPI < −2. This is projected to increase across most of the region (Fig. 5), but not in the western Amazonian region, where MAP is predicted to increase (compare Fig. 5 vs. Fig. 2). Projections of increasing drought frequency are robust in most locations, as indicated by the large area where at least two-thirds of models project an increasing trend.
Fig. 5.
Linear trends in number of months per year experiencing drought or unusual wetness, 1950–2099. (Left) Months per year experiencing SPI < −2 and (Right) months per year experiencing SPI > 2. Shown are the mean of results from 35 CMIP5 models. The black line denotes zero trend; i.e., it separates regions of increasing and decreasing drought frequency. Hatching (dots) indicate regions where >2/3 of models have a positive (negative) trend. Units are months per year per century.
The CMIP5 models project trends in the frequency of unusually wet periods, as estimated by the number of months per year experiencing SPI > 2 (Fig. 5). In particular, comparison of Figs. 2 and 5 shows that more wet periods are projected in some locations where MAP is projected to decrease and/or the frequency of severe drought (SPI < −2) is projected to increase. There is even an area in the eastern part of the basin where the frequency of extreme wet periods and extreme drought are both robustly projected to increase (defined as at least two-thirds of the CMIP5 models agreeing on an increase).
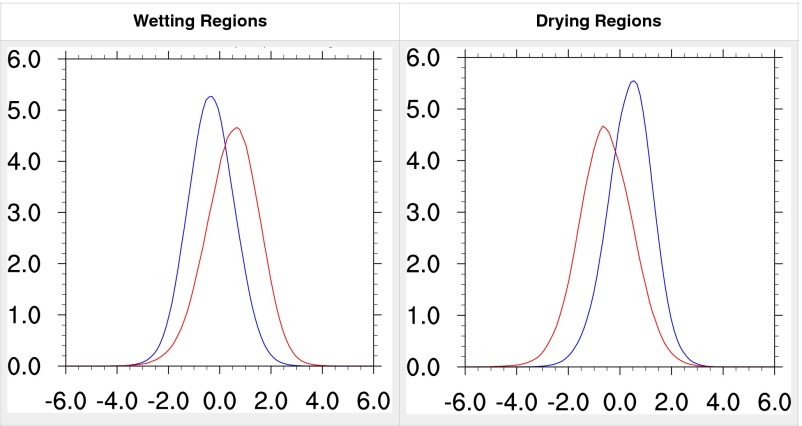
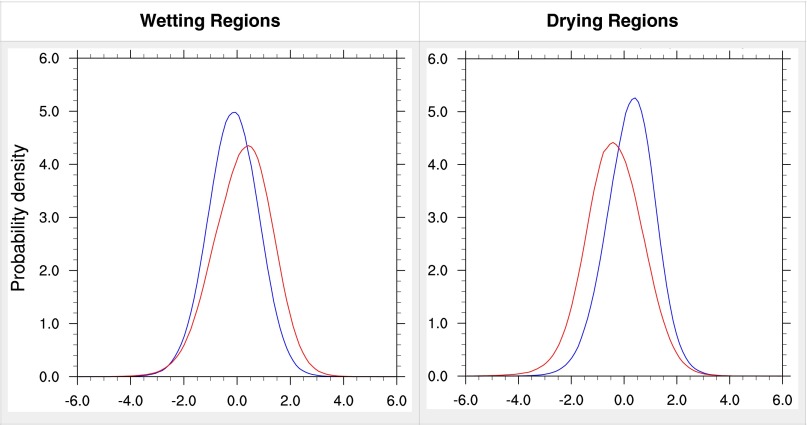
This raises the question of whether precipitation will become more variable in the Amazon basin. To address this issue, we calculated historical and future probability density functions for 12-mo SPI independently in locations where MAP is projected to increase and decrease (Fig. 6). In both types of regions, we find small increases in the projected interannual and seasonal variability of precipitation, as measured by the variance of 12-mo SPI. This is most easily seen in Fig. 6 by looking at the heights of the SPI distribution functions; because the area under all of the distributions is the same, a shorter distribution function is also wider.
Fig. 6.
Probability density functions of simulated 12-mo SPI values, in regions where annual mean precipitation is projected to increase (Left) and decrease (Right). These regions are shown in Fig. 2. In both “wetting” and “drying” regions, interannual variability in precipitation, as measured by the variance of 12-mo SPI, is projected to increase. Red curve, results for 2071–2100; blue curves, results for 1950–1979.
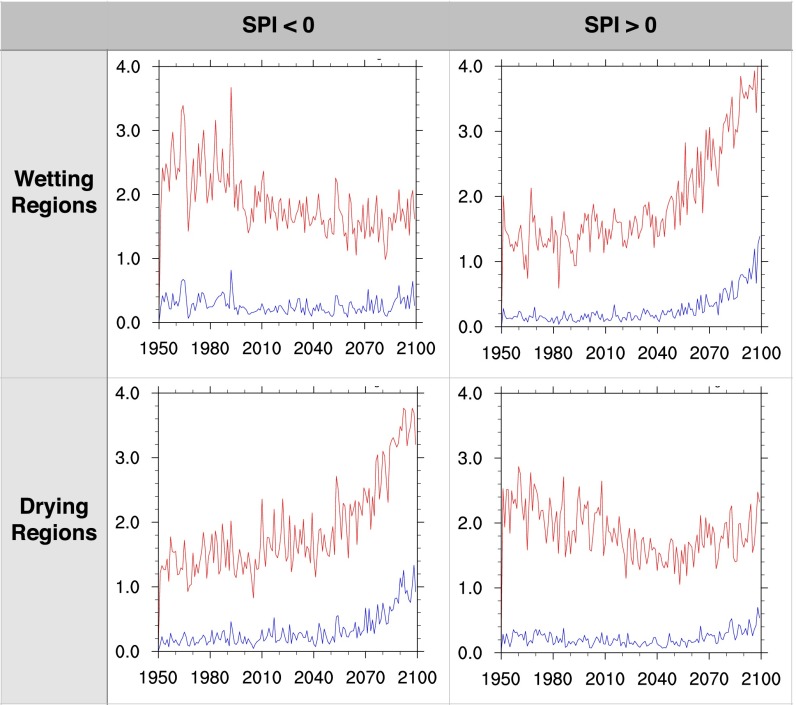
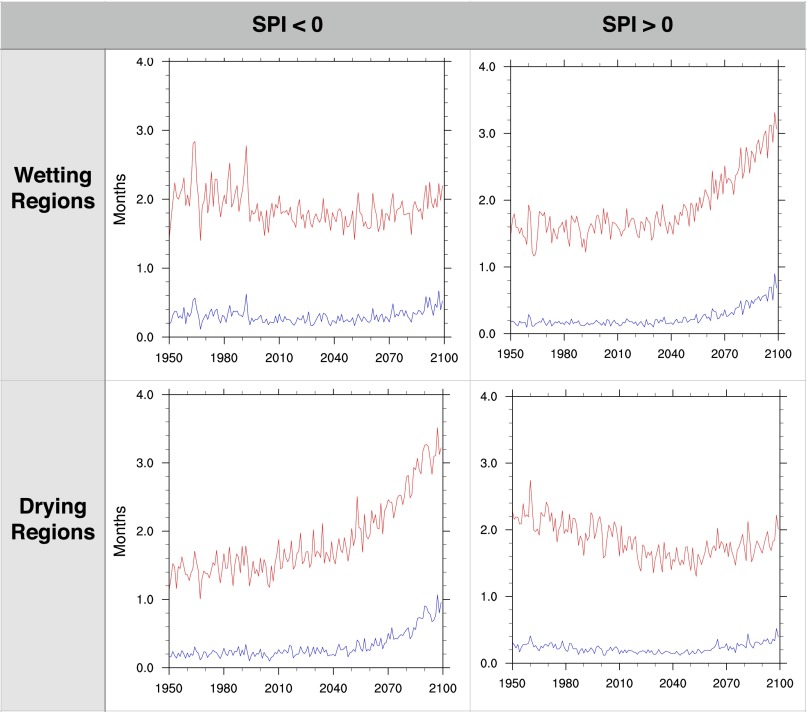
More frequent periods of unusual wetness contribute to projected increases in precipitation variability. Fig. 7 shows that periods of unusual wetness are projected to increase in frequency in regions where MAP is projected to increase (Fig. 7, Top Right) and, after 2040, in regions where MAP is projected to decrease (Fig. 7, Bottom Right). Fig. 7 also shows large increases in drought frequency in drying regions (Fig. 7, Bottom Left); in wetting regions, drought frequency decreases until about 2040, and shows no trend or a slow increasing trend (Fig. 7, Bottom Right). Fig. 7 shows projected increases after 2040 in the frequency of both drought and wet periods throughout the Amazon, with the likely exception of increases in drought frequency in wetting regions (Fig. 7, Top Left), where trends are weak.
Fig. 7.
Simulated frequency of drought or unusual wetness, as measured by months per year when the absolute value of SPI exceeds specified thresholds. Shown are results in locations projected to experience an increase (Top) or decrease (Bottom) in annual mean precipitation. (Left) Results for drought and (Right) results for periods of unusual wetness. Red curves show results for SPI < −1 (Left) or SPI > 1 (Right). Blue curves show results for SPI < −2 (Left) or SPI > 2 (Right).
Discussion
Previous studies have shown that mean and seasonality of precipitation in Amazonia could change with increasing greenhouse gases and changing patterns of aerosols (e.g., ref. 31). Here we extend and corroborate these findings, and show that climate change is also expected to affect the frequency of periods of both drought and wetness in different regions within the Amazon basin. In particular, western Amazonia (substantially less than half of the basin) is projected to experience increases in mean annual precipitation, more frequent wet periods (especially after 2040), and decreases in drought frequency, at least until 2040. In contrast, eastern Amazonia (most of the basin) is projected to experience less annual and dry-season precipitation, more frequent droughts, and, eventually, an increasing trend in periods of unusual wetness. These projections derive from CMIP5 models that, as a group, capture well-established positive relationships between Amazon droughts and SST, as well as some basic drought properties. In addition to an intensification of the hydrological cycle, the CMIP5 models project increased dry-season length due to reduced precipitation in autumnal transition months.
The recent droughts in 2005 and 2010 in some ways are analogs for projected future conditions. First, droughts of similar intensity (with SPI values less then −2) are projected to greatly increase in frequency; hence the impacts of these recent droughts may offer some insight into future drought impacts. Second, both the 2005 and 2010 droughts were accompanied by unusual wetness in the northeast part of the basin; the CMIP5 models project increased frequency of extreme wetness in the same region (21).
Our analyses reveal that CMIP5 models project contrasting behavior in precipitation between eastern and western Amazonian regions. Although the specific mechanisms driving such differences should be explored, they may result from differential warming in Atlantic vs. Pacific ocean SSTs (23). Below-average SSTs in the Pacific tend to trigger periods of extreme wetness in the western Amazon. We observed strong associations between Amazon drought and SST in CMIP5 model simulations. Assuming that this association will hold in the future, an increase in the amplitude of ENSO or AMO could explain the projected increases in drought and extreme wetness in the eastern and western Amazon basin, respectively.
By 2100, the CMIP5 simulations project roughly a tripling of the area experiencing meteorological droughts in Amazonia (for both 3-mo and 12-mo droughts), and there is reason to suspect that they may underestimate future drought intensity and extent. The projected changes in the CMIP5 simulations described here are driven by increases in atmospheric greenhouse gases and other human forcings. However, other important processes, which are highly uncertain and poorly represented in CMIP5 models, could also intensify Amazon droughts. For example, rainfall in the eastern Amazon has a strong dependency on regional evapotranspiration, so a reduction in tree cover due to deforestation could reduce precipitation (32). This suggests that if processes related to changes in land use and land cover (including feedbacks on climate) were better represented in more of the CMIP5 models, drought intensity could be even more frequent than projected here (33). Furthermore, our analysis does not consider effects of warming or CO2 on evapotranspiration and soil moisture.
Previous field-based studies and modeling exercises suggest that the projected increases in drought frequency and severity described above could exert strong influences on the ecology and productivity of Amazonian forests. For example, two rainfall exclusion experiments found that soil water stress caused reduced tree growth and triggered a fourfold increase in mortality of large trees (5), which store most of the aboveground carbon in tropical forests. Two recent Amazon droughts had similar effects on the ecology of tropical forests, when mortality increased to levels that were large enough to transform tropical forests from carbon sink to source (6). By altering forest microclimate and fuel dynamics, droughts also tend to increase forest flammability (1). In the 2000s, for example, more than 85,000 km2 of primary forests burned, mostly in the drought years of 2005, 2007, and 2010 (34, 35). It is important to note that our study focuses on precipitation; increases in temperature could worsen the severity and effects of droughts (36–38).
Historical droughts altered the ecology of Amazonian forests (39). However, it remains unclear whether the future changes in drought intensity and frequency that CMIP5 models project will have influences similar to past changes. We still lack quantitative analyses of the effects of historical droughts compared with future projections. Without such studies, it is difficult to define what constitutes a dangerous or catastrophic change in drought frequency and intensity for the stability of Amazonian forests. Likewise, it is important to consider the combined effects of reduced precipitation and increased temperatures, which together can reduce the capacity of tropical forests to cycle and store carbon. The eastern Amazon, in particular, may experience increases of air temperature between 4 °C and 5 °C, and this portion of the basin is already close to the lower rainfall limit for moist tropical forests (40), so minor changes could have important consequences. Further research on these types of thresholds is needed now to inform policy development processes.
Methods
We analyzed results from simulations performed with up to 35 climate models participating in CMIP5 (24). Each simulation spanned the years 1950 through 2099. For 1950 through 2005, estimates of historical climate forcings (atmospheric greenhouse gas concentrations, etc.) were used. After 2006, forcings corresponded to the Representative Concentration Pathway 8.5 scenario, which assumes a relatively rapid buildup of atmospheric greenhouse gases. We used one simulation from each model; whenever possible, this was the r1i1p1 simulation. All model results used are reported as monthly means, and are regridded to a 1° × 1° latitude by longitude grid before analysis (these are available from gdo-dcp.ucllnl.org/downscaled_cmip_projections/dcpInterface.html). Most analyses were restricted to the Amazon watershed; exceptions include evaluation of simulated correlations with SST. We find that the CMIP5 models have demonstrable skill in representing observed relationships between SST anomalies in specific regions in the North Atlantic and tropical Pacific oceans, as well as in simulating basic properties of observed Amazon drought (Supporting Information).
SI Model Evaluation
Our evaluation of the CMIP5 climate models is limited to its ability to simulate meteorological drought in the Amazon; more comprehensive evaluations of CMIP5 models have been performed and reported on elsewhere. For example, a thorough review is provided by ref. 41. Beyond this, Orlowsky and Seneviratne (42) looked at drought on a global domain.
We discussed in the Results the ability of the CMIP5 models to reproduce observed relationships between SST anomalies in specific regions and precipitation anomalies in the Amazon; here we discuss how we weight the different models, and examine their ability to reproduce observed properties of meteorological Amazon droughts. We start by intercomparing the different observational datasets used in this study.
We compared CMIP5 results to three different observation-based datasets of precipitation in the Amazon (Table S1). Because we are interested in understanding intraregional variations, we selected datasets having relatively fine spatial resolution. The first of these is the precipitation field used to produce the Modern Era Retrospective Analysis (MERRA) Land reanalysis product (gmao.gsfc.nasa.gov/research/merra/merra-land.php); it is based on correcting the precipitation from the MERRA reanalysis using satellite and station data, as described by ref. 43. The second is monthly precipitation from the Princeton global meteorological forcing dataset (44). The third is the Tropical Rainfall Measurement Mission (TRMM) 3B43 data product, which is based upon satellite retrievals and in situ data. Evaluation of the TRMM 3B43 results in the mountainous regions of Peru is discussed by ref. 45.
Table S1.
Observational data products used for evaluation of CMIP5 models
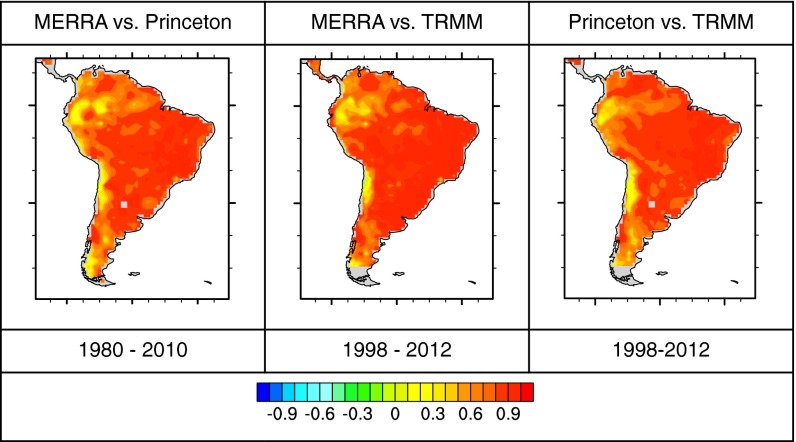
Significant disagreements among these three datasets exist in parts of the study area. Because we use these datasets in part to evaluate simulated correlations between SST anomalies and precipitation anomalies, we compared the three datasets by looking at correlations among them (Fig. S2). These show poor agreement in parts of South America, including parts of the Amazon. None of the three datasets can be identified as an outlier relative to the others. These regions of poor agreement should be kept in mind when using the observation-based datasets to evaluate models. Below we show additional evidence for disagreements among observation-based datasets, in the form of evaluations in which the CMIP5 models, as a group, appear to have different biases (even biases of different signs) compared with different observation-based datasets.
Fig. S1.
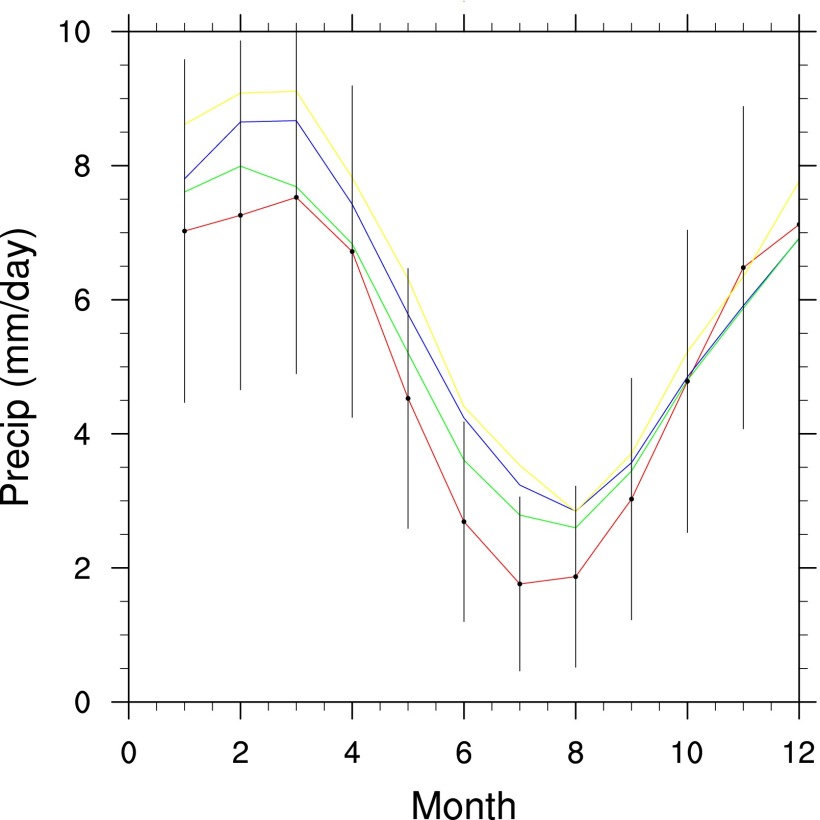
Seasonal cycle of precipitation in the Amazon, in three different observational datasets, and as simulated by CMIP5 climate models. Red curve, mean and SD of 35 CMIP5 models; blue curve, Princeton observational dataset; green curve, MERRA; yellow curve, TRMM.
Fig. S2.
Correlation coefficients among monthly precipitation values in different observation-based precipitation datasets used here. Comparisons were made over the full period of overlap (dates below each map) between each pair of datasets.
Referring to correlation coefficients between area mean SSTs and gridded precipitation (shown in Fig. 1), we calculated a skill score for each model based on the RMS differences between its patterns of simulated correlation coefficients and the patterns based upon observations. For each model, six RMS errors were found, one corresponding to each panel in Fig. 1. We then found a single skill score for each model based on a weighted mean of these six RMS errors, with the weight proportional to the number of years each was based on. To produce a skill score that ranges from a minimum possible value of zero to a maximum of 1, the skill score was defined as
where <RMSE> is the weighted average of RMS errors found as described above. The skills scores calculated in this way for 29 CMIP5 models range from 0.915 to 0.948; i.e., intermodel differences in skill are small compared with the maximum possible range. The skill score calculated as just described based on multimodel mean correlation coefficients is 0.956, slightly higher than that of any individual model. This indicates some tendency for errors to cancel when many models are averaged together, and is consistent with previous findings that model mean results or median model results agree better with observations than any single model does; this is especially true when “agreement” is based on a broad set of metrics (46). Tebaldi and Knutti (46) also point out that superior skill in multimodel mean results is found in fields beyond climate and weather.
We turn now to evaluating properties of simulated droughts in the historical period. We used two metrics of drought properties, both based upon the SPI. To evaluate the spatial coherence of drought within the Amazon, we calculated the SD in time of the area within the Amazon having 12-mo SPI < −1 (mild drought) and 12-mo SPI < −2 (severe drought). This measure is arrived at as follows: In the limiting case that droughts were much smaller than the region and uncorrelated from location to location, then the fraction of the region having SPI < −1 and SPI < −2 would be constant in time (at 16% and 2.3%, respectively, which follows from the definition of SPI). At the other extreme, if every drought affected the entire region, then the fractional area affected would be as high as 100% at times, while still averaging 16% and 2.3%, respectively. Hence the SD in time of the fractional area affected by drought measures the spatial coherence of drought within the region.
We calculated this measure based on monthly time series of 12-mo and 3-mo SPI (each month’s value of SPI based on the previous 12 mo or 3 mo) for each of the observational datasets. To evaluate the models, we calculated the same measure for each model over the interval of years corresponding to each observational dataset. We display the results for 12-mo SPI in Fig. S3.
Fig. S3.
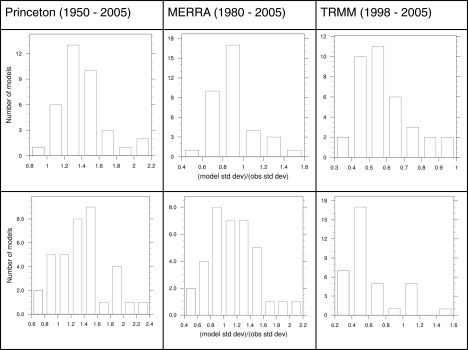
Evaluation of the spatial coherence of drought within the Amazon, in CMIP5 simulations, based on a measure of drought coherence described in SI Model Evaluation. The ratio of this measure in each model to its value in each observational data was found, and the histograms illustrate the how many models have various values of this ratio. (Top) The case where drought is defined as 12-mo SPI < −1 and (Bottom) 12-mo SPI < −2. Different columns show comparison of models to different observation-based datasets.
The impression gained from this evaluation exercise (Fig. S3) depends on which observations the models are compared with. In particular, the models, as a group, seem to be biased high (implying overly coherent droughts) compared with the Princeton dataset, and biased low compared with TRMM. Compared with MERRA, individual models have significant biases but the set of biases is much more closely centered around zero. This is true for both mild and severe droughts (SPI < −1 and SPI < −2). Hence it appears that differences among observational datasets limit our ability to assess this aspect of model performance.
We use a simple measure of drought duration, the temporal autocorrelation of SPI at lag 6 mo, based on monthly time series of 12-mo SPI. As with spatial coherence, we calculated this measure for each of the observational datasets, and for each of the models over the same interval of years as each observational dataset. For each observational dataset, we compared the observation-based value to the set of model values (Fig. S4). In contrast to Fig. S3, we saw no tendency for the models to have systematically different biases against different observational datasets. We also saw no clear bias in the CMIP5 models as a group. It is also noteworthy that in every panel in both Fig. S3 and Fig. S4, the range of model values relative to observed (i.e., the limits on the horizontal axis) is greater for SPI of −2 than for SPI of −1. This probably occurs because more severe droughts are more rare, which results in less robust comparisons between models and observations.
Fig. S4.
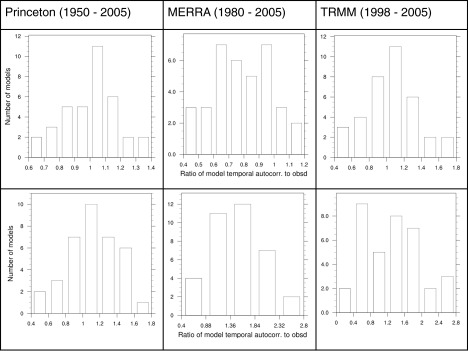
Evaluation of the duration of Amazon drought, in CMIP5 simulations, based on the autocorrelation of SPI at lag 6 mo. The ratio of this measure in each model to its value in each observational data was found, and the histograms illustrate how many models have various values of this ratio. (Top) The 12-mo SPI < −1 and (Bottom) 12-mo SPI < −2. Different columns show comparison of models to different observation-based datasets.
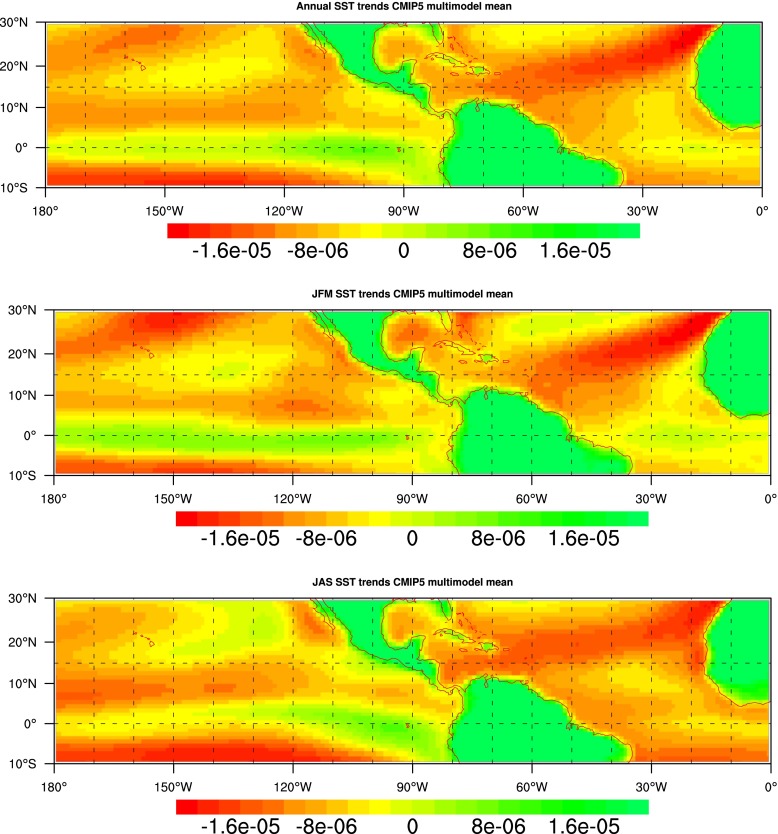
As discussed in the Discussion, projected trends in regional SST (Fig. S5) may be the proximate drivers of projected changes in hydrological variability.
Fig. S5.
Relative trends in simulated SSTs or land skin temperatures, 1950–2099. At each location, a linear trend in temperature was calculated from model mean monthly results. This revealed increasing trends throughout the region shown. The regional mean trend was subtracted to highlight regional differences in trends.
SI Results for 3-mo SPI
Figs. S6−S9 show results obtained for shorter droughts (3-mo SPI) but otherwise identical to results shown in Figs. 4−7, respectively. The reader is referred there for details of the analysis. Results for 3-mo SPI are generally similar to those for 12-mo SPI.
Fig. S6.
Same as Fig. 4 except showing results for 3-mo SPI. Multimodel mean projections of percent area in the Amazon affected by severe drought, defined here as SPI < −2 (Left) or unusual wetness, defined as SPI > 2 (Right). Red curve, monthly results; blue curve, 10-y running mean.
Fig. S7.
Same as Fig. 5 except showing results for 3-mo SPI. Linear trends in number of months per year experiencing drought or unusual wetness,1950–2099. (Left) Months per year experiencing SPI < −2; (Right) months per year experiencing SPI > 2. Results are the mean of results from 35 CMIP5 models. The black line denotes zero trend; i.e., it separates regions of increasing and decreasing drought frequency. Hatching (dots) indicate regions where >2/3 of models have a positive (negative) trend. Units are months per year per year.
Fig. S8.
Same as Fig. 6 except showing results for 3-mo SPI. Probability density functions of simulated 3-mo SPI values, in regions where annual mean precipitation is projected to increase (Left) and decrease (Right). These regions are shown in Fig. 2. In both wetting and drying and regions, interannual variability in precipitation, as measured by the variance of 3-mo SPI, is projected to increase. Red curves show results for 2071–2100, and blue curves show results for 1950–1979.
Fig. S9.
Same as Fig. 7 except showing results for 3-mo SPI. Simulated frequency of drought or unusual wetness, as measured by months per year when the absolute value of SPI exceeds specified thresholds. Shown are results in locations projected to experience an increase (Top) or decrease (Bottom) in annual mean precipitation. (Left) Results for drought and (Right) results for periods of unusual wetness. Red curves show results for SPI < −1 (Left) or SPI > 1 (Right). Blue curves show results for SPI < −2 (Left) or SPI > 2 (Right).
Acknowledgments
This study was supported by National Science Foundation Grant 1146206 and the endowment of the Carnegie Institution for Science.
Footnotes
The authors declare no conflict of interest.
This article is a PNAS Direct Submission.
This article contains supporting information online at www.pnas.org/lookup/suppl/doi:10.1073/pnas.1421010112/-/DCSupplemental.
References
- 1.Nepstad D, Lefebvre P, da Silva UL. Amazon drought and its implications for forest flammability and tree growth: A basin‐wide analysis. Global Change Biol. 2004;10(5):704–717. [Google Scholar]
- 2.Gatti LV, et al. Drought sensitivity of Amazonian carbon balance revealed by atmospheric measurements. Nature. 2014;506(7486):76–80. doi: 10.1038/nature12957. [DOI] [PubMed] [Google Scholar]
- 3.Nepstad DC, Tohver IM, Ray D, Moutinho P, Cardinot G. Mortality of large trees and lianas following experimental drought in an Amazon forest. Ecology. 2007;88(9):2259–2269. doi: 10.1890/06-1046.1. [DOI] [PubMed] [Google Scholar]
- 4.Brando PM, et al. Drought effects on litterfall, wood production and belowground carbon cycling in an Amazon forest: Results of a throughfall reduction experiment. Philos Trans R Soc Lond B Biol Sci. 2008;363(1498):1839–1848. doi: 10.1098/rstb.2007.0031. [DOI] [PMC free article] [PubMed] [Google Scholar]
- 5.da Costa ACL, et al. Effect of 7 yr of experimental drought on vegetation dynamics and biomass storage of an eastern Amazonian rainforest. New Phytol. 2010;187(3):579–591. doi: 10.1111/j.1469-8137.2010.03309.x. [DOI] [PubMed] [Google Scholar]
- 6.Lewis SL, Brando PM, Phillips OL, van der Heijden GMF, Nepstad D. The 2010 Amazon drought. Science. 2011;331(6017):554. doi: 10.1126/science.1200807. [DOI] [PubMed] [Google Scholar]
- 7.Phillips OL, et al. Drought sensitivity of the Amazon rainforest. Science. 2009;323(5919):1344–1347. doi: 10.1126/science.1164033. [DOI] [PubMed] [Google Scholar]
- 8.Meggers BJ. Archeological evidence for the impact of mega-Niño events on Amazonia during the past two millennia. Clim Change. 1994;28(4):321–338. [Google Scholar]
- 9.Bush MB, Silman MR, McMichael C, Saatchi S. Fire, climate change and biodiversity in Amazonia: A Late-Holocene perspective. Philos Trans R Soc Lond B Biol Sci. 2008;363(1498):1795–1802. doi: 10.1098/rstb.2007.0014. [DOI] [PMC free article] [PubMed] [Google Scholar]
- 10.Malhi Y, et al. Climate change, deforestation, and the fate of the Amazon. Science. 2008;319(5860):169–172. doi: 10.1126/science.1146961. [DOI] [PubMed] [Google Scholar]
- 11.Nobre CA, Borma LDS. “Tipping points” for the Amazon forest. Curr Opin Environ Sustain. 2009;1(1):28–36. [Google Scholar]
- 12.Cox PM, et al. Amazonian forest dieback under climate-carbon cycle projections for the 21st century. Theor Appl Climatol. 2004;78(1):137–156. [Google Scholar]
- 13.Mayle FE, Power MJ. Impact of a drier Early-Mid-Holocene climate upon Amazonian forests. Philos Trans R Soc Lond B Biol Sci. 2008;363(1498):1829–1838. doi: 10.1098/rstb.2007.0019. [DOI] [PMC free article] [PubMed] [Google Scholar]
- 14.Cox PM, Betts RA, Jones CD, Spall SA, Totterdell IJ. Acceleration of global warming due to carbon-cycle feedbacks in a coupled climate model. Nature. 2000;408(6809):184–187. doi: 10.1038/35041539. [DOI] [PubMed] [Google Scholar]
- 15.Nobre CA, Sellers PJ, Shukla J. Amazonian deforestation and regional climate change. J Clim. 1991;4(10):957–988. [Google Scholar]
- 16.Huntingford C, et al. Simulated resilience of tropical rainforests to CO. Nat Geosci. 2013;6(4):1–6. [Google Scholar]
- 17.Rammig A, et al. Estimating the risk of Amazonian forest dieback. New Phytol. 2010;187(3):694–706. doi: 10.1111/j.1469-8137.2010.03318.x. [DOI] [PubMed] [Google Scholar]
- 18.Meir P, Mencuccini M, Dewar RC. Drought-related tree mortality: Addressing the gaps in understanding and prediction. New Phytol. 2015;207(1):28–33. doi: 10.1111/nph.13382. [DOI] [PubMed] [Google Scholar]
- 19.Powell TL, et al. Confronting model predictions of carbon fluxes with measurements of Amazon forests subjected to experimental drought. New Phytol. 2013;200(2):350–365. doi: 10.1111/nph.12390. [DOI] [PubMed] [Google Scholar]
- 20.Zeng N, et al. Causes and impacts of the 2005 Amazon drought. Environ Res Lett. 2008;3(1):014002. [Google Scholar]
- 21.Marengo JA, Tomasella J, Soares WR, Alves LM, Nobre CA. Extreme climatic events in the Amazon basin. Theor Appl Climatol. 2011;107(1-2):73–85. [Google Scholar]
- 22.Torres RR, Marengo JA. Climate change hotspots over South America: From CMIP3 to CMIP5 multi-model datasets. Theor Appl Climatol. 2014;117(3):579–587. [Google Scholar]
- 23.Cook B, Zeng N, Yoon JH. Will Amazonia dry out? Magnitude and causes of change from IPCC climate model projections. Earth Interact. 2012;16(3):1–27. [Google Scholar]
- 24.Taylor KE, Stouffer RJ, Meehl GA. An overview of CMIP5 and the experiment design. Bull Am Meteorol Soc. 2012;93(4):485–498. [Google Scholar]
- 25.Sillmann J, Kharin VV, Zhang X, Zwiers FW, Bronaugh D. Climate extremes indices in the CMIP5 multimodel ensemble: Part 1. Model evaluation in the present climate. J Geophys Res. 2013;118(4):1716–1733. [Google Scholar]
- 26.Yin L, Fu R, Shevilakova E, Dickinson RE. How well can CMIP5 simulate precipitation and its controlling processes over tropical South America? Clim Dyn. 2013;41(11):3127–3143. [Google Scholar]
- 27.Kousky VE, Kagano MT, Cavalcanti IFA. A review of the Southern Oscillation - oceanic-atmospheric circulation changes and related rainfall anomalis. Tellus Ser A. 1984;36(5):490–504. [Google Scholar]
- 28.Ropelewski CF, Halpert MS. Global and regional scale precipitation patterns associated with the El-Niño/Southern Oscillation. Mon Weather Rev. 1987;115(8):1606–1626. [Google Scholar]
- 29.Yoon J-H, Zeng N. An Atlantic influence on Amazon rainfall. Clim Dyn. 2010;34(2-3):249–264. [Google Scholar]
- 30.Guttman NB. Comparing the palmer drought index and the standardized precipitation index1. J Am Water Resour Assoc. 1998;34(1):113–121. [Google Scholar]
- 31.Boisier JP, Ciais P, Ducharne A, Guimberteau M. Projected strengthening of Amazonian dry season by constrained climate model simulations. Nat Clim Chang. 2015;5(7):656–660. [Google Scholar]
- 32.Bagley JE, Miller J, Bernacchi CJ. Biophysical impacts of climate-smart agriculture in the Midwest United States. Plant Cell Environ. 2015;38(9):1913–1930. doi: 10.1111/pce.12485. [DOI] [PubMed] [Google Scholar]
- 33.Brovkin V, et al. Effect of anthropogenic land-use and land-cover changes on climate and land carbon storage in CMIP5 projections for the twenty-first century. J Clim. 2013;26(18):6859–6881. [Google Scholar]
- 34.Morton DC, Le Page Y, DeFries R, Collatz GJ, Hurtt GC. Understorey fire frequency and the fate of burned forests in southern Amazonia. Philos Trans R Soc Lond B Biol Sci. 2013;368(1619):20120163–20120163. doi: 10.1098/rstb.2012.0163. [DOI] [PMC free article] [PubMed] [Google Scholar]
- 35.Alencar AAC, Brando PM, Asner GP, Putz FE. Landscape fragmentation, severe drought and the new Amazon forest fire regime. Ecol Appl. 2015;25(6):1493–1505. doi: 10.1890/14-1528.1. [DOI] [PubMed] [Google Scholar]
- 36.Allen CD, Macalady AK, Chenchouni H. A global overview of drought and heat-induced tree mortality reveals emerging climate change risks for forests. For Ecol Manage. 2010;259(4):660–684. [Google Scholar]
- 37.McDowell NG, Allen CD. Darcy’s law predicts widespread forest mortality under climate warming. Nat Clim Chang. 2015;5(7):669–672. [Google Scholar]
- 38.Allen CD, Breshears DD, McDowell NG. On underestimation of global vulnerability to tree mortality and forest die-off from hotter drought in the Anthropocene. Ecosphere. 2015;6(8):art129. [Google Scholar]
- 39.Phillips OL, et al. Drought-mortality relationships for tropical forests. New Phytol. 2010;187(3):631–646. doi: 10.1111/j.1469-8137.2010.03359.x. [DOI] [PubMed] [Google Scholar]
- 40.Zelazowski P, Malhi Y, Huntingford C, Sitch S, Fisher JB. Changes in the potential distribution of humid tropical forests on a warmer planet. Philos Trans A Math Phys Eng Sci. 2010;369(1934):137–160. doi: 10.1098/rsta.2010.0238. [DOI] [PubMed] [Google Scholar]
- 41.Flato G, Marotzke J. 2013. Evaluation of climate models. Climate Change 2013: The Physical Science Basis. Contribution of Working Group I to the 5th Assessment Report of the Intergovernmental Panel on Climate Change, eds Stocker TF, et al. (Cambridge Univ Press, Cambridge, UK), pp 741−846.
- 42.Orlowsky B, Seneviratne SI. 2013. Elusive drought: uncertainty in observed trends and short- and long-term CMIP5 projections. Hydrol Earth Syst Sci 17(5), 1765–1781.
- 43.Reichle RH. 2012. The MERRA-Land Data Product (NASA Goddard Space Flight Cent, Greenbelt, MD) GMAO Off Note 3, Version 1.2.
- 44.Sheffield J, Goteti G, Wood EF. Development of a 50-yr high-resolution global dataset of meteorological forcings for land surface modeling. J Clim. 2006;19(13):3088–3111. [Google Scholar]
- 45.Condom T, Rau P, Espinoza JC. Correction of TRMM 3B43 monthly precipitation data over the mountainous areas of Peru during the period 1998–2007. Hydrol Processes. 2010;25(12):1924–1933. [Google Scholar]
- 46.Tebaldi C, Knutti R. The use of the multi-model ensemble in probabilistic climate projections. Philos Trans A Math Phys Eng Sci. 2007;365(1857):2053–2075. doi: 10.1098/rsta.2007.2076. [DOI] [PubMed] [Google Scholar]
- 47.Reichle RH, et al. Assessment and enhancement of MERRA land surface hydrology estimates. J Climate. 2011;24:6322–6338. [Google Scholar]
- 48.Huffman GJ, et al. The TRMM multi-satellite precipitation analysis: QuasiGlobal, multi-year, combined-sensor precipitation estimates at fine scale. J Hydrometeor. 2007;8(1):38–55. [Google Scholar]
- 49.Huffman GJ, Adler RF, Bolvin DT, Nelkin EJ. The TRMM multi-satellite precipitation analysis (TMPA) In: Hossain F, Gebremichael M, editors. Satellite Rainfall Applications for Surface Hydrology. Springer; Heidelberg: 2010. pp. 3–22. [Google Scholar]


