Significance
In situ free ocean CO2 enrichment (FOCE) experiments and geochemical analyses (δ11B, Sr/Ca) conducted on corals (Porites cylindrica) from the highly dynamic Heron Island reef flat of the Great Barrier Reef show that this species exerts strong physiological controls on the pH of their calcifying fluid (pHcf). Over an ∼6-mo period, from mid-winter to early summer, we show that these corals maintained their pHcf at near constant elevated levels independent of the highly variable temperatures and FOCE-controlled carbonate chemistries to which they were exposed, implying they have a high degree of tolerance to ocean acidification.
Keywords: ocean acidification, FOCE, Heron Island, coral resilience, pH up-regulation
Abstract
Geochemical analyses (δ11B and Sr/Ca) are reported for the coral Porites cylindrica grown within a free ocean carbon enrichment (FOCE) experiment, conducted on the Heron Island reef flat (Great Barrier Reef) for a 6-mo period from June to early December 2010. The FOCE experiment was designed to simulate the effects of CO2-driven acidification predicted to occur by the end of this century (scenario RCP4.5) while simultaneously maintaining the exposure of corals to natural variations in their environment under in situ conditions. Analyses of skeletal growth (measured from extension rates and skeletal density) showed no systematic differences between low-pH FOCE treatments (ΔpH = ∼−0.05 to −0.25 units below ambient) and present day controls (ΔpH = 0) for calcification rates or the pH of the calcifying fluid (pHcf); the latter was derived from boron isotopic compositions (δ11B) of the coral skeleton. Furthermore, individual nubbins exhibited near constant δ11B compositions along their primary apical growth axes (±0.02 pHcf units) regardless of the season or treatment. Thus, under the highly dynamic conditions of the Heron Island reef flat, P. cylindrica up-regulated the pH of its calcifying fluid (pHcf ∼8.4–8.6), with each nubbin having near-constant pHcf values independent of the large natural seasonal fluctuations of the reef flat waters (pH ∼7.7 to ∼8.3) or the superimposed FOCE treatments. This newly discovered phenomenon of pH homeostasis during calcification indicates that coral living in highly dynamic environments exert strong physiological controls on the carbonate chemistry of their calcifying fluid, implying a high degree of resilience to ocean acidification within the investigated ranges.
Atmospheric CO2 has risen by more than 30% during the last century, causing a reduction in seawater pH of ∼0.1 units relative to preindustrial times, with a further reduction of 0.1–0.4 units predicted to occur by the end of this century (1). This process, commonly known as “ocean acidification,” is expected to have severe impacts on calcifying marine organisms due to its effect on the thermodynamics of biomineralization (2). Our current understanding of the sensitivity of coral calcification to declining seawater pH has mainly been inferred from short-term laboratory-based studies that do not fully simulate real-world reef conditions, particularly the daily to seasonal variations in temperature, light, and pH (3–5). To address these shortcomings, we applied free ocean carbon enrichment (FOCE) technologies (6–9) to manipulate water chemistry in situ and thereby provide more realistic experimental conditions to investigate how future levels of acidification could affect marine organisms according to different representative concentration pathways (RCPs) (10). The FOCE system uses a flow-through flume design that allows organisms to experience near natural conditions, in particular the daily and seasonal regimes of fluctuating temperature, light, and nutrients while maintaining offsets in flume water pH below that of ambient environmental conditions. This manipulation of the FOCE environment is accomplished by the controlled introduction of small volumes of low-pH modified seawater into the open-ended flumes at levels necessary to simulate future declines in ambient seawater pH. The FOCE system therefore enables realistic simulations of the effects of ocean acidification within natural reef environments at levels of atmospheric pCO2 that are predicted to occur by the end of this century (10).
The influence that external seawater chemistry (i.e., pH and saturation state) has on biomineralization and ion transport processes during skeleton formation is central to understanding how ocean acidification will affect coral calcification and therefore their general ability to maintain the balance between reef growth and erosion (2). Although a clear understanding of the physico-chemical mechanisms controlling coral calcification is still only emerging, an important means of biological control is up-regulation of pH (11, 12) at the site of calcification (pHcf). This pH modification is thought to occur predominantly by the biologically mediated action of Ca-ATPase ion transporters that exchange 2H+ for Ca2+ (13, 14), but how such biological controls are affected by changes in the ambient marine environment is still poorly understood. It is also becoming increasingly apparent that the natural level of environmental variability to which coral reef systems are subjected to also influences their potential to adapt and/or acclimatize to environmental change (15–17). Understanding how corals living in dynamic environments physiologically respond to large diel and seasonal changes in seawater temperature and pH can thus provide important insights into the resilience or vulnerability of corals to ocean warming and acidification. The Heron Island FOCE experiment was thus designed to explore these questions through the application of targeted increases in pCO2 over an extended time scale to corals living in the highly variable environment of the Heron Island reef flat (9).
The boron isotopic composition (δ11B) of carbonate skeletons essentially records the biologically mediated pH of the calcifying fluid as calcification occurs (11, 12, 18). The use of δ11B as a pH proxy is based on the selective incorporation of the pH-sensitive and isotopically distinct borate ion, B(OH)4, into the corals’ calcium carbonate skeleton (19, 20). Prior studies have shown that the δ11B of coral skeletons exhibit a significant positive offset from the theoretical borate curve, equivalent to an elevation of ∼0.5–0.8 units in the pHcf relative to that of the external seawater pH (11), due to the ability of corals to manipulate their pHcf using energy-dependent ion transporters (13). These observations have been independently corroborated by similar measurements of pHcf using electrodes and pH-sensitive dyes (18, 21, 22). Biological controls on calcification impart significant species-specific but highly systematic increases in pHcf relative to ambient seawater (11). The thermodynamic cost of pH up-regulation within the calcifying fluid, however, is still relatively small compared with the amount of metabolic energy available given normal rates of photosynthesis, respiration, and calcification in reef-building corals (12). Elevation of pHcf above ambient seawater results in higher aragonite saturation states in the calcifying fluid (Ωcf ) that in turn drives higher rates of mineral precipitation (12, 21, 23, 24). Understanding the response of pHcf to ocean acidification is therefore critical to predict the effects that increasing levels of atmospheric CO2 will have on calcification and net reef growth.
Here, we report the sensitivity of pHcf within and between colonies of Porites cylindrica grown in situ within a FOCE experiment comprising of flumes subject to both natural (and often extreme) diel and seasonal changes in seawater temperature and pH, as well as enhanced shifts (decreases) in seawater pH to simulate future conditions (10). These experiments were conducted within the highly dynamic reef flat of Heron Island in the Great Barrier Reef (GBR) and covered a range of pCO2 scenarios (9). We show that P. cylindrica corals living in this highly dynamic environment exhibit a previously unrealized strong pHcf homeostasis, despite the highly variable conditions on the reef flat, as well as the superimposed pH offsets (∼−0.05 to −0.25 units) in FOCE treatments which simulate future seawater chemistry in a high-pCO2 atmosphere. We then explore what this apparent lack of sensitivity in pHcf to changes in ambient seawater pH implies for the growth of P. cylindrica living in such dynamic environments, as well as how these corals may respond to increasing acidification in a high-pCO2 world.
Heron Island Reef Flat
Heron Island (23.442°S, 151.914°E) is a subtropical coral cay situated in the southern area of GBR located ∼80 km off the coast of Queensland (Fig. S1). The dominant substrate of the inner and midreef flat are carbonate sands that are sporadically populated by coral patches several meters across which typically comprise species of Acropora and Porites. Tides at Heron Island are semidiurnal, and reef flat waters are separated from the open ocean for a few hours each day at low tide. The shallow depth of the reef flat and periodic isolation at low tide combined with the active metabolism of its benthic communities result in strong diel and seasonal variations in the chemistry of the reef waters (9) (Fig. 1).
Fig. S1.
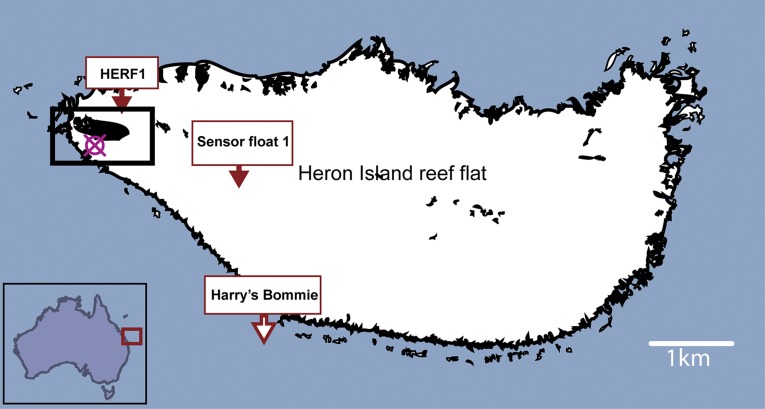
Heron Island location map positioned off the coast of Queensland, East Coast of Australia (Inset). Main map shows the position of FOCE 2010 experiment (red circle cross) in relation to the island (in black box). Location of NOAA mooring (Harry's Bommie) which provided temperature and CO2 data. Data available from cdiac.ornl.gov/oceans/Moorings/Heron_Island.html. Also shown are mooring locations for sea surface temperature loggers: AIMS logger HERFL1 (data.aims.gov.au/metadataviewer/faces/view.xhtml?uuid=446a0e73-7c30-4712-9ddb-ba1fc29b8b9a) and IMOS Heron Island sensor float (data.aims.gov.au/metadataviewer/faces/view.xhtml?uuid=20eaf8a6-817a-450d-9a36-deb980d2daab).
Fig. 1.
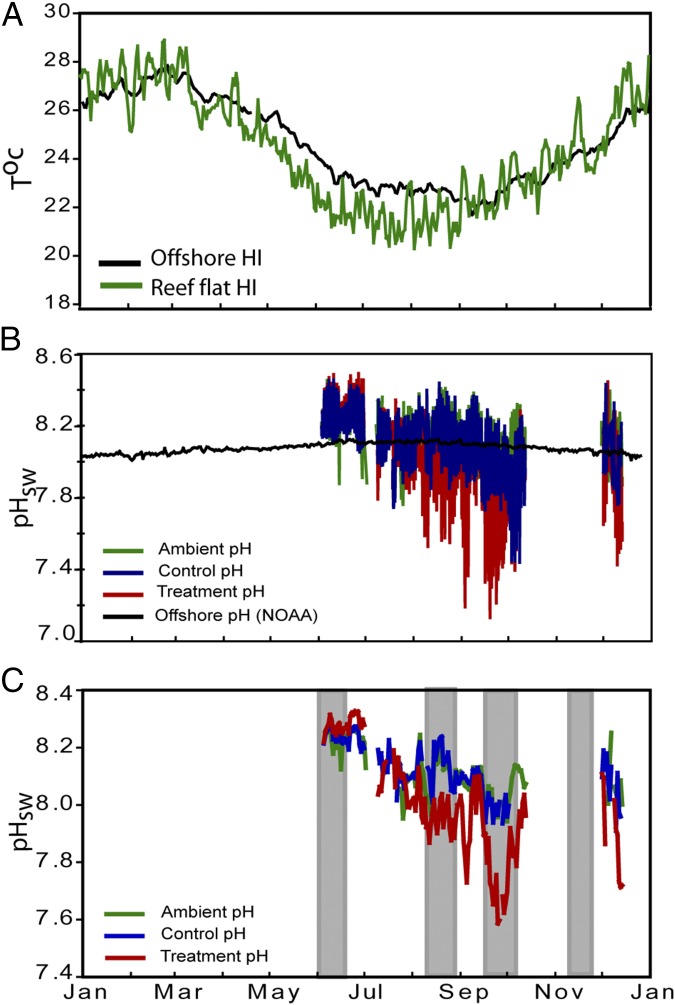
(A) Daily average water temperatures (°C) both offshore (green) and on the Heron Island reef flat (black) from January 2010 to December 2010. (B) Daily pHsw (total pH scale) taken at 3-h intervals from end of May 2010 to early December 2010. Offshore data (black), within reef flat data (green), control flume data (blue), and treatment flume data (red). Same color reference applies to C except no offshore data shown. gray vertical bars indicate time intervals of milled δ11B samples. Missing data due to the passing of a tropical storm. Offshore temperature data obtained from a NOAA PMEL CO2 buoy near Harry’s bommie (22.46°S, 151.93°E) managed by the Marine and Atmospheric Research Division of the Commonwealth Scientific and Industrial Research Organization (27) cdiac.ornl.gov/oceans/Moorings/Heron_Island.html. Reef flat temperature data taken from IMOS relay pole #2 (data.aims.gov.au/metadataviewer/uuid/7e3ec622-8f28-4dba-95af-b8075a42241a). Offshore pH data were calculated from records of fCO2 data obtained from the Heron Island NOAA buoy assuming an offshore total alkalinity of 2,275 µEq/kg (7). See Fig. S1 for location of loggers and method details. Reproduced from ref. 9.
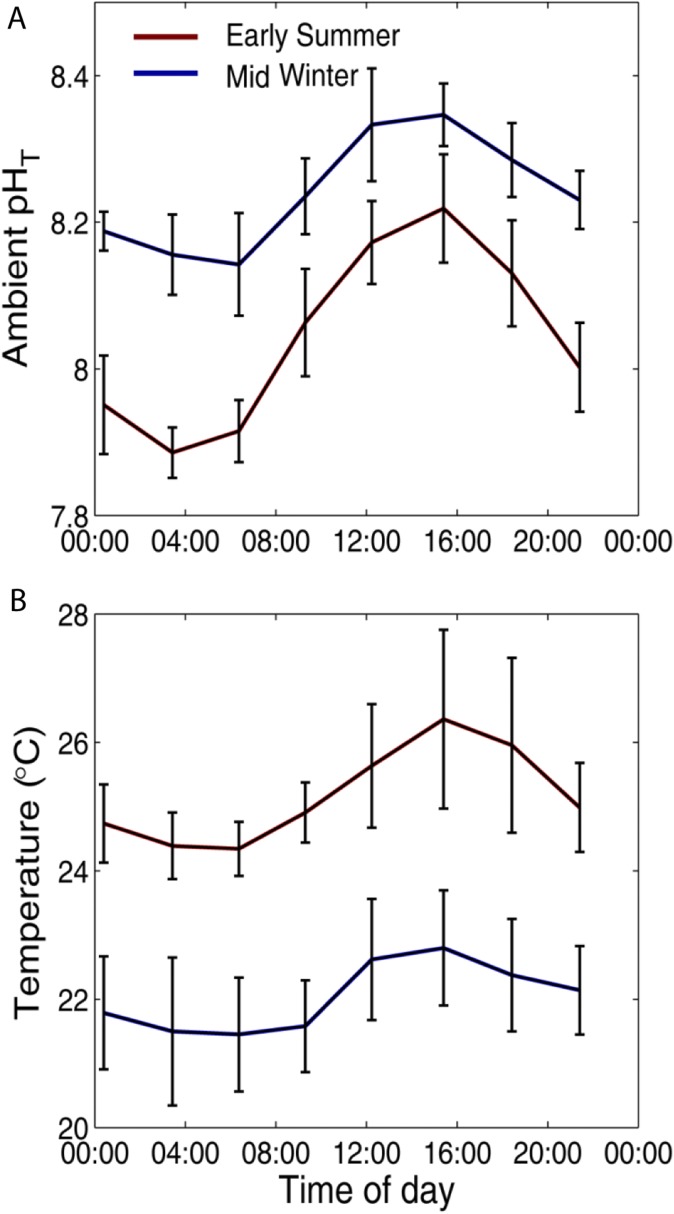
Water temperatures offshore of Heron Island range from around 22 °C in winter to around 27 °C during summer. This seasonal temperature pattern is mirrored by the Heron Island reef flat (20 °C to 28 °C, respectively), albeit with slightly larger seasonal amplitudes (6.5 °C vs. 5.5 °C) and stronger diel variations (3–4 °C; Fig. 1A). This variability is due to the shallow reef flat waters being more susceptible to local atmospheric heating and cooling, especially during low tides (9, 25). Similarly seasonal changes in net benthic metabolism (26) result in interseasonal variation in the pH (9) of reef flat waters (∼8.24 in June to 8.04 in December) that are much greater than in offshore waters (Fig. 1 B and C), the latter having relatively constant pH throughout the year (pH ∼8.0–8.1) (27). Reef flat waters on Heron Island are also subject to strong diel variations that can change by up to 0.75 pH units within a 24-h period (Fig. S2) (9).
Fig. S2.
Phase-averaged diurnal cycles of (A) ambient pH and (B) ambient water temperature (°C) in summer (red) and winter (blue) and at Heron Island Lagoon in early summer (mid-November to mid-December, blue) and winter (June, red). The error bars correspond to ±SE.
The FOCE system was constructed on the Heron Island reef flat with four submerged flumes (two controls and two treatments) oriented parallel to the shore, each flume open to the environment at both ends and on the bottom. Five living parent colonies of the branching coral P. cylindrica were harvested from the Heron Island reef flat and transplanted into both treatment and control flumes, such that each flume contained a representative selection of each colony. The FOCE flumes were deployed for more than ∼6 mo, from the end of May to mid-December 2010.
The FOCE Experiment
Colonies of P. cylindrica collected from Heron Island reef flat were first acclimatized for 4 wk before the experiment which commenced in the winter of 2010 (June). In the first phase of the experiment (June to July), all flumes were initially set to follow the same ambient pH conditions of the reef flat waters (mean winter pH ∼8.24) to allow colonies to acclimatize further and recover from transplantation. In the second phase of the experiment (July to September), the pH of the FOCE treatment flumes were progressively offset relative to the ambient reef flat water by −0.05 in July, then by −0.15 in August, and finally by −0.25 pH units in September (Fig. 1C). The treatment flumes were maintained at this reduced pH offset (−0.25) until early October when the experiment was interrupted by a strong tropical storm that led to a temporary cessation of the pH offset in the FOCE treatments. The experiment then resumed in late November when treatment flumes were again subjected to pH offsets of around −0.25 relative to the ambient seawater pH, which continued until the end of the experiment in mid-December (Table S1). As noted above, both the controls and treatments were subject to strong natural diel and seasonal forcing independent of the FOCE experiment. This strong combined diel and seasonal variation in reef flat pH allowed us to simultaneously examine the response of each coral’s internal chemistry to both high levels of natural variability in ambient pH together with systemic shifts in pH expected to occur over this century.
Table S1.
Summary of the key environmental water quality parameters in the FOCE flumes and ambient waters of Heron Island during periods corresponding to when boron isotope measurements were made
| FOCE/ambient | Month | T (°C) | Salinity (‰) | TA | pH |
| Ambient | June | 22.0 (±0.02) | 35.0 (±0.06) | 2,239 (±22) | 8.24 (±0.002) |
| August | 21.7 (±0.03) | 35.4 (±0.07) | 2,251 (±23) | 8.13 (±0.002) | |
| September | 22.4 (±0.02) | 35.3 (±0.01) | 2,253 (±37) | 8.02 (±0.002) | |
| November | 24.3 (±0.33) | 34.6 (±0.01) | 2,226 (±32) | 8.11 (±0.023) | |
| Control | June | 22.0 (±0.02) | 35.0 (±0.06) | 2,239 (±22) | 8.24 (±0.002) |
| August | 21.7 (±0.03) | 35.4 (±0.07) | 2,251 (±23) | 8.11 (±0.002) | |
| September | 22.4 (±0.02) | 35.3 (±0.01) | 2,253 (±37) | 8.04 (±0.002) | |
| November | 24.3 (±0.33) | 34.6 (±0.01) | 2,226 (±32) | 8.11 (±0.016) | |
| Treatment | June | 22.0 (±0.02) | 35.0 (±0.06) | 2,239 (±22) | 8.24(±0.001) |
| August | 21.7 (±0.03) | 35.4 (±0.07) | 2,251 (±23) | 7.95 (±0.002) | |
| September | 22.4 (±0.02) | 35.3 (±0.01) | 2,253 (±37) | 7.74(±0.002) | |
| November | 24.3 (±0.33) | 34.6 (±0.01) | 2,226 (±32) | 8.10 (±0.020) |
Data on ambient temperature (T), salinity (S), and total alkalinity (TA in µEq/kg) are taken from Kline et al. (9) describing ambient seawater conditions during the experiment. All pH data shown were the result of direct measurements within and outside FOCE flume systems over the course of the study.
Results and Discussion
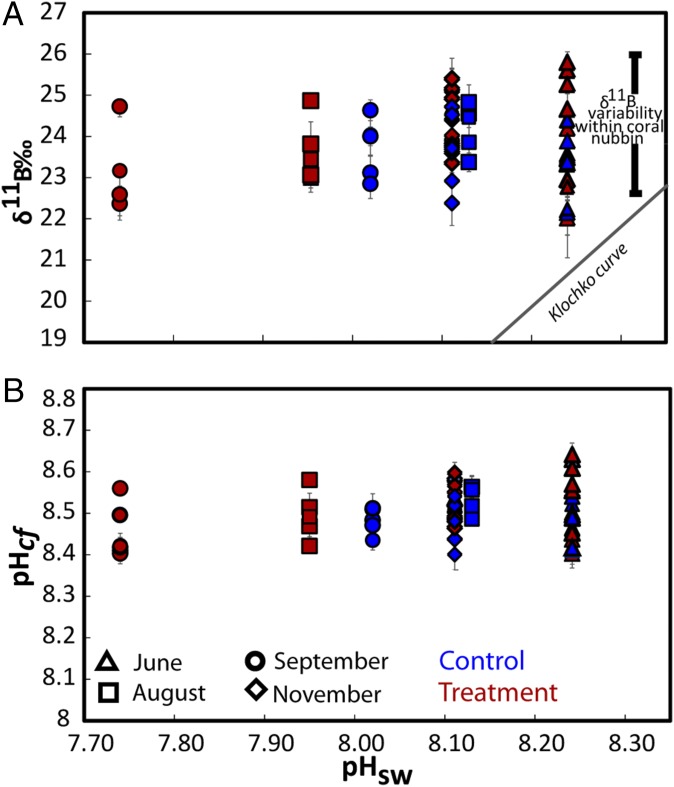
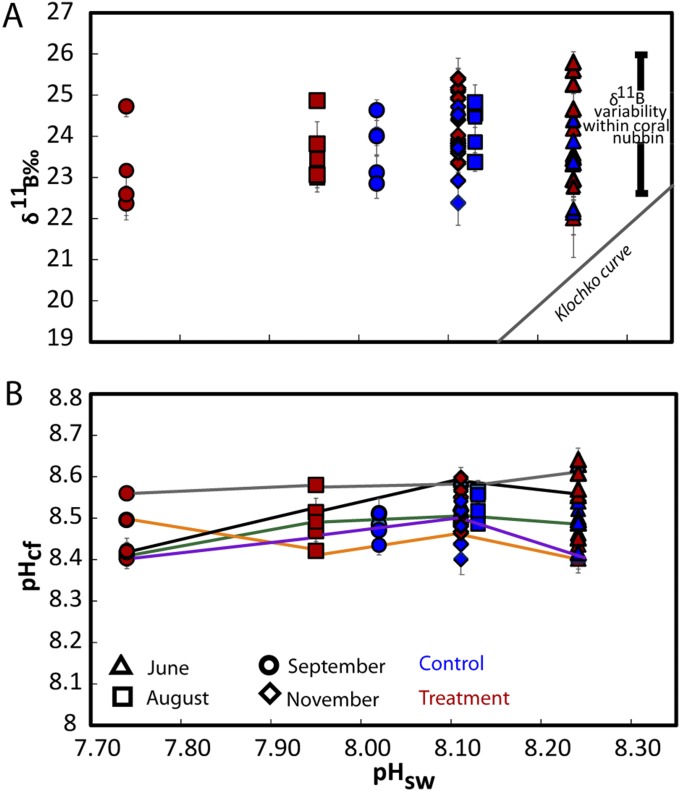
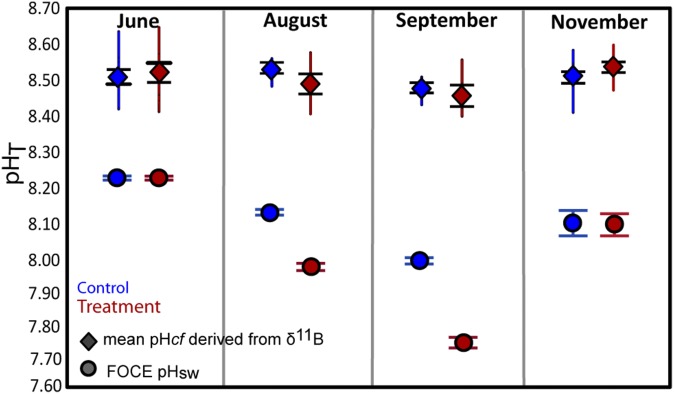
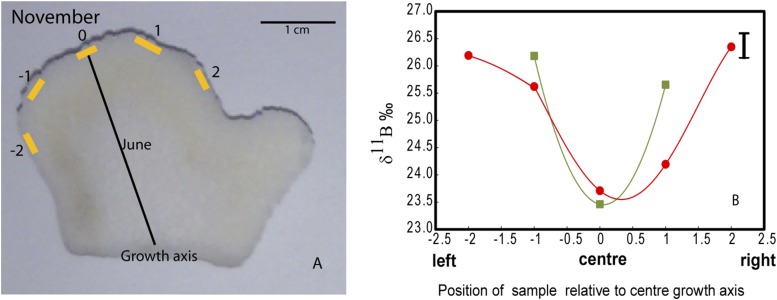
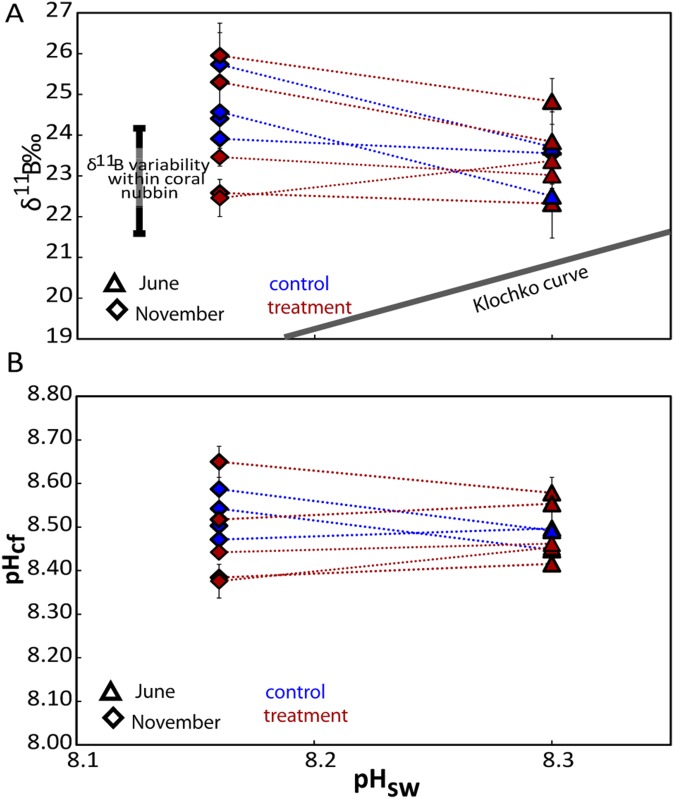
The δ11B compositions (Dataset S1) were measured from a series of subsamples collected along the major growth axis of the skeletons of the P. cylindrica nubbins from each of the four FOCE flumes (Fig. S3). High-resolution profiles of strontium to calcium ratios (Sr/Ca; Materials and Methods) were used to determine seasonally resolved chronologies and extension rates. Calcification rates along the primary growth axis were calculated from the product of extension rates and density, with the latter determined using the buoyant weight method. Based on the Sr/Ca chronology, the δ11B compositions were determined for four distinct periods of growth: June, August, late September, and late November 2010 (Fig. 1C). The August and especially the late September periods were representative of particularly low pH regimes within the treatment flumes (Fig. 1). Samples analyzed for δ11B represent ∼3 wk of growth and hence incorporate the shorter-term variations in calcification driven by, for example, diel cycles in the supply of metabolic carbon from photosynthesis and respiration (18, 28). During the initial phase of the experiment in midwinter, when the reef flat waters were characterized by relatively high pH (∼8.3 units; Fig. 2), the coral nubbins exhibited a wide range of δ11B values (∼22‰ to ∼26‰). During the early spring phase (i.e., late September) of the experiment, coral nubbins again exhibited the same range in δ11B (∼22‰ to ∼26‰) despite the significant reduction in pH within the FOCE treatments and in the ambient reef flat pH. Importantly, individual nubbins exhibited near constant δ11B compositions along their major growth axis over each of the four growth periods measured, regardless of whether they were grown under treatment or control conditions (Fig. 2A and Fig. S4A). These near constant δ11B compositions equate to near constant internal pHcf (Fig. 2B and Fig. S4B), irrespective of treatment and season and declined by less than 0.1 units per unit decrease in external pHsw (= 0.067, P = 0.078, df = 36; Table S2 and Fig. 2B). This result reflects the capacity of these coral to homeostatically maintain a pHcf of ∼8.4–8.6 at the site of calcification (Fig. 3) and thus near constant up-regulation of pHcf during the calcification process. As such, these findings are in marked contrast to earlier laboratory studies in which corals grown under stable and constant pH conditions exhibited a stronger sensitivity to ambient seawater pH, whereby pHcf decreased by up to 0.5 units for each unit decrease in ambient seawater pH. However, under the naturally and highly dynamic pH conditions within the Heron Island reef flat, corals seemingly exert a much stronger physiological control of pHcf, which overrides the seasonal ambient depression in seawater pH, as well as the superimposed FOCE induced decrease in seawater pH. Reinterpretation (11) of previous laboratory work using P. cylindrica colonies under depressed pCO2 conditions (29) indicates that pH up-regulation was taking place at the site of calcification in this species; these previous experiments, however, kept CO2 constant throughout the experiment and therefore did not capture the dynamic nature of many natural reef environments. We note that the finding from our study of strong pH homeostasis as exhibited along the major growth axis of the coral skeletons occurs despite the large range in δ11B for intercolonial (Fig. 2) and off-axis intracolony specimens (Fig. S5). The observation of higher δ11B values for off-axis compared with the primary growth axis of the nubbins (Fig. S5) is unexpected because growth is higher along the primary growth axis, so we can only speculate that factor(s) other than direct pHcf controls on CO32−, such as the internal transport of carbon and energy to sites of calcification (30) are driving faster axial growth rates.
Fig. S3.
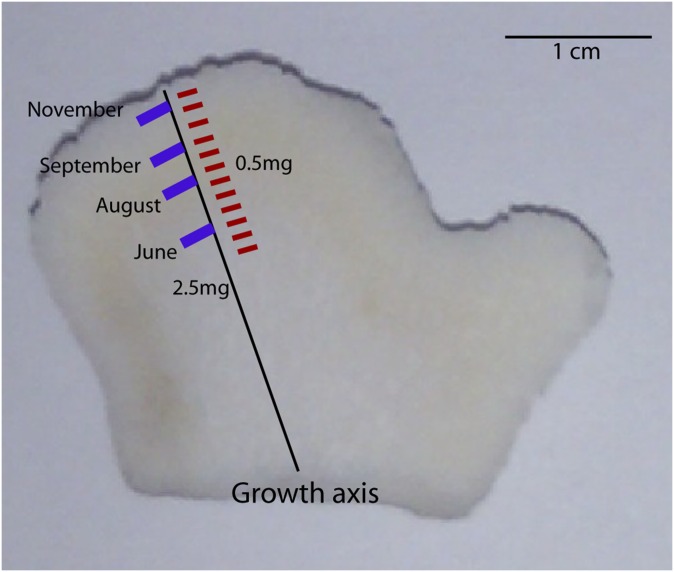
Image showing the location where high-resolution 0.5-mg trace element (red) and 2.5-mg boron isotope (blue) subsamples were collected along the primary growth axis. Samples for trace element analysis were milled from one half of each sliced nubbin, whereas samples for boron isotope analysis were milled from the opposing half.
Fig. 2.
(A) Measured δ11B composition of all nubbin colonies from treatment (red symbols) and control (blue symbols) flumes vs. the average measured pH seawater conditions at June, August, September, and November 2010 within control and treatment flumes during the FOCE experiment. The boron isotope composition of all samples is elevated relative to the abiotic curve provided by Klochko et al. (50). (B) pH of the calcifying fluid (pHcf) derived from the δ11B shown in A using Eq. 2. A linear mixed effects model indicated only a modest dependency of pHcf on pHsw (= 0.067, P = 0.078, df = 36; Table S2 and Fig. 2B).
Fig. S4.
(A) Measured δ11B composition of all colonies (2.75-mg samples) from treatment and control flumes vs. the average measured pH seawater conditions at June, August, September, and November 2010 within control and treatment flumes during the FOCE experiment. The boron isotopic compositions of all samples are elevated relative to the abiotic curve from Klochko et al. (50). (B) pH of the calcifying fluid (pHcf) derived from the δ11B shown in A using Eq. 2. Plots as in Fig. 2 but connecting lines track pHcf of the same nubbin over the course of the experiment.
Table S2.
Results from a linear mixed effects model of pHcf vs. pHsw grouping measurements by colony including the best-fit slope and intercept due to fixed effects of pHsw on pHcf, as well as the SE in each parameter estimate, the significance of the calculated parameter value (p), and the random effects attributed to each colony in units of pH
| Stat | Slope | Intercept | Colony | Random effects |
| Best fixed | 0.067 | 7.95 | B | −0.014 |
| SE | 0.046 | 0.37 | G | 0.003 |
| p | 0.078 | <0.001 | R | −0.013 |
| W | 0.025 |
Preliminary analysis revealed that the variance due to random effects associated with the intercept (7.85 in pH units) was several orders of magnitude higher than the variance associated with the random effects in the slope of pHcf vs. pHsw. Therefore, random effects associated with the slope were excluded from the mixed effects model. We had originally wanted to include time as an independent fixed predictor given that the experiment lasted ∼6 mo from mid-winter to early summer. However, there was a significant correlation between pHsw and time due to the seasonal changes in pHsw, as well as the progressive decline in FOCE treatment pHsw over the course of the experimental period (r = −0.41, P < 0.01, n = 40) (df = 36, rmse = 0.05); thus, preventing time from being considered an independent factor. Nonetheless, when we ran a linear mixed model including time as a separate fixed factor, the best-fit slope of changes in pHcf vs. pHsw was only modestly higher, or 0.107 vs. 0.067. An F test showed that the residual variance in model predictions was not significantly lower when including time as a separate factor vs. not including time (F35,36 = 1.05, P = 0.46), thus giving us further cause to exclude time as a separate independent factor.
Fig. 3.
Boxplots showing range (colored vertical lines) and the mean (diamond) and (±1) SE from the mean (black bars) of pHcf of P. cylindrica nubbins taken at four intervals of growth (June, August, September, and November) grown under treatment (red) and control (blue) conditions. Also shown are the mean (circle) and SE (colored horizontal bars) of the pH of the seawater within both treatment (red) and control (blue) FOCE flumes.
Fig. S5.
(A) Representative diagram showing position of milled samples, exploring boron isotopic composition within single nubbins. Nubbins sampled at three or four points along the most recent growth horizon (November 2010). 0 represents summer growth at central growth axis, off-axis samples taken from left (−1, −2) and right (1, 2) of the growth axis. (B) Boron isotopic composition of two representative nubbins comparing the axis and off-axis samples to the right and left of the central growth axis shown in A.
Extension rates of P. cylindrica nubbins used in both the treatment and control flumes were similar to P. cylindrica from elsewhere in the GBR (31); however, this is not entirely surprising given that coral can maintain similar rates of extension under low-pH conditions at the cost of reduced skeletal density and hence rates of calcification (32). Nonetheless, we find that the skeletal densities in the low pH FOCE corals differed by less than 3% from the densities of control corals (Table S3). Furthermore, the calcification rates that we measured were comparable to or higher than rates reported in prior studies (33, 34), which further demonstrates the capacity of P. cylindrica from Heron Island reef flat to calcify and grow at normal rates despite the highly variable and disparate thermal and chemical conditions in the controls and in the FOCE treatments.
Table S3.
Physiological data from P. cylindrica nubbins used to calculate calcification rates including the weight each nubbin in air (dry weight grams) and in water (wet weight grams) and the density of each coral nubbin calculated from the buoyant weights according to Spencer Davies (46)
| FOCE | Dry weight (g) | Wet weight (g) | Coral density (±0.02) | Ext. rate (cm/y) (±0.24) | Growth rate (g/cm2/y) |
| Control | 7.48 | 0.14 | 1.02 | 1.45 | 1.47 (±0.31) |
| 2.44 | 0.20 | 1.08 | 1.69 | 1.83 (±0.28) | |
| 4.28 | 0.43 | 1.11 | 1.45 | 1.60 (±0.28) | |
| 3.63 | 0.55 | 1.18 | 1.08 | 1.28 (±0.29) | |
| 1.05 | 0.15 | 1.16 | 1.45 | 1.68 (±0.28) | |
| Treatment | 4.93 | 0.23 | 1.05 | 1.08 | 1.13 (±0.31) |
| 3.49 | 0.14 | 1.04 | 1.32 | 1.38 (±0.32) | |
| 1.21 | 0.18 | 1.17 | 1.57 | 1.84 (±0.30) | |
| 2.38 | 0.14 | 1.06 | 1.57 | 1.66 (±0.27) | |
| 5.73 | 0.40 | 1.07 | 1.20 | 1.29 (±0.29) |
The extension rate (cm/y) as derived from the seasonal maxima in Sr/Ca ratio (Fig. S4) and the estimated calcification rate (g/cm2/y). The estimated errors for each recorded weight and the resulting calculated densities are ±0.01 g and ±0.02 g/cm3, respectively. The individual errors in estimates of extension rates and calcification rates are shown in parentheses.
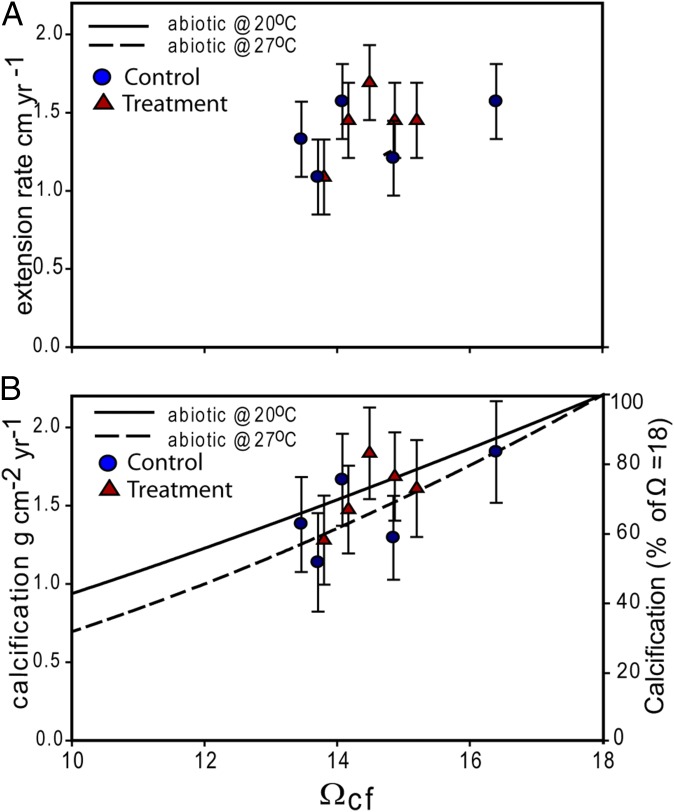
To better understand how extension and calcification rates varied within and between colonies, we used a “bio-inorganic model” of calcification based on the model of internal pH regulation abiotic calcification (IpHRAC) (12). In this model, the rates of calcification depend primarily on the saturation state of the calcifying fluid (Ωcf) according to known abiotic rate kinetics (24), which are in turn dependent on elevated levels of pH and DICcf in the calcifying fluid relative to ambient seawater conditions (Materials and Methods). We found no significant relationship between rates of extension and estimated saturation state inside the calcifying fluid (Fig. 4A), thus providing further evidence that physical rates of coral extension are not strictly dependent on the chemical conditions driving rates of biomineralization within the calcifying fluid. Nonetheless, rates of coral calcification were positively correlated with Ωcf (r2 = 0.41, P = 0.05, n = 10; Fig. 4B), albeit modestly, due to both uncertainties in derived calcification rates (∼20%) and the very narrow dynamic range of internal saturation states over which this dependency could be determined (Ωcf = 13.5–16.4 or a relative variation of just 19%). The limited range in Ωcf among experimental colonies was, of course, the direct result of the maintenance of near-constant internal pHcf across treatments and seasons (Fig. 3). Thus, although coral calcification is a biologically mediated process influenced by both external (e.g., light, temperature, food abundance) (35) and internal [e.g., production of organic matrices as templates (36) for skeletal formation] processes, our simple bio-inorganic model nonetheless explains the first-order functional dependence of calcification rates on internal Ωcf (Fig. 4 A and B).
Fig. 4.
(A) Extension rates of P. cylindrica (y axis) from both ambient (circles) and elevated pCO2 (triangles) treatments vs. aragonite saturation state of the calcifying fluid (Ωcf ) calculated from boron isotope measurements according to the IpHRAC model of McCulloch et al. (11) (Materials and Methods; r2 = 0.21, P = 0.19, n = 10). (B) Calcification rates (left y axis) of ambient (circle) and treatment (triangle) P. cylindrica corals vs. Ωcf (r2 = 0.41, P = 0.05, n = 10). Also shown are predicted rates of aragonite precipitation (right y axis) as a function of Ωcf relative to Ωcf = 18 at both 20 °C and 27 °C according to the reported abiotic rate kinetics of aragonite precipitation (24).
Our study now provides a process-based mechanism (up-regulation and/or homeostasis of pHcf) that can account for the increased tolerance of corals growing under ranges of ambient seawater pH in highly dynamic reef systems. How sensitive the growth of marine calcifiers is to ocean acidification thus depends on the particular strategies (or lack thereof) for controlling pH at the site of calcification. Based on our findings, we propose three types of strategies: (i) the passive strategy whereby pH up-regulation does not occur and rates of calcification follow an abiotic mineral precipitation curve that is highly dependent on ambient pH and pCO2, and growth in these organisms will be highly sensitive (12) to ocean acidification (e.g., some species of foraminifera); (ii) the partial regulation strategy, whereby some up-regulation occurs but the calcifying fluid pHcf is still partially modulated by the external environment (11, 12) and rates of calcification are only partially dependent on ambient pH and pCO2, and growth in these organisms will be only moderately sensitive to ocean acidification; and (iii) the highly resilient or homeostatic strategy, as identified in this study, where a near constant internal (extracellular) pHcf of the calcifying fluid is maintained at a fixed level to optimize calcification rates independent of external conditions, and growth in these organisms will be the least sensitive to ocean acidification. This homeostasis strategy was also observed in the massive corals Porites lutea and P. lobata during microcosm experiments (37), where the synergetic effects of increased temperature and low pH showed no net effect on calcification rate. The most likely or realistic scenario is that most reef-building corals fall somewhere within the second and third categories; that is, being weaker or stronger partial regulators of internal pHcf depending on their taxonomy, habitat, and/or symbiont composition (11, 12, 22, 38). Indeed, Porites appears to be a genus whose adult colonies are highly resilient to ocean acidification, as also shown from their occurrence around CO2 seeps (39), yet their skeletal densities and calcification rates can nevertheless decline when exposed to particularly caustic seawater chemistries (Ωsw < 2) (40). The variation between and within coral species to maintain robust rates of calcification in low pH (or low Ωarg) conditions may also be a function of their ability to access additional sources of metabolic energy via particle feeding (41). Nonetheless, naturally occurring acidified reefs (Ωsw < 3) can still support reasonable levels of coral diversity and growth (42), despite any taxa-dependent differences in pH sensitivity.
The capacity of corals to adapt to a changing environment is also expected to vary among species depending on their ability to isolate their growth and metabolism from changes in ambient conditions (12, 43, 44). The results presented herein shows that P. cylindrica corals from the Heron Island reef flat maintained elevated extracellular pHcf at the levels necessary to support rates of skeletal growth similar to those recorded in other Porites species. Although this capacity for pHcf homeostasis appears to be strongest for P. cylindrica colonies growing in more extreme and highly dynamic chemical environments, it is still uncertain how well these coral can maintain this level of pHcf homeostasis with the additional stress of increased temperature (5). To better understand how future reefs may change under high-pCO2 environments, it is further necessary to assess this potential biological resistance in a range of coral species from environments with different chemical and thermal regimes (5), as well as assess the metabolic cost associated with persistently high pH up-regulation when ambient pH is very low. Regardless, the ability of pH-homeostatic coral to survive and grow in these extreme pH environments may provide them with a greater resilience to the increased levels of ocean acidification expected to occur over the coming decades and centuries.
Materials and Methods
CP-FOCE System.
In May 2010, five colonies of P. cylindrica were collected from the Heron Island reef flat and divided into subsamples that were allowed to recover on the reef flat for 4 wk before commencing the experiment. In June 2010, the subsamples from each colony were transplanted to each flume to maximize the diversity of the fragments within the flumes and allowed to acclimatize in situ within all four FOCE chambers for a further 4 wk before lowering pH within the flume systems. The pH levels within treatment flumes were then incrementally lowered relative to ambient reef flat water in July (−0.05 pH units), August (−0.15 pH units), and September (−0.25 pH units). The pH within the treatment flumes were then maintained at a constant offset of −0.25 units relative to the controls until early October, when a passing tropical storm interrupted the CO2 injections and the acquisition of water quality data. The treatments were reinitiated in late November and ran until the end of the experiment (December 2010).
Discrete water samples were collected daily over the course of the experiment for the analysis of dissolved inorganic carbon (DIC), pH, total alkalinity (AT), and dissolved oxygen. Continuous measurements of pH were made with MBARI digital pH sensors (Nido Instruments), and conductivity, temperature, and depth were measured with a Seabird SBE-16plusV2 SEACAT (Sea-Bird Electronics). For a full description of the FOCE systems, environmental data monitoring, and instrument models/specifications, see refs. 6, 7, and 9.
Sampling Protocol and Geochemical Methods.
Coral nubbins were first bleached and then sliced in half to expose the central growth (extension) axis of the coral. One half was used for the analysis of trace elements (to constrain growth chronology), whereas the other half was used for boron isotope analysis. Samples for trace elements were extracted by milling along the major growth axis at 0.5-mm intervals to a depth of 1 mm (see Fig. S3 for diagram) using a video microscope mounted micromill (New Wave Research MicroMill Sampling System; Western Australia Department of Fisheries). Powdered samples (0.5–1 mg) were processed in the ultra-clean laboratory of the Advanced Geochemical Facility for Indian Ocean Research [AGFIOR, University of Western Australia (UWA)] for dissolution and dilution to 10-ppm Ca solutions. Trace element ratios were determined using the Thermo X-series-2 quadropole-inductively coupled plasma mass spectrometer (Q-ICPMS) housed in the UWA AGFIOR facility. Trace element ratios were corrected against an in-house (Davis Reef, NEP) and interlaboratory (JCp-1) coral standards.
Constraining Growth Chronology with Sr/Ca Analysis.
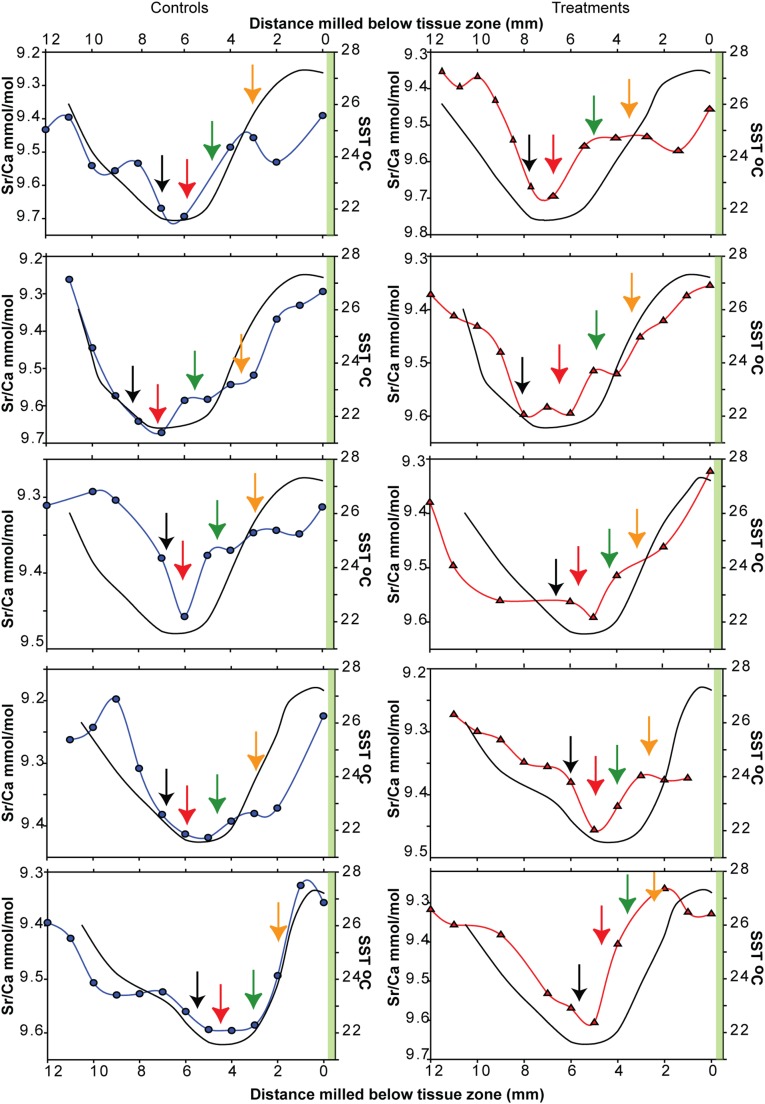
Sr/Ca ratios from each coral nubbins (samples of 0.5–1 mg) were measured to provide high resolution (2–4 wk) sampling of ambient seawater temperatures over a roughly 1-y period that began well before commencement of the experiment (Fig. S3 and Dataset S2). Like many other coral, seasonal changes in the Sr/Ca ratios of P. cylindrical nubbins were inversely proportional to average monthly reef flat temperatures (45) (Fig. S6). Low Sr/Ca ratios at the apex below the tissue zone of the nubbin (0–1 mm) coincided with higher spring temperatures compared with high Sr/Ca ratios measured between 5 and 7 mm from the apex that coincided with lower winter temperatures. P. cylindrica is reportedly a relatively slow growing species, which is consistent with our trace element data that indicates extension rates of ∼1–1.5 mm/mo. Separate Sr/Ca analyses on 5-mg samples conducted during preliminary work also revealed seasonal timing in reef flat temperature minima and maxima that were consistent with the higher-resolution Sr/Ca sampling (Fig. S6). This trace element analysis confirmed the seasonal timing of our boron isotope samples and our ability to follow the primary growth axis back in time.
Fig. S6.
Strontium/calcium ratios measured from control (blue) and treatment (red) colonies plotted against distance sample was taken from below the tissue zone. Right y axis is SST derived from Heron Island ambient SST calibrated against Sr/Ca measurements. Black arrow indicates start of experiment (June sampling ambient), red arrow indicates highest Sr/Ca (lowest SST), green arrow indicates mid-August sampling (−0.15 pH unit offset, treatments only), and yellow arrow indicates September to beginning of October sampling (−0.25 pH unit offset, treatments only). Final sample (November, when all flumes returned to ambient) taken from below tissue zone (indicated by green vertical band).
Extension and Calcification Rates.
Linear extension rates were estimated from the physical distance between two points along the primary growth axis identified as occurring in midwinter and early summer according to the Sr/Ca sea surface temperature proxies. Density was calculated using the buoyant weight technique (46), where corals were weighed dry in air before being vacuum sealed in plastic to minimize the effect of air and then submerged and weighed in distilled water. Calcification rates along the primary growth axis were estimated for individual nubbins from multiplying linear extension rates by skeletal densities.
Boron Isotope-pH Proxy.
Carbonate samples for boron isotope analysis were extracted along the primary growth axis (Fig. S3) using a small hand held dental drill (Saeshin Strong 206/103L), fitted with diamond burs, at the UWA AGFIOR facility. Sample sizes of 2.5 mg were drilled at the last growth period, representing November (just under the tissue zone), September, August, and the beginning of the experiment (June) as determined from the higher-resolution Sr/Ca data (0.5- to 1-mg samples), from which the time series of seasonal temperatures were derived (Fig. S6). Samples for δ11B determinations were dissolved in 0.58 N HNO3, and the boron was quantitatively separated on ion-exchange columns according to McCulloch et al. (47). Boron isotope analyses were measured using the Thermo Neptune Plus Multi Collector-ICPMS and NU Plasma II MC-ICP-MS (AGFIOR, UWA). Isotope data are reported in the permil notation relative to the NIST SRM 951 boron isotopic standard where
| [1] |
The pH of the calcifying fluid were derived from measured skeletal δ11Bcarb values according to the following equation (48):
| [2] |
where pKB is the dissociation constant dependent on temperature and salinity, δ11Bsw = 39.61 (49), and αB3-B4 is the boron fractionation factor for the pH-dependent equilibrium of B(OH)4− and B(OH)3 in seawater equal to 1.0272 (50).
Off-axis sampling (Fig. S5A) yielded significant differences in δ11B compositions of up to 2.65‰ (Fig. S5B) or up to 0.17 pH units. These significant fine scale spatial controls on δ11B compositions (18) are also indicative of strong physiological controls on pHcf at the corallite level. To ensure the repeatability of our results and the absence of such sampling artifacts, the initial 5-mg coral nubbin samples (Fig. S7) were replicated by resampling at a higher spatial resolution using 2.5-mg samples (Fig. 2). δ11B derived from both the 2.5- and 5-mg samples are in close agreement (Fig. 2 and Fig. S7).
Fig. S7.
(A) Measured δ11B composition from 5-mg samples from treatment and control flumes vs. the average measured pH seawater conditions at June and November 2010 within control and treatment flumes during the FOCE experiment. The boron isotopic compositions of all samples are elevated relative to the abiotic curve from Klochko et al. (50). (B) pH of the calcifying fluid (pHcf) derived from the δ11B shown in A using Eq. 2.
Modeling Ωcf and Coral Calcification.
Following the IpHRAC model of McCulloch et al. (12), the pHcf of the calcifying fluid was derived from the δ11B of the nubbin material (Eq. 2) with the DIC of the calcifying fluid (DICcf ) assumed to be twice that of the treatment and control seawater DIC as calculated from the treatment and control pH, as well as the ambient seawater TA (9). Ωcf for each individual colony were then calculated from pHcf and DICcf, as well as ambient temperature and salinity (9) using CO2SYS (51) and averaged over the entire growth period considered (July to December). Hypothetical rates of abiotic calcification (G) were calculated over a domain of Ωcf encompassing the average Ωcf of all colonies (Ωcf = 10–18; Fig. 4B) and range of temperatures encompassing the experimental period (T = 20–27 °C) according to G = k(Ωcf − 1)n, where k is the rate law constant, Ωcf is the saturation state within the calcifying fluid, and n is the order of the reaction (k and n being temperature dependent) (12). Because the absolute amount of biomineral surface area during calcification is not known at present (38), relative calcification rates were calculated by dividing all modeled calcification rates by the calcification rate achieved when the internal saturation state Ωcf was equal to 18.
Statistics.
We used a linear mixed effects model to examine the general dependency of skeletal δ11B and internal pHcf in P. cylindrica on changes in ambient seawater pH (Fig. 2B), where each colony was treated as an individual group. All statistical results were generated using the function nlmefit.m in Matlab v8.3.0 (Table S2).
Supplementary Material
Acknowledgments
We acknowledge the work of the scientists and engineers that carried out the FOCE experiment at Heron Island in 2010 and thank Dr. Kai Rankenburg from the University of Western Australia Advanced Geochemical Facility for Indian Ocean Research facility for technical assistance with the trace element and isotope analyses. We appreciate assistance from Jan Richards from the Department of Fisheries (Western Australia) for the use of their micromill. Permits from the Department of Environment and Resource Management (CSCE00874010) and the Great Barrier Reef Marine Park Authority (G09/29996.1) were provided to conduct this research. The CP-FOCE experiments were funded by Australian Research Council (ARC) Linkage Infrastructure Equipment and Facilities Grant LE0989608 (to O.H.-G., D.I.K., S.G.D., and M.M.), ARC Linkage Grant LP0775303 (to O.H.-G.), ARC Centre of Excellence Grant CE0561435 (to O.H.-G. and S.G.D.), a Queensland Government Smart State Premier's fellowship (to O.H.-G.), and a Pacific Blue Foundation grant (to D.I.K.). This project was funded by the ARC Centre of Excellence for Coral Reef Studies (University of Western Australia and University of Queensland). Funding support was also provided to L.G. from an Australian Government International Postgraduate Research Scholarship (IPRS) Australian Postgraduate Award (APA) scholarship. M.M. was supported by a Western Australian Premier’s fellowship and an ARC Laureate fellowship. M.H. acknowledges support from an ARC Super Science award.
Footnotes
The authors declare no conflict of interest.
This article is a PNAS Direct Submission.
This article contains supporting information online at www.pnas.org/lookup/suppl/doi:10.1073/pnas.1505586112/-/DCSupplemental.
References
- 1.Bopp L, et al. Multiple stressors of ocean ecosystems in the 21st century: Projections with CMIP5 models. Biogeosciences. 2013;10(10):6225–6245. [Google Scholar]
- 2.Hoegh-Guldberg O. Low coral cover in a high-CO2 world. J Geophysic Res Oceans. 2005;110(C9):C09S06. [Google Scholar]
- 3.Ohde S, van Woesik R. Carbon dioxide flux and metabolic processes of a coral reef, Okinawa. Bull Mar Sci. 1999;65(2):559–576. [Google Scholar]
- 4.Hofmann GE, et al. High-frequency dynamics of ocean pH: A multi-ecosystem comparison. PLoS One. 2011;6(12):e28983. doi: 10.1371/journal.pone.0028983. [DOI] [PMC free article] [PubMed] [Google Scholar]
- 5.Dove SG, et al. Future reef decalcification under a business-as-usual CO2 emission scenario. Proc Natl Acad Sci USA. 2013;110(38):15342–15347. doi: 10.1073/pnas.1302701110. [DOI] [PMC free article] [PubMed] [Google Scholar]
- 6.Marker M, et al. OCEANS 2010 IEEE; Sydney: 2010. The coral proto free ocean carbon enrichment system (CP-FOCE): Engineering and development; pp. 1–10. [Google Scholar]
- 7.Kline DI, et al. A short-term in situ CO₂ enrichment experiment on Heron Island (GBR) Sci Rep. 2012;2:413. doi: 10.1038/srep00413. [DOI] [PMC free article] [PubMed] [Google Scholar]
- 8.Gattuso J-P, et al. Free ocean CO2 enrichment (FOCE) systems: Present status and future developments. Biogeosciences. 2014;11:4057–4075. [Google Scholar]
- 9.Kline DI, et al. Six month in situ high-resolution carbonate chemistry and temperature study on a coral reef flat reveals asynchronous pH and temperature anomalies. PLoS One. 2015;10(6):e0127648. doi: 10.1371/journal.pone.0127648. [DOI] [PMC free article] [PubMed] [Google Scholar]
- 10.van Vuuren DP, et al. The representative concentration pathways: An overview. Clim Change. 2011;109(1-2):5–31. [Google Scholar]
- 11.Trotter J, et al. Quantifying the pH ‘vital effect’ in the temperate zooxanthellate coral Cladocora caespitosa: Validation of the boron seawater pH proxy. Earth Planet Sci Lett. 2011;303(3-4):163–173. [Google Scholar]
- 12.McCulloch MT, Falter J, Trotter J, Montagna P. Coral resilience to ocean acidification and global warming through pH up-regulation. Nat Clim Chang. 2012;2(8):623–627. [Google Scholar]
- 13.Al-Horani FA, Al-Moghrabi SM, de Beer D. The mechanism of calcification and its relation to photosynthesis and respiration in the scleractinian coral Galazea fascicularis. Mar Biol. 2003;142(3):419–426. [Google Scholar]
- 14.Cohen AL, McConnaughey TA. Geochemical perspectives on coral mineralization. Rev Mineral Geochem. 2003;54(1):151–187. [Google Scholar]
- 15.Oliver TA, Palumbi SR. Do fluctuating temperature environments elevate coral thermal tolerance? Coral Reefs. 2011;30(2):429–440. [Google Scholar]
- 16.Barshis DJ, et al. Genomic basis for coral resilience to climate change. Proc Natl Acad Sci USA. 2013;110(4):1387–1392. doi: 10.1073/pnas.1210224110. [DOI] [PMC free article] [PubMed] [Google Scholar]
- 17.Palumbi SR, Barshis DJ, Traylor-Knowles N, Bay RA. Mechanisms of reef coral resistance to future climate change. Science. 2014;344(6186):895–898. doi: 10.1126/science.1251336. [DOI] [PubMed] [Google Scholar]
- 18.Holcomb M, et al. Coral calcifying fluid pH dictates response to ocean acidification. Sci Rep. 2014;4:5207. doi: 10.1038/srep05207. [DOI] [PMC free article] [PubMed] [Google Scholar]
- 19.Vengosh A, Chivas AR, Mcculloch MT. Direct determination of boron and chlorine isotopic compositions in geological-materials by negative thermal-ionization mass-spectrometry. Chem Geol. 1989;79(4):333–343. [Google Scholar]
- 20.Hemming NG, Hanson GN. Boron isotopic composition and concentration in modern marine carbonates. Geochim Cosmochim Acta. 1992;56(1):537–543. [Google Scholar]
- 21.Ries JB. A physicochemical framework for interpreting the biological calcification response to CO2-induced ocean acidification. Geochim Cosmochim Acta. 2011;75(14):4053–4064. [Google Scholar]
- 22.Venn A, Tambutté E, Holcomb M, Allemand D, Tambutté S. Live tissue imaging shows reef corals elevate pH under their calcifying tissue relative to seawater. PLoS One. 2011;6(5):e20013. doi: 10.1371/journal.pone.0020013. [DOI] [PMC free article] [PubMed] [Google Scholar]
- 23.Cohen AL, McCorkle DC, de Putron S, Gaetani GA, Rose KA. Morphological and compositional changes in the skeletons of new coral recruits reared in acidified seawater: Insights into the biomineralization response to ocean acidification. Geochem Geophys Geosyst. 2009;10(7):Q07005. [Google Scholar]
- 24.Burton E, Walter L. Relative precipitation rates of aragonite and Mg calcite from seawater:Temperature or carbonate ion control? Geology. 1987;15(2):111–114. [Google Scholar]
- 25.MacKellar MC, McGowan HA, Phinn SR. An observational heat budget analysis of a coral reef, Heron Reef, Great Barrier Reef, Australia. J Geophys Res, D, Atmospheres. 2013;118(6):2547–2559. [Google Scholar]
- 26.Cyronak T, Santos IR, McMahon A, Eyre BD. Carbon cycling hysteresis in permeable carbonate sands over a diel cycle: Implications for ocean acidification. J Limnol Oceanogr. 2013;58(1):131–143. [Google Scholar]
- 27.Tilbrook B, et al. High-Resolution Ocean and Atmosphere pCO2 Time-Series Measurements from Mooring Heron Island 152E_23S. Carbon Dioxide Information Analysis Center ORNL, US Department of Energy; Oak Ridge, TN: 2013. [Google Scholar]
- 28.Schneider K, Levy O, Dubinsky Z, Erez J. In situ diel cycles of photosynthesis and calcification in hermatypic corals. Limnol Oceanogr. 2009;54(6):1995–2002. [Google Scholar]
- 29.Hönisch B, et al. Assessing scleractinian corals as recorders for paleo-pH: Empirical calibration and vital effects. Geochim Cosmochim Acta. 2004;68(18):3675–3685. [Google Scholar]
- 30.Fang LS, Chen YWJ, Chen CS. Why does the white tip of stony coral grow so fast without zooxanthellae? Mar Biol. 1989;103(3):359–363. [Google Scholar]
- 31.Jompa J, McCook LJ. The effects of nutrients and herbivory on competition between a hard coral (Porites cylindrica) and a brown alga (Lobophora variegata) Limnol Oceanogr. 2002;47(2):527–534. [Google Scholar]
- 32.Crook ED, Potts D, Rebolledo-Vieyra M, Hernandez L, Paytan A. Calcifying coral abundance near low-pH springs: Implications for future ocean acidification. Coral Reefs. 2012;31(1):239–245. [Google Scholar]
- 33.Hii Y-S, Ambok Bolong AM, Yang T-T, Liew H-C. Effect of elevated carbon dioxide on two scleractinian corals: Porites cylindrica (Dana, 1846) and Galaxea fascicularis (Linnaeus, 1767) J Mar Biol. 2009;2009:215196. [Google Scholar]
- 34.Suggett DJ, et al. Light availability determines susceptibility of reef building corals to ocean acidification. Coral Reefs. 2013;32(2):327–337. [Google Scholar]
- 35.Allemand D, Tambutté É, Zoccola D, Tambutté S. 2011. Coral Calcification, Cells to Reefs: An Ecosystem in Transition, eds Dubinsky Z, Stambler N (Springer, The Netherlands), pp 119–150.
- 36.Mass T, Drake JL, Peters EC, Jiang W, Falkowski PG. Immunolocalization of skeletal matrix proteins in tissue and mineral of the coral Stylophora pistillata. Proc Natl Acad Sci USA. 2014;111(35):12728–12733. doi: 10.1073/pnas.1408621111. [DOI] [PMC free article] [PubMed] [Google Scholar]
- 37.Edmunds PJ, Brown D, Moriarty V. Interactive effects of ocean acidification and temperature on two scleractinian corals from Moorea, French Polynesia. Glob Change Biol. 2012;18(7):2173–2183. [Google Scholar]
- 38.Venn AA, et al. Impact of seawater acidification on pH at the tissue-skeleton interface and calcification in reef corals. Proc Natl Acad Sci USA. 2013;110(5):1634–1639. doi: 10.1073/pnas.1216153110. [DOI] [PMC free article] [PubMed] [Google Scholar]
- 39.Fabricius KE, et al. Losers and winners in coral reefs acclimatized to elevated carbon dioxide concentrations. Nat Clim Chang. 2011;1(3):165–169. [Google Scholar]
- 40.Crook ED, Cohen AL, Rebolledo-Vieyra M, Hernandez L, Paytan A. Reduced calcification and lack of acclimatization by coral colonies growing in areas of persistent natural acidification. Proc Natl Acad Sci USA. 2013;110(27):11044–11049. doi: 10.1073/pnas.1301589110. [DOI] [PMC free article] [PubMed] [Google Scholar]
- 41.Grottoli AG, Rodrigues LJ, Palardy JE. Heterotrophic plasticity and resilience in bleached corals. Nature. 2006;440(7088):1186–1189. doi: 10.1038/nature04565. [DOI] [PubMed] [Google Scholar]
- 42.Shamberger KEF, et al. Diverse coral communities in naturally acidified waters of a Western Pacific reef. Geophys Res Lett. 2014;41(2):499–504. [Google Scholar]
- 43.Smith LW, Barshis D, Birkeland C. Phenotypic plasticity for skeletal growth, density and calcification of Porites lobata in response to habitat type. Coral Reefs. 2007;26(3):559–567. [Google Scholar]
- 44.Baker AC, Starger CJ, McClanahan TR, Glynn PW. Coral reefs: Corals’ adaptive response to climate change. Nature. 2004;430(7001):741–741. doi: 10.1038/430741a. [DOI] [PubMed] [Google Scholar]
- 45.Smith SV, Buddemeier RW, Redalje RC, Houck JE. Strontium-calcium thermometry in coral skeletons. Science. 1979;204(4391):404–407. doi: 10.1126/science.204.4391.404. [DOI] [PubMed] [Google Scholar]
- 46.Spencer Davies P. Short-term growth measurements of corals using an accurate buoyant weighing technique. Mar Biol. 1989;101(3):389–395. [Google Scholar]
- 47.McCulloch MT, Holcomb M, Rankenburg K, Trotter JA. Rapid, high-precision measurements of boron isotopic compositions in marine carbonates. Rapid Commun Mass Spectrom. 2014;28(24):2704–2712. doi: 10.1002/rcm.7065. [DOI] [PubMed] [Google Scholar]
- 48.Zeebe RE, Wolf-Gladrow DA. 2001. CO2 in Seawater: Equilibrium (Kinetics, Isotopes) CO2 in seawater: Equilibrium (kinetics, isotopes). Elsevier Oceanography Series, eds Richard EZ, Dieter WG (Elsevier, Munich), Vol 65, pp 1–84.
- 49.Foster GL, Pogge von Strandmann PAE, Rae JWB. Boron and magnesium isotopic composition of seawater. Geochem Geophys Geosyst. 2010;11(8):Q08015. [Google Scholar]
- 50.Klochko K, Kaufman AJ, Yao W, Byrne RH, Tossell JA. Experimental measurement of boron isotope fractionation in seawater. Earth Planet Sci Lett. 2006;248(1-2):276–285. [Google Scholar]
- 51.Pierrot DE, Lewis DW, Wallace R. MS Excel Program Developed for CO2 System Calculations. Oak Ridge National Laboratory, US Department of Energy; Oak Ridge, TN: 2006. [Google Scholar]
Associated Data
This section collects any data citations, data availability statements, or supplementary materials included in this article.


