Abstract
Herein, the absorption maximum of bacteriorhodopsin (bR) is calculated using our recently developed method in which the whole protein can be treated quantum mechanically at the level of INDO/S-CIS//ONIOM (B3LYP/6-31G(d,p): AMBER). The full quantum mechanical calculation is shown to reproduce the so-called opsin shift of bR with an error of less than 0.04 eV. We also apply the same calculation for 226 different bR mutants, each of which was constructed by replacing any one of the amino acid residues of the wild-type bR with Gly. This substitution makes it possible to elucidate the extent to which each amino acid contributes to the opsin shift and to estimate the inter-residue synergistic effect. It was found that one of the most important contributions to the opsin shift is the electron transfer from Tyr185 to the chromophore upon excitation. We also indicate that some aromatic (Trp86, Trp182) and polar (Ser141, Thr142) residues, located in the vicinity of the retinal polyene chain and the β-ionone ring, respectively, play an important role in compensating for the large blue-shift induced by both the counterion residues (Asp85, Asp212) and an internal water molecule (W402) located near the Schiff base linkage. In particular, the effect of Trp86 is comparable to that of Tyr185. In addition, Ser141 and Thr142 were found to contribute to an increase in the dipole moment of bR in the excited state. Finally, we provide a complete energy diagram for the opsin shift together with the contribution of the chromophore-protein steric interaction.
Keywords: bacteriorhodopsin, retinal, opsin shift, charge transfer, INDO/S-CIS
Bacteriorhodopsin (bR) from Halobacterium salinarum is a light-driven proton pump that consists of a 26 kDa seven-transmembrane protein (called “opsin”) and an all-trans retinal chromophore covalently bound to Lys216 via a protonated Schiff base linkage1–6. In bR, the chromophore is in a planar 6-s-trans conformation about the C6–C7 single bond. According to recent experimental studies using an electrostatic ion storage ring (ELISA), the absorption maximum (λmax) of a model compound of the chromophore, a 6-s-trans protonated retinylidene Schiff base (PRSB), is 610 nm in the gas phase7. In contrast, the λmax of bR in the light-adapted state is 568 nm; thus, the λmax blue-shifts by ∼42 nm relative to that of the isolated chromophore. Such a shift may be caused by interactions of the chromophore with the surrounding protein environment and hence is referred to as the “opsin shift” 5,8. Although the opsin shift was originally defined as a spectral shift from that in methanol solution (red shift)9, we here use it as the difference from the gas phase result (blue shift).
The cellular membrane of Halobacteria also contains three different retinal proteins other than bR: halorhodopsin (hR), sensory rhodopsin I (sRI) and sensory rhodopsin II (sRII), also called pharaonis phoborhodopsin (ppR). These halobacterial rhodopsins have three-dimensional structures that are highly similar to that of bR, and their chromophores are also in the planar 6-s-trans PRSB. In spite of such structural similarity, the λmax of ppR alone is significantly blue-shifted by approximately 70 nm relative to that of bR, whereas the λmax values of hR and sRI are nearly equal to that of bR. These facts raise the question as to how the absorption maximum is regulated in these rhodopsins.
The elucidation of the origin of the opsin shift has been an important subject in photobiology in recent decades. One important factor contributing to the opsin shift is the counterion effect, which should cause an increase in the bond alternation of the polyene chain and hence, a large blue shift. To estimate the amount of the blue shift, it is necessary to measure the λmax of a PRSB-counterion complex in the gas phase. In our earlier study, we analyzed the solvato-chromic shift of the PRSB-counterin complex (6-s-cis-retinylidenebutylammonium dichloroacetate) in detail, and its λmax in vacuo was estimated to be 407 nm (2.46×104 cm−1, Table 3 of ref. 10). Conversely, the recent ELISA experiment showed that the λmax of the 6-s-cis conformer of PRSB in vacuo is 530 nm7. Thus, the counterion effect is estimated to be 0.71 eV (5.73×103 cm–1). If this value is added to the excitation energy (610 nm = 2.03 eV) of 6-s-trans PRSB in vacuo7, the λmax for the counterion complex of 6-s-trans PRSB is predicted to be 2.73 eV (453 nm). Interestingly, the λmax values of the above four retinal proteins all shift to red compared to this value. This means that the rest of an opsin (excluding the counterions) produces such red shifts that partially counterbalance the effect of the counterions. According to ref. 7, currently, the most challenging issue in the opsin shift study is to identify the physical factor(s) responsible for such a counterbalance, which requires fine spectral tuning of the excitation energy.
To address the above issue, many theoretical studies, including various levels of quantum mechanical approximations5,11–30, have been performed. Usually, the protein of interest is treated as a hybrid system consisting of quantum-mechanical and molecular-mechanical regions (QM/MM), which enables us to investigate the interactions of PRSB (QM region) with its surrounding polar or polarizable amino acid residues at an atomic level. Although these approaches have reasonably reproduced the observed λmax, they have not necessarily succeeded in proposing one unambiguous consensus model for the opsin shift. For example, the CIS/3-21G//QM/MM-MD calculation yielded an opsin shift value of 0.16 eV, which is in good agreement with the experimental value (0.15 eV)15, whereas more sophisticated QM calculations with CASSCF-MRMP//QM/MM and SAC-CI//QM/MM yielded values of 0.70 and 0.93 eV, respectively11,20. One of the origins of such a discrepancy can be ascribed to the difficulty of accurate evaluation of the protein environment effect: QM/MM approaches have some ambiguity concerning how to partition the system into QM and MM regions, and except for a few studies13,19,22, these approaches do not take into account the electronic polarization effect of the protein environment. This effect may be important because the chromophore is buried in a relatively hydrophobic pocket near the extracellular side of the protein:2,6 two tryptophan residues and one tyrosine residue (Trp86, Trp182 and Tyr185) are located in the vicinity of the retinal polyene chain, and Trp138 and Trp189 are near the retinal β-ionone ring (Fig. 1). Therefore, the precise physical origin of the opsin shift is still a challenging open question.
Figure 1.
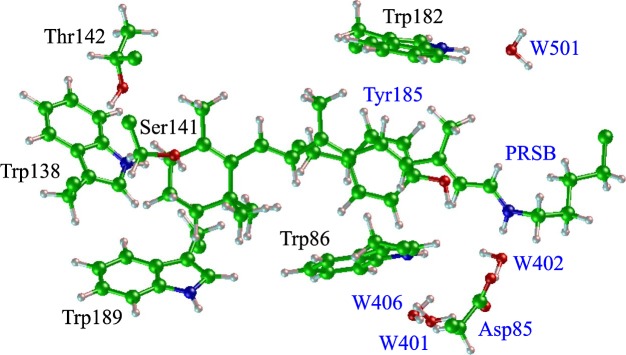
Graphical representation of the chromophore and its surrounding residues in bR. The residues and water molecules labeled with the blue letters are included as the QM region in the ONIOM geometry optimization for model 3.
In our previous paper, we developed a “Full-QM” theoretical approach and successfully applied it to the calculation of the λmax of GFP and its related proteins31. In this approach, the excitation energy calculation using INDO/S-CIS is applied to the whole protein without any truncation of protein atoms. Thus, the procedure of the excited-state calculation is very simple, i.e., it requires no modeling, no division into the QM and MM regions, and no force field assignment, and additionally, no other complicated procedures are needed once an appropriate geometry is obtained for a given protein.
In this study, the above Full-QM approach is applied to the excitation energy calculation of the wild-type bR and its 226 different mutants, which were obtained by replacing amino acid residues of the wild type with Gly one-by-one. From such a comprehensive analysis, we will show that one of the most important residues responsible for the opsin shift is Tyr185. We also indicate that some aromatic (Trp86, Trp182) and polar (Ser141, Thr142) residues located in the vicinity of the retinal polyene chain and the β-ionone ring, respectively, play an important role in compensating for a large blue-shift induced by both the counterion residues (Asp85, Asp212) and an internal water molecule (W402) located near the Schiff base linkage. Finally, we provide a complete energy diagram for the opsin shift together with the contribution arising from the chromophore-protein steric interaction.
Computational details
The initial structure of bR was obtained from the X-ray crystal structure registered as 1C3W in the Protein Data Bank6. 1C3W is missing the atomic coordinates from Thr157 to Ser162, and the data for this fragment were instead obtained from 1IW6. Hydrogen atoms were added using the AmberTools 1.2 and the Reduce 3.13 packages32,33. The ionization states of the following amino acid residues in the vicinity of PRSB were determined according to the previous reports:34,35 Arg82, Asp85, Glu194 and Asp212 were assumed to be ionized. As a result, the total charge of bR studied here was −1.
The geometry optimization including the backbone structure was performed using the two-layer ONIOM (our Own N-layered Integrated molecular Orbital and molecular Mechanics) method with electronic embedding16,36. Then, there is some arbitrariness in the setup of the QM and MM regions. According to a recent theoretical study by Fujimoto et al.20, the entire chromophore, Asp85 (counterion) and its proximal water molecule (W402) should be included in the QM region for a better reproduction of the opsin shift. In addition to these residues, we also included Tyr185 in the QM region because a significant orbital interaction was observed between the chromophore and Tyr 185 from the results of the Full-QM excitation energy calculation (see the Results section). Table 1 lists the three different models used in the ONIOM geometry optimization. The QM residues in model 3 are indicated by the blue letters in Figure 1.
Table 1.
Model systems used in the ONIOM geometry optimization calculations
| Model | QM region |
|---|---|
| 1 | PRSB |
| 2 | PRSB, Y185, D85, W401, W402, W406 |
| 3 | PRSB, Y185, D85, W401, W402, W406, W501 |
In the above ONIOM calculations, the QM region was separated from the remainder of the protein by breaking the Cα-Cβ bond of Lys216 and the C-Cα bonds of the other residues located on the boundary. The QM and MM calculations were performed at the B3LYP/6-31G(d,p) and the AMBER levels of theory, respectively37. The general AMBER force field (GAFF) with improved MM dihedral parameters for the Ramachandran angles and the AM1-BCC charge model were used for the AMBER calculation38–41. Then, the AM1-BCC charges on all atoms of the protein were obtained from the MOZYME calculation with the AM1 Hamiltonian38,39,42. The GAFF/AM1-BCC force fields were generated using the FF-FOM program with MOZYME/AM1 charges43. For the structures obtained, the Full-QM excitation energy calculations were performed at the semiempirical INDO/S-CIS level of theory with standard parameters, and all valence electrons were taken into account44. All the crystallographic water molecules were explicitly taken into account in the excitation energy calculations. The MOZYME and ONIOM calculations were performed using the MO-G and the Gaussian 03/09 program packages, respectively45–47.
To decompose the opsin shift into the contributions from each residue, we also performed Full-INDO/S-CIS calculations for the 226 different bR mutants. Each mutant was generated by removing the side chain atoms of one selected amino acid residue of the wild-type bR and subsequently adding a hydrogen atom along the originally existing Cα-Cβ bond with a bond length of 1.09 Å, while the geometries of other residues were fixed on those of the wild-type bR. Thus, the amino acid residues of bR were replaced by Gly one-by-one.
For the Full-INDO/S-CIS calculation of bR, the number of basis functions and singly excited configuration state functions were 9,545 and 22,429,246, respectively. The calculations were performed using the MO-S (MOS-F) program48,49, in which the direct CIS procedure with the Davidson diagonalization method is implemented50–52. When we used the latest version of the MO-S, it took approximately 3 hours to perform the INDO/S-CIS calculation for bR with a FUJITSU PRIMERGY TX300 S5 server (two Quad-Core Intel Xeon X5570 processors at 2.94 GHz clock rate), and the calculation required approximately 40 GB of temporary disk space and 5.5 GB of memory space. The graphic representations of the MOs, the electron density and the 3D molecular structures were obtained using the XMO V4.0 visualizer53.
Results
Calculated opsin shift and structural factor
Table 2 shows the results of the Full-QM excitation energy calculations for the ONIOM geometries of models 1–3 and that for the chromophore PRSB in vacuo together with the corresponding experimental values. First, we pay attention to the calculated data for the gas-phase chromophore, which was assumed to adopt a 6-s-trans conformation about the C6–C7 bond. Our INDO/S-CIS value (2.11 eV) is larger than the experimental value by 0.08 eV. Next, we compare the results for models 1–3. The calculated excitation energy for model 1 is 2.16 eV, and those for models 2 and 3 are both 2.30 eV, which indicates that water 501 exerts no apparent influence on the excitation energy most likely because it is separated from the chromophore (Fig. 1). The calculated opsin shift is 0.05 eV (= 2.16–2.11) for model 1 and 0.19 eV (= 2.30–2.11) for models 2 and 3. The latter value is closer to the experimental value (0.15 eV). This result implies that the QM region should be as large as possible in the geometry optimization. Hereafter, we will analyze the data for model 3 in detail.
Table 2.
Results of the Full-QM excitation energy calculations at the INDO/S-CIS level and the corresponding experimental data
| Model | λmax/eV | fa | Opsin shift/eV | Δμb/D | Main Conf.c | Locations of MOsd |
|---|---|---|---|---|---|---|
| 1 | 2.16 | 1.23 | +0.05 | 8.04 | H1 → L (0.94) | (PRSB-Y185) → PRSB |
| 2 | 2.30 | 1.40 | +0.19 | 8.02 | H1 → L (−0.74) | (W138-W189) − (PRSB-Y185) → PRSB |
| H2 → L (0.57) | (W138-W189) + (PRSB-Y185) → PRSB | |||||
| 3 | 2.30 | 1.40 | +0.19 | 8.05 | H1 → L (−0.75) | (W138-W189) − (PRSB-Y185) → PRSB |
| H2 → L (0.56) | (W138-W189) + (PRSB-Y185) → PRSB | |||||
| chrom.e | 2.11 | 2.17 | 5.90 | H → L (0.95) | PRSB → PRSB | |
| bR (obsd) | 2.18 | +0.15 | ||||
| chrom. (obsd) | 2.03 |
Oscillator strength.
Dipole moment change upon excitation.
Main configuration with the absolute value of CI coefficient (in parentheses) being >0.3. H: HOMO, L: LUMO, H1: HOMO-1, H2: HOMO-2.
The left-hand side of the arrow is the residues on which H, H1 or H2 is localized. L is localized on PRSB in all cases.
Protonated Schiff base of 6-s-trans-all-trans retinal. The geometry was optimized at the B3LYP/6-31G(d,p) level.
Figure 2 shows the bond length alternation along the polyene chain for the gas-phase PRSB and the chromophore in the model 3 structure. The bond alternation of the latter is significantly larger than that of the former. Then, we picked up only the chromophore from model 3 (referred to as the “bare” chromophore) and calculated its excitation energy. The resultant value was 2.17 eV, which is larger than that of the gas-phase PRSB by 0.06 eV. Because the geometry of the bare chromophore can be regarded as that of the chromophore within the protein, it can be said that this blue shift is caused by the structural modification that occurs upon moving the chromophore from the gas-phase to the protein interior. We will call this shift a “structural factor” in the opsin shift. The origin of the residual part of the opsin shift, 0.13 eV, may be attributed to an interaction between the chromophore and the protein environment.
Figure 2.
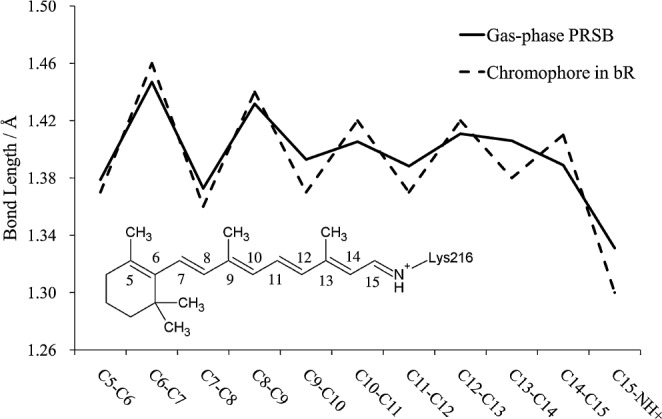
Plot of bond lengths along the polyene chain of PRSB.
For comparison, the excitation energies of model 3 and the gas-phase chromophore were also obtained by the ONIOM (TD-DFT/MM) and ONIOM (CIS/MM) levels of calculations as shown in Table 3, where the B3LYP or CAM-B3LYP54 functional was used for the time-dependent density functional theory (TD-DFT) calculation. These ONIOM calculations all overestimate the excitation energies for both the protein and the gas-phase chromophore, but the opsin shift value obtained using the TD-B3LYP/6-31G(d.p) level of calculation is in good agreement with the experimental value.
Table 3.
Results of the ONIOM excitation energy calculations
| Methoda | Model | λmax/eV | fb | Opsin shift/eV | Δμc/D | Main Conf.d |
|---|---|---|---|---|---|---|
| TD-B3LYP | 3 | 2.54 | 1.51 | +0.14 | 5.11 | H1 → L (0.66) |
| 3′e | 2.53 | 1.50 | +0.13 | 7.11 | H1 → L (0.63) | |
| chrom.f | 2.40 | 2.06 | – | 2.71 | H → L (0.55) | |
| TD-CAM-B3LYP | 3 | 2.86 | 1.29 | +0.40 | 7.34 | H1 → L (0.68) |
| 3′e | 2.80 | 1.66 | +0.34 | 6.89 | H1 → L (0.68) | |
| chrom.f | 2.46 | 2.29 | – | 4.28 | H → L (0.70) | |
| CIS | 3 | 3.31 | 2.39 | +0.33 | 5.01 | H → L (0.63) |
| 3′e | 3.29 | 2.47 | +0.31 | 6.37 | H → L (0.61) | |
| chrom.f | 2.98 | 2.82 | – | 5.41 | H → L (0.66) |
The 6-31G(d,p) basis set was used.
Oscillator strength.
Dipole moment change upon excitation.
Main configuration with the absolute value of CI coefficient (in parentheses) being >0.3. H: HOMO, L: LUMO, H1: HOMO-1.
Trp138 and Trp189 were included in the QM region in addition to that of model 3.
Protonated Schiff base of 6-s-trans-all-trans retinal. Optimized at the B3LYP/6-31G(d,p) level.
Decomposition of the opsin shift into the contribution of each amino acid
At this stage, it is of great interest to determine which residues are the major contributors to the opsin shift. For this purpose, we performed an excitation energy calculation for each of the 226 different bR mutants as described in the methods section. This mutant generation corresponds to “switching-off” the amino acid residues one-by-one. The difference in the calculated excitation energy between the wild-type bR and each mutant is depicted in Figure 3. This difference represents the approximate contribution of each amino acid residue to the opsin shift defined as follows:
| (1) |
where Eex(mutant) and Eex(WT) are the excitation energies of the corresponding mutant and the wild-type bR, respectively.
Figure 3.
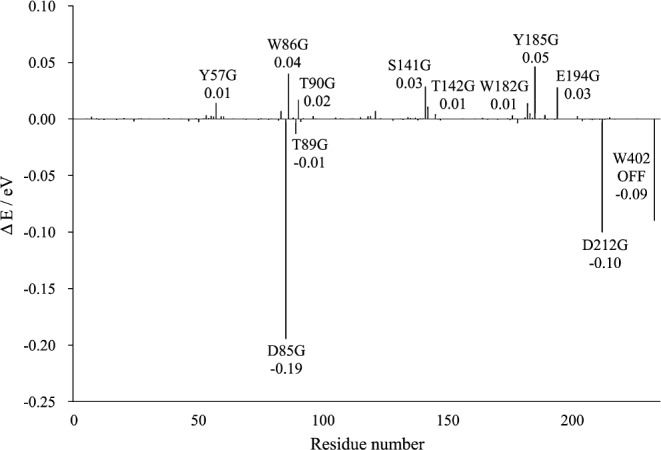
Contribution of each residue or water molecule to the opsin shift. Each ΔE value was obtained by subtracting the excitation energy for the wild-type bR from that for each “Switched-off” mutant. The figure shows only the cases for which the absolute values of ΔE were greater than 0.01 eV.
As expected, the mutations of the counterions (Asp85 and Asp212) and W402, located near the Schiff base linkage, caused large red shifts; in other words, these residues contribute to causing large blue shifts in the wild type bR. And the mutation of deprotonated Glu194 also caused a significant spectral shift. Among the neutral polar residues, Ser141 or Thr142 should be noted; their mutations cause spectral shifts of 0.03 and 0.01 eV, respectively. The reason why these residues make such large contributions is interpreted as follows. Figure 4 (a) shows the light-induced electron distribution changes on the π-conjugate system of the gas-phase PRSB. Interestingly, the positive charges on the Schiff base side are delocalized toward the β-ionone ring upon excitation, which is consistent with previous reports28,55–57. Ser141 and Thr142 are located near the β-ionone ring (Fig. 1) and the negative charges of their side chain OH groups (−0.23 on Ser141 and −0.21 on Thr142, respectively) might promote such a migration through electrostatic interaction, leading to a lowering of the excited state, that is, a red-shift. This mechanism is most likely important for interpreting the red shift of the λmax upon changing from bR to ppR because Ser141 in bR is replaced by Gly130 in ppR. In an earlier model of the opsin shift of bR9, it was hypothesized that in the active site, there is a negative point charge withdrawing the positive charge on the Schiff base nitrogen atom. Ser141 likely corresponds to such a point charge. A detailed analysis of the λmax of ppR is under investigation in our laboratory.
Figure 4.
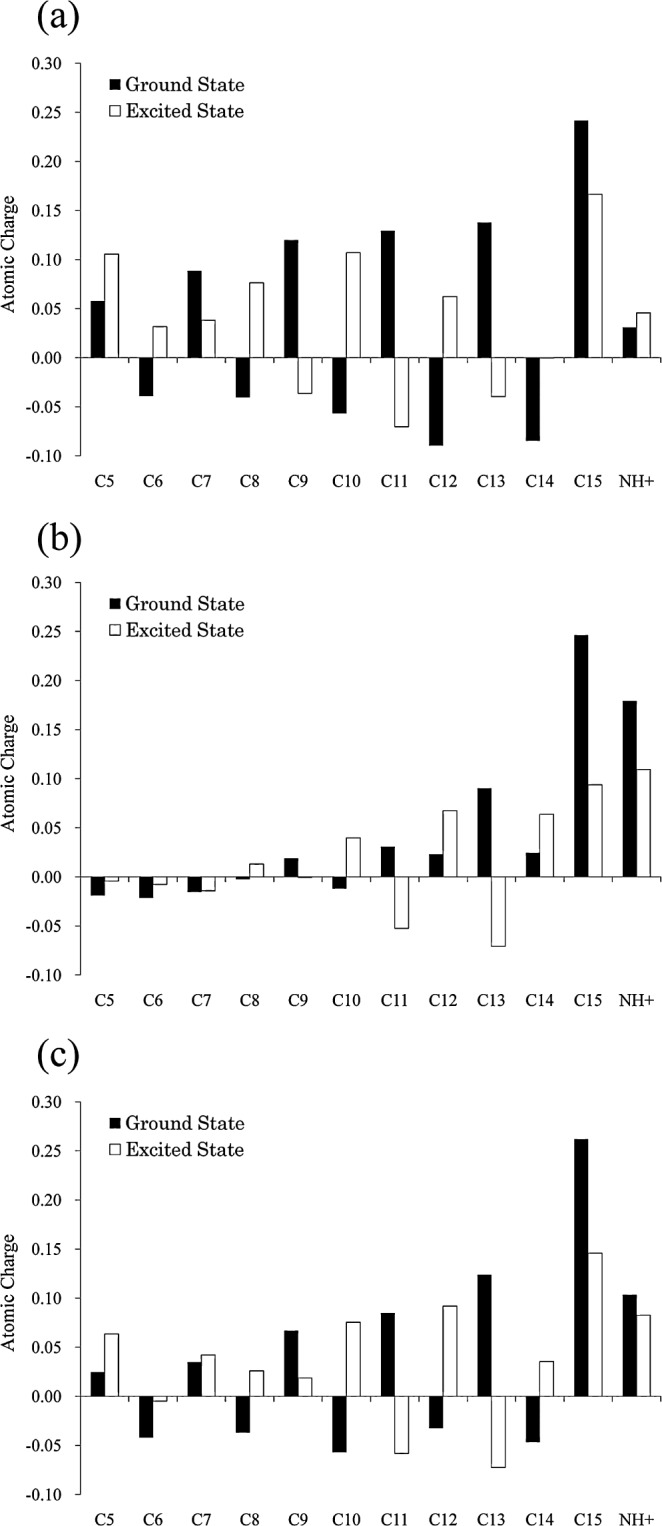
The charge distribution along the retinal polyene chain. Each value of charge corresponds to the sum of the charge on the carbon atom of interest and those on the attached H atoms. (a) The data for the gas-phase PRSB, whose geometry was optimized at the B3LYP/6-31G(d,p) level. (b) The data for the supermolecular complex composed of PRSB and the counterion residues (Asp85, Asp212 and W402). Its geometry was taken from the optimized bR (model 3). (c) The data for PRSB in bR (model 3).
It is worth noting that the shifts induced by the mutations of Tyr185 and Trp86 are considerably large. The results of ultrafast Stark spectroscopy measurements reported that Trp86 exhibits a significant Stark red shift of its absorption band in response to the light-induced charge translocation along the retinal backbone58. This finding is consistent with the present result, indicating that Trp86 provides a larger perturbation of the chromophore’s excitation energy. To explore the origin of the large spectral shift observed for Tyr185, we examined the light-induced charge alteration on each residue (Δρres), which was obtained by subtracting the sum of the atomic charges on a given residue in the ground state from the corresponding value in the excited state of interest (Fig. 5). Interestingly, relatively large positive values of Δρres were obtained for Tyr185, and the Δρres values is 0.032. In other words, the electron densities on the Tyr185 remarkably decrease upon excitation. In contrast, the Δρres value of PRSB is considerably negative (−0.034).
Figure 5.
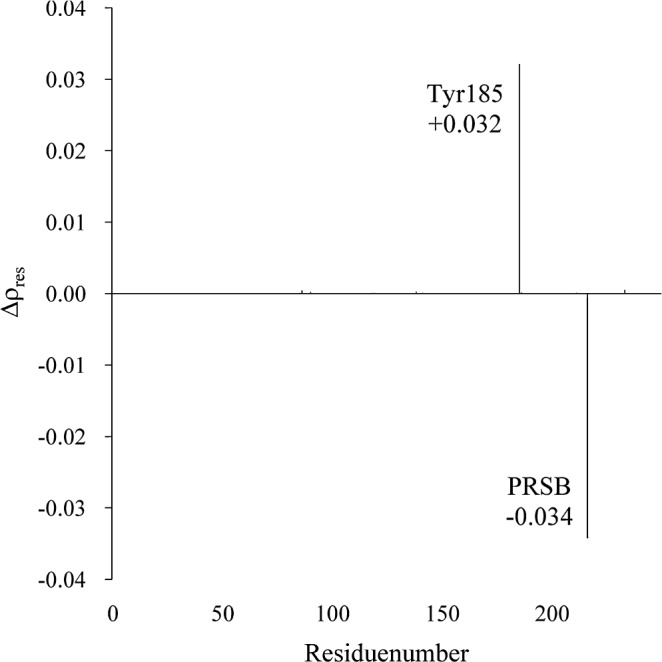
Light-induced charge alternation (Δρres) on each residue of bR.
Figure 6 (a) shows the electron-density difference map for a region including the aforementioned aromatic residues. In this figure, the yellow and green lobes represent regions in which the electron densities increase and decrease upon excitation, respectively. Clearly, upon excitation, electron transfer occurs from Tyr185 to PRSB, especially to the odd-numbered carbon atoms of PRSB. As a consequence, the total atomic charge of PRSB decreased from 0.619 to 0.585.
Figure 6.
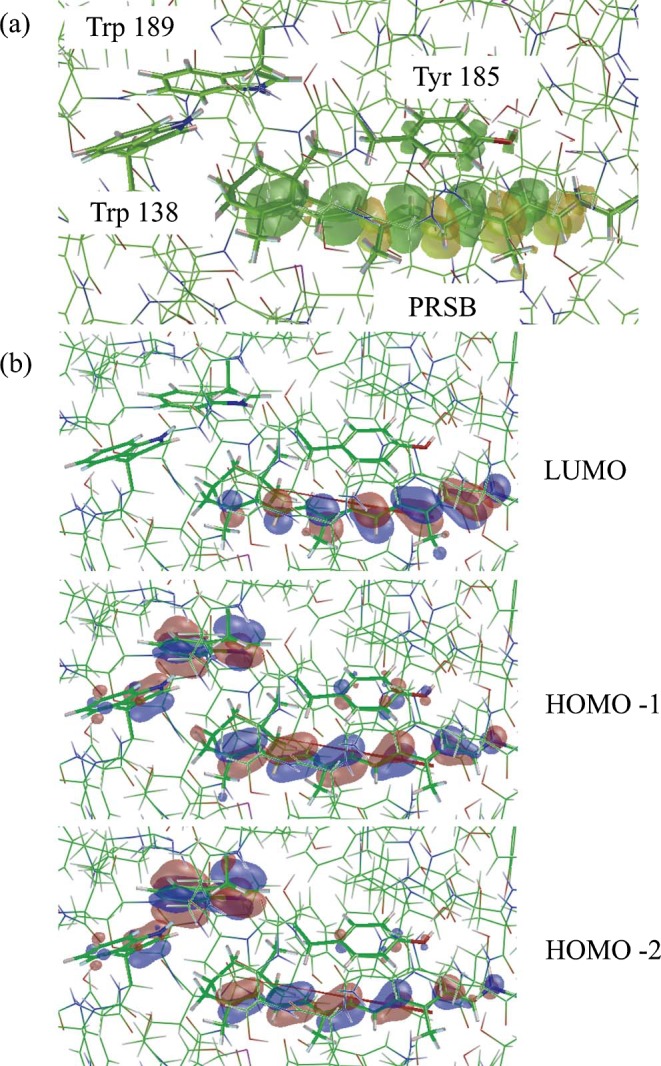
(a) Graphical representation of the electron density difference between the ground state and the excited state responsible for the main absorption band (λmax): an increase in the electron density upon excitation is shown by the yellow lobes and a decrease by the green lobes. (b) The occupied and unoccupied MOs to form the singly excited configurations whose absolute values of the CI coefficients are larger than 0.3. The data were taken from the calculated results for model 3.
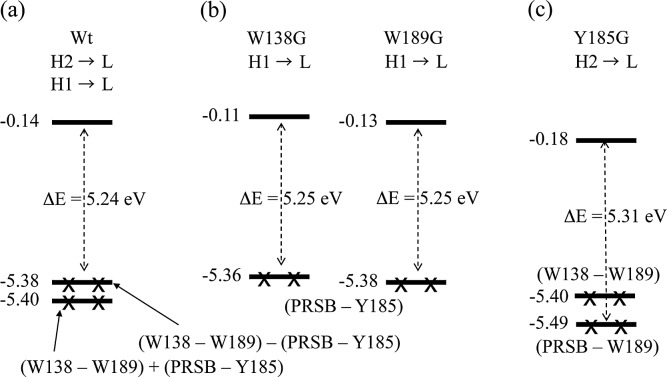
According to the analysis of the CI coefficients, the important excited state configurations were HOMO-1→ LUMO (56%) and HOMO-2→LUMO (32%); thus, we visualized the molecular orbitals of HOMO-2, HOMO-1 and LUMO (Fig. 6 (b)). HOMO-2 and HOMO-1 extend over PRSB, Trp138, Tyr185 and Trp189, whereas the LUMO is localized on PRSB. Unlike the case of Tyr185, the mutation of Trp138 and Trp189 exert no apparent influence on the excitation energy of the protein and, in spite of the wide localization of HOMO-2 and HOMO-1 on Trp138 and Trp189, the electron transfer from these residues were not observed. This is considered in more detail in Figure 7, which shows the schematic representation of the MO diagram of the wild-type bR and the W138G, W189G and Y185G mutants. As described previously, the electronic transition responsible for the main absorption band in the wild-type bR is primarily composed of the HOMO-1 → LUMO and HOMO-2 → LUMO transitions (Table 2). A detailed inspection revealed that HOMO-1 and HOMO-2 are expressed as the out-of-phase and in-phase combinations of the highest occupied MO localized on (PRSB-Y185) and that on (W138-W189), respectively. The energy gaps between HOMO-1 and HOMO-2 are very small (0.02 eV) because the interaction between (PRSB-Y185) and (W138-W189) is very weak. Therefore, the disappearance of (W138-W189) due to the mutation of either of the residues to Gly exerts no apparent influence on the excitation energies. In contrast, the nature of the occupied MOs responsible for the primary absorption band in Y185G is completely altered by the mutation, leading to (PRSP-W189). Thus, Tyr185 perturbs the λmax of bR more strongly than Trp138 and Trp189.
Figure 7.
Schematic representation of the molecular orbital diagram for the excited state responsible for the main absorption band (λmax). (a) the wild-type bR, (b) W138G and W189G, and (c) Y185G. In all the cases, LUMO was localized only on the chromophore PRSB (see Figure 4(b)).
In summary, the amino acid residues are classified into two groups according to their effects on the excitation energy: 1) the aromatic (Tyr185, Trp86, Trp182) and the polar (Ser141, Thr142) residues around the retinal polyene chain and the β-ionone ring decrease the excitation energy (causing a red-shift) and 2) the negatively charged counterion residues (Asp85, Asp212) and the internal water molecule near the Schiff base linkage (W402) increase the excitation energy (causing a blue-shift). The sum of these contributions is positive because the blue-shifting effect is stronger. Therefore, it can be concluded that the proximal aromatic and polar residues play an essential role in quenching the counterion’s blue-shifting activity in the protein.
Discussion
As already described, the light-induced electron distribution changes on the π-conjugate system of the gas-phase PRSB; the positive charges on the Schiff base side are delocalized toward the β-ionone ring upon excitation, leading to a red shift of the absorption maximum. Figure 4 (b) shows the similar data for the supermolecule composed of PRSB and the counterion residues (Asp85, Asp212 and W402). Clearly, the amount of the positive charge delocalization to the β-ionone is smaller than that in the gas phase PRSB, which accounts for the large blue shift induced by the counterion residues (Fig. 3). Interestingly, the positive charge delocalization partially recovers in the bR (Fig. 4 (c)), which means that the rest of an opsin (excluding the counterions) produces red shifts that partially counterbalance the effect of the counterions. As shown in Figure 3, one of the main contributors for the counterbalancing effect is the polar amino acid located near the β-ionone ring such as Ser141 and Thr142. In contrast, there is a possibility that the aromatic residues located along the polyene chain, Tyr185 and Trp86 make a red shift with a different mechanism, including charge transfer and polarization.
The X-ray analysis revealed that, as already shown in Figure 1, the aromatic residues clustered closely around the reactive centers in bR: two tryptophan residues and one tyrosine residue (Trp86, Trp182 and Tyr185) surround the central body of the chromophore, and Trp138 and Trp189 are located near the β-ionone ring. Interestingly, Trp86, Trp182 and Tyr185 were regarded as a triad and are distributed approximately at three of the vertices of a rectangle in each case (Fig. 8). Accordingly, much attention has been paid to the electronic interaction between the chromophore and the triad13,59. In particular, based on careful calculations using our original QM/MM theory with a polarizable MM region, we showed that these residues undergo a large degree of electronic polarization in response to the excitation of the chromophore and contribute to a red-shift of 0.18 eV (obtained from the data for the WT, W86A, Y185A and W189A models in Table 3 of ref. 13). According to the present calculation (Fig. 3), Tyr185 and Trp86 are the top two contributors to the red-shift, whereas the contribution of Trp182 is relatively small. The sum of these contributions is 0.10 eV; hence, our previous QM/MM calculation was likely to overestimate the effect of these three residues. On the other hand, Hoffmann et al. calculated the excitation energy of the glycine mutants in a QM/MM framework, where the protein environment was approximated by point charges60. Their data indicated that the “electrostatic” shift due to the aromatic triad was zero in total (W86G; +0.03, W182G; −0.01, Y185; −0.02 eV). Thus, combining their results and our present ones, it can safely be said that the aromatic triad contributes to the opsin shift through the synergistic effect of polarization, dispersion and charge transfer. As shown in Figure 8, the aromatic ring of Tyr185 lies above the retinal polyene chain in a parallel-stacked manner at a distance of 3.5 Å. This geometrical configuration is thought to allow for a direct π–π interaction between the chromophore and Tyr185. In contrast, the chromophore is flanked by Trp86 and Trp182 with a vertical-stacked configuration. Such a configuration may be rather unfavorable for the direct orbital interaction between the chromophore and these residues, although the through-space polarization effect is expected to work between them.
Figure 8.
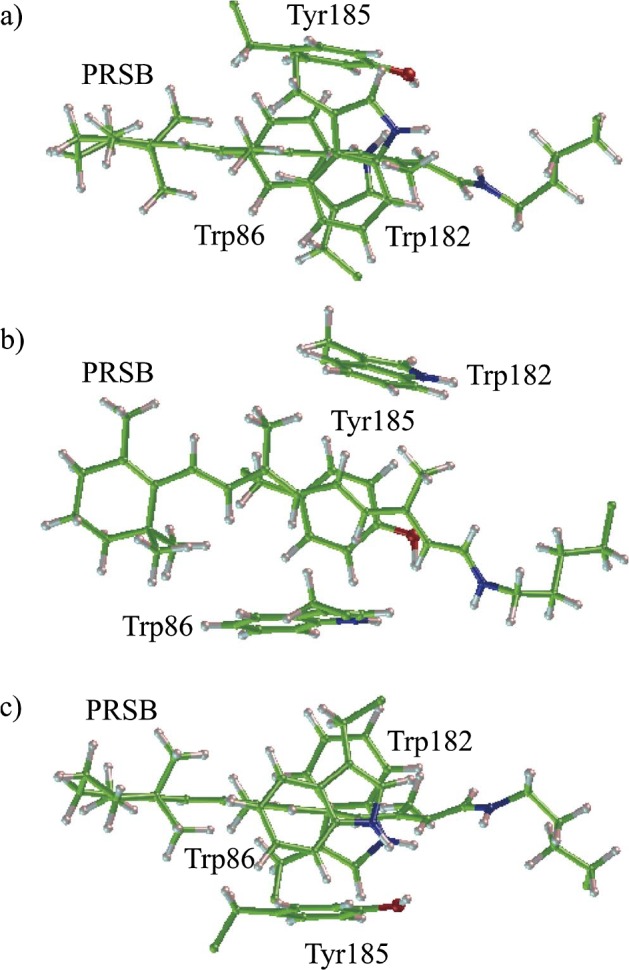
Aromatic triad and PRSB in bR.
The λmax of the Y185F mutant was reported to be 563 and 573 nm in refs. 61 and 62, respectively. These values correspond to opsin shifts of +0.02 and −0.02 eV, respectively. For comparison, we performed the Full-QM calculation for this mutant. The resultant excitation energy was 2.31 eV, corresponding to an opsin shift of +0.01 eV, and a significant amount of charge transfer from Phe185 to PRSB was observed (data not shown). We therefore expect that the experimental data for the non-aromatic mutants at position 185 will be reported in the future to reveal the role of Tyr185 as an electron donor.
Throughout the long history of the theoretical study of the opsin shift of bR, the spectral tuning mechanism has been explained mainly in terms of the electrostatic and/or the polarization effects of opsin. The present study, however, suggested that in addition to these factors, the charge-transfer interaction might be responsible for a more comprehensive understanding of the opsin shift, at least for bR. To the best of our knowledge, there has been no report of the inter-residue charge transfer being induced by an electronic excitation in bR. Of course, careful attention must be paid for the level of theory used when we examine the charge transfer property of excited states. Recently, Gadaczek et al. compared the quality of various excited state calculation methods by examining the distance dependence of the charge transfer between C2H4 and C2F4: as a result, the MSCINDO-sCIS method gave the correct 1/R behavior, but the TD-DFT method failed to give the correct description63. Therefore it is likely that the present study gives the reasonable results for the excited state charge transfer of bR. However, to confirm this, more rigorous ab initio calculations are required.
Conclusion
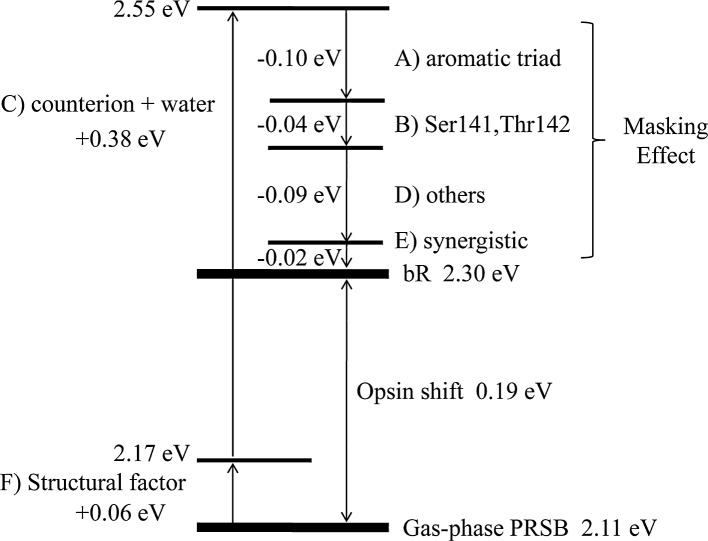
Based on the results of the Full-QM calculations for the wild-type bR and its 226 mutants, we comprehensively analyzed the contributions of nearly all of the amino acid residues to the opsin shift and successfully identified the major contributors. These residues are classified into four groups: A) the aromatic triad (Tyr185, Trp86, Trp182) surrounding the central part of the polyene chain, B) the polar residues (Ser141, Thr142) near the β-ionone ring, C) the negatively charged counterion residues (Asp85, Asp212) and the internal water molecule near the Schiff base linkage (W402), and D) other residues, including Tyr57, Thr89, Thr90 and Glu194 (Fig. 9). Groups A and B contribute to a red-shift, and group C contributes to a blue-shift. Group D includes both types of contributions. Finally, to reproduce the total opsin shift, the following two effects are indispensable: E) inter-residue synergistic effects that cannot be estimated by the “Switched-off” calculations (Fig. 3) and F) the structural factor originating from the geometrical change of the chromophore upon binding to the protein. Figure 8 shows the energy diagram representing the relationship among the contributions A)–F). Clearly, the sum of these contributions is positive because the blue-shift effect of group C is extremely large and is not compensated for by the other factors. Therefore, the λmax of bR appears at the shorter wavelength position relative to that of the gaseous PRSB by 0.19 eV, which agrees well with the experimental data (0.15 eV). The present computational methods are expected to provide invaluable insight into the elucidation of spectral properties of other photoreceptor proteins.
Figure 9.
Energy diagram representing the relationship among the contributions A)–F) to the opsin shift of bR.
References
- 1.Oesterhelt D, Stoeckenius W. Rhodopsin-like protein from the purple membrane of halabacterium halobium. Nat New Biol. 1971;233:149–152. doi: 10.1038/newbio233149a0. [DOI] [PubMed] [Google Scholar]
- 2.Neutze R, Pebay-Peyroula E, Edman K, Royant A, Navarro J, Landau EM. Bacteriorhodopsin: a high-resolution structural view of vectorial proton transport. Biochim Biophys Acta. 2002;1565:144–167. doi: 10.1016/s0005-2736(02)00566-7. [DOI] [PubMed] [Google Scholar]
- 3.Birge RR, Zhang CF. Two-photon double resonance spectroscopy of bacteriorhodopsin. Assignment of the electronic and dipolar properties of the low-lying. J Chem Phys. 1990;92:7178–7195. [Google Scholar]
- 4.Shimono K, Ikeura Y, Sudo Y, Iwamoto M, Kamo N. Environment around the chromophore in pharaonis phobor-hodopsin: mutation analysis of the retinal binding site. Biochim Biophys Acta. 2001;1515:92–100. doi: 10.1016/s0005-2736(01)00394-7. [DOI] [PubMed] [Google Scholar]
- 5.Altun A, Yokoyama S, Morokuma K. Quantum mechanical/molecular mechanical studies on spectral tuning mechanisms of visual pigments and other photoactive proteins. Photochem Photobiol. 2008;84:845–854. doi: 10.1111/j.1751-1097.2008.00308.x. [DOI] [PMC free article] [PubMed] [Google Scholar]
- 6.Luecke H, Schobert B, Richter H-T, Cartailler J-P, Lanyi JK. Structure of bacteriorhodopsin at 1.55 Å resolution. J Mol Biol. 1999;291:899–911. doi: 10.1006/jmbi.1999.3027. [DOI] [PubMed] [Google Scholar]
- 7.Rajput J, Rahbek DB, Andersen LH, Hirshfeld A, Sheves M, Altoè P, Orlandi G, Garavelli M. Probing and modeling the absorption of retinal protein chromophores in vacuo. Angew Chem Int Ed. 2010;49:1790–1793. doi: 10.1002/anie.200905061. [DOI] [PubMed] [Google Scholar]
- 8.Nakanishi K. 11-cis-reetinal, a molecule uniquely suited for vision. Pure & Appl Chem. 1991;63:161–170. [Google Scholar]
- 9.Nakanishi K, Balogh-Nair V, Arnaboldi M, Tsujimoto K, Honig B. An external point-charge model for bacterior-hodopsin to account for its purple color. J Am Chem Soc. 1980;102:7945–7947. [Google Scholar]
- 10.Houjou H, Inoue Y, Sakurai M. Physical origin of the opsin shift of Bacteriorhodopsin. Comprehensive analysis based on medium effect theory of absorption Spectra. J Am Chem Soc. 1998;120:4459–4470. [Google Scholar]
- 11.Hayashi S, Ohmine I. Proton transfer in bacteriorhodopsin: Structure, excitation, IR spectra, and potential energy surface analyses by an ab initio QM/MM Method. J Phys Chem B. 2000;104:10678–10691. [Google Scholar]
- 12.Ren L, Martin CH, Wise KJ, Gillespie NB, Luecke H, Lanyi JK, Spudich JL, Birge RR. Molecular mechanism of spectral tuning in sensory rhodopsin II. Biochemistry. 2001;40:13906–13914. doi: 10.1021/bi0116487. [DOI] [PubMed] [Google Scholar]
- 13.Houjou H, Inoue Y, Sakurai M. Study of the opsin shift of Bacteriorhodopsin: Insight from QM/MM calculations with electronic polarization Effects of the Protein Environment. J Phys Chem B. 2001;105:867–879. [Google Scholar]
- 14.Hayashi S, Tajkhorshid E, Pebay-Peyroula E, Royant A, Landau EM, Navarro J, Schulten K. Structural determinants of spectral tuning in retinal proteins Bacteriorhodopsin vs Sensory Rhodopsin II. J Phys Chem B. 2001;105:10124–10131. [Google Scholar]
- 15.Rajamani R, Gao J. Combined QM/MM study of the opsin shift in bacteriorhodopsin. J Comput Chem. 2002;23:96–105. doi: 10.1002/jcc.1159. [DOI] [PubMed] [Google Scholar]
- 16.Vreven T, Morokuma K. Investigation of the S0 → S1 excitation in bacteriorhodopsin with the ONIOM (MO:MM) hybrid method. Theor Chem Acc. 2003;109:125–132. [Google Scholar]
- 17.Fujimoto K, Hasegawa J, Hayashi S, Kato S, Nakatsuji H. Mechanism of color tuning in retinal protein: SAC-CI and QM/MM study. Chem Phys Lett. 2005;414:239–242. [Google Scholar]
- 18.Wanko M, Hoffmann M, Strodel P, Koslowski A, Thiel W, Neese F, Frauenheim T, Elstner M. Calculating absorption shifts for retinal proteins: computational challenges. J Phys Chem B. 2005;109:3606–3615. doi: 10.1021/jp0463060. [DOI] [PubMed] [Google Scholar]
- 19.Matsuura A, Sato H, Houjou H, Saito S, Hayashi T, Sakurai M. Accurate evaluation of the absorption maxima of retinal proteins based on a hybrid QM/MM method. J Comput Chem. 2006;27:1623–1630. doi: 10.1002/jcc.20432. [DOI] [PubMed] [Google Scholar]
- 20.Fujimoto K, Hayashi S, Hasegawa J, Nakatsuji H. Theoretical studies on the color-tuning mechanism in retinal proteins. J Chem Theory Comput. 2007;3:605–618. doi: 10.1021/ct6002687. [DOI] [PubMed] [Google Scholar]
- 21.Wanko M, Hoffmann M, Frauenheim T, Elstner M. Effect of polarization on the opsin shift in rhodopsins. 1. A combined QM/QM/MM model for bacteriorhodopsin and pharaonis sensory rhodopsin II. J Phys Chem B. 2008;112:11462–11467. doi: 10.1021/jp802408g. [DOI] [PubMed] [Google Scholar]
- 22.Wanko M, Hoffmann M, Frähmcke J, Frauenheim T, Elstner M. Effect of polarization on the opsin shift in rhodopsins. 2. Empirical polarization models for proteins. J Phys Chem B. 2008;112:11468–11478. doi: 10.1021/jp802409k. [DOI] [PubMed] [Google Scholar]
- 23.Yoda M, Houjou H, Inoue Y, Sakurai M. Spectral tuning of photoactive yellow protein. Theoretical and experimental analysis of medium effects on the absorption spectrum of the chromophore. J Phys Chem B. 2001;105:9887–9895. [Google Scholar]
- 24.Schreiber M, Buss V. Origin of the bathochromic shift in the early photointermediates of the rhodopsin visual cycle: A CASSCF/CASPT2 study. Int J Quant. 2003;95:882–889. [Google Scholar]
- 25.Ferré N, Olivucci M. Probing the rhodopsin cavity with reduced retinal models at the CASPT2//CASSCF/AMBER level of theory. J Am Chem Soc. 2003;125:6868–6869. doi: 10.1021/ja035087d. [DOI] [PubMed] [Google Scholar]
- 26.Sakurai M, Sakata K, Saito S, Nakajima S, Inoue Y. Decisive role of electronic polarization of the protein environment in determining the absorption maximum of halorhodopsin. J Am Chem Soc. 2003;125:3108–3112. doi: 10.1021/ja027342k. [DOI] [PubMed] [Google Scholar]
- 27.Schreiber M, Buß V, Sugihara M. Exploring the Opsin shift with ab initio methods: Geometry and counterion effects on the electronic spectrum of retinal. J Chem Phys. 2003;119:12045–12048. [Google Scholar]
- 28.Andruniow T, Ferre N, Olivucci M. Structure, initial excited-state relaxation, and energy storage of rhodopsin resolved at the multiconfigurational perturbation theory level. Proc Natl Acad Sci USA. 2004;101:17908–17913. doi: 10.1073/pnas.0407997101. [DOI] [PMC free article] [PubMed] [Google Scholar]
- 29.Rajamani R, Lin Y-L, Gao J. The opsin shift and mechanism of spectral tuning in rhodopsin. J Comput Chem. 2010;32:854–865. doi: 10.1002/jcc.21663. [DOI] [PMC free article] [PubMed] [Google Scholar]
- 30.Sekharan S, Morokuma K. QM/MM study of the structure, energy storage, and origin of the bathochromic shift in vertebrate and invertebrate bathorhodopsins. J Am Chem Soc. 2011;133:4734–4737. doi: 10.1021/ja200322w. [DOI] [PMC free article] [PubMed] [Google Scholar]
- 31.Matsuura A, Hayashi T, Sato H, Takahashi A, Sakurai M. Theoretical study on the absorption maxima of real GFPs. Chem Phys Lett. 2010;484:324–329. [Google Scholar]
- 32.Case DA, Darden TA, Cheatham TE, III, Simmerling CL, Wang J, Duke RE, Luo R, Walker RC, Zhang W, Merz KM, Roberts B, Wang B, Hayik S, Roitberg A, Seabra G, Kolossvai I, Wong KF, Paesani F, Vanicek J, Liu J, Wu X, Brozell SR, Steinbrecher T, Gohlke H, Cai Q, Ye X, Wang J, Hsieh M-J, Cui G, Roe DR, Mathews DH, Seetin MG, Sagui C, Babin V, Luchko T, Gusarov S, Kovalenko A, Kollman PA. Amber Tools. 2010;1(2) [Google Scholar]
- 33.Word JM, Lovell SC, Richardson JS, Richardson DC. Asparagine and glutamine: using hydrogen atom contacts in the choice of side-chain amide orientation. J Mol Biol. 1999;285:1735–1747. doi: 10.1006/jmbi.1998.2401. [DOI] [PubMed] [Google Scholar]
- 34.Garczarek F, Gerwert K. Functional waters in intraprotein proton transfer monitored by FTIR difference spectroscopy. Nature. 2006;439:109–112. doi: 10.1038/nature04231. [DOI] [PubMed] [Google Scholar]
- 35.Mathias G, Marx D. Structures and spectral signatures of protonated water networks in bacteriorhodopsin. Proc Natl Acad Sci USA. 2007;104:6980–6985. doi: 10.1073/pnas.0609229104. [DOI] [PMC free article] [PubMed] [Google Scholar]
- 36.Vreven T, Byun KS, Dapprich S, Montgomery JA, Morokuma K, Frisch MJ. Combining quantum mechanics methods with molecular mechanics methods in ONIOM. J Chem Theory Comput. 2006;2:815–826. doi: 10.1021/ct050289g. [DOI] [PubMed] [Google Scholar]
- 37.Becke AD. Density-functional thermochemistry. III. The role of exact exchange. J Chem Phys. 1993;93:5648–5652. [Google Scholar]
- 38.Jakalian A, Bush BL, Jack DB, Bayly CI. Fast, efficient generation of high-quality atomic charges. AM1-BCC model: I. Method. J Comput Chem. 2000;21:132–146. doi: 10.1002/jcc.10128. [DOI] [PubMed] [Google Scholar]
- 39.Jakalian A, Jack DB, Bayly CI. Fast, efficient generation of high-quality atomic charges. AM1-BCC model: II. Parameterization and validation. J Comput Chem. 2002;23:1623–1641. doi: 10.1002/jcc.10128. [DOI] [PubMed] [Google Scholar]
- 40.Wang J, Wolf RM, Caldwell JW, Kollman PA, Case DA. Development and testing of a general amber force field. J Comput Chem. 2004;25:1157–1174. doi: 10.1002/jcc.20035. [DOI] [PubMed] [Google Scholar]
- 41.Fujitani H, Matsuura A, Sakai S, Sato H, Tanida Y. High-level ab initio calculations to improve protein backbone dihedral parameters. J Chem Theory Comput. 2009;5:1155–1165. doi: 10.1021/ct8005437. [DOI] [PubMed] [Google Scholar]
- 42.Stewart JJP. Application of localized molecular orbitals to the solution of semiempirical self-consistent field equations. Int J Quant Chem. 1996;58:133–146. [Google Scholar]
- 43.Fujitani H, Tanida Y, Matsuura A. Massively parallel computation of absolute binding free energy with well-equilibrated states. Phys Rev E. 2009;79:1–12. doi: 10.1103/PhysRevE.79.021914. [DOI] [PubMed] [Google Scholar]
- 44.Ridley J, Zerner M. An intermediate neglect of differential overlap technique for spectroscopy: pyrrole and the azines. Theoret Chim Acta (Berl) 1973;32:111–134. [Google Scholar]
- 45.MO-G V1. Fujitsu Ltd; 2008. [Google Scholar]
- 46.Frisch MJ, et al. GAUSSIAN 03 Revision E01. Gaussian Inc; Wallingford CT: 2004. [Google Scholar]
- 47.Frisch MJ, et al. GAUSSIAN 09 Revision B01. Gaussian Inc; Wallingford CT: 2010. [Google Scholar]
- 48.Matsuura A, Hayano T. Development of a Molecular Orbital Package for Spectroscopy (MOS-F) and its Application to Nonlinear Optics. Fujitsu Sci Tech J. 1992;28:402. [Google Scholar]
- 49.Matsuura A. MOS V1. QCPE. 1994. #651.
- 50.Foreman JB, Haed-Gordon M, Pople JA, Frisch MJ. Toward a systematic molecular orbital theory for excited states. J Phys Chem. 1992;96:135–149. [Google Scholar]
- 51.Davidson ER. The Iterative calculation of a few of the lowest eigenvalues and corresponding eigenvectors of large real-symmetric matrices. J Comput Phys. 1975;17:87–94. [Google Scholar]
- 52.Leininger ML, Sherrill CD, Allen WD, Schaefer HF., III Systematic study of selected diagonalization methods for configuration interaction matrices. J Comput Chem. 2001;22:1574–1589. [Google Scholar]
- 53.Hayano T. XMO V4.0 MO visualizer (MOPAC2002 V1) Fujitsu Ltd; Tokyo, Japan: 2001. [Google Scholar]
- 54.Yanai T, Tew D, Handy N. A new hybrid exchange-correlation functional using the Coulomb-attenuating method (CAM-B3LYP) Chem Phys Lett. 2004;393:51–57. [Google Scholar]
- 55.González-Luque R, Garavelli M, Bernardi F, Merchán M, Robb MA, Olivucci M. Computational evidence in favor of a two-state, two-mode model of the retinal chromophore photoisomerization. Proc Natl Acad Sci USA. 2000;97:9379–9384. doi: 10.1073/pnas.97.17.9379. [DOI] [PMC free article] [PubMed] [Google Scholar]
- 56.Muñoz Losa A, Fdez Galván I, Martín ME, Aguilar MA. Solvent effects on the low-lying excited states of a model of retinal. J Phys Chem B. 2006;110:18064–18071. doi: 10.1021/jp057563n. [DOI] [PubMed] [Google Scholar]
- 57.Sun M, Ding Y, Cui G, Liu Y. S1 and S2 excited states of gas-phase Schiff-base retinal chromophores: a time-dependent density functional theoretical investigation. J Phys Chem A. 2007;111:2946–2950. doi: 10.1021/jp0709757. [DOI] [PubMed] [Google Scholar]
- 58.Léonard J, Portuondo-Campa E, Cannizzo A, van Mourik F, van der Zwan G, Tittor J, Haacke S, Chergui M. Functional electric field changes in photoactivated proteins revealed by ultrafast Stark spectroscopy of the Trp residues. Proc Natl Acad Sci USA. 2009;106:7718–7723. doi: 10.1073/pnas.0812877106. [DOI] [PMC free article] [PubMed] [Google Scholar]
- 59.Radding W, Romo T, Phillips GN. Protein-assisted pericyclic reactions: an alternate hypothesis for the action of quantal receptors. Biophys J. 1999;77:2920–2929. doi: 10.1016/S0006-3495(99)77125-0. [DOI] [PMC free article] [PubMed] [Google Scholar]
- 60.Hoffmann M, Wanko M, Strodel P, König PH, Frauenheim T, Schulten K, Thiel W, Tajkhorshid E, Elstner M. Color tuning in rhodopsins: the mechanism for the spectral shift between bacteriorhodopsin and sensory rhodopsin II. J Am Chem Soc. 2006;128:10808–10818. doi: 10.1021/ja062082i. [DOI] [PubMed] [Google Scholar]
- 61.Duňach M, Marti T, Khorana HG, Rothchild KJ. Uv-visible spectroscopy of bacteriorhodopsin mutants: substitution of Arg-82, Asp-85, Tyr-185, and Asp-212 results in abnormal light-dark adaptation. Proc Natl Acad Sci USA. 1990;87:9873–9877. doi: 10.1073/pnas.87.24.9873. [DOI] [PMC free article] [PubMed] [Google Scholar]
- 62.Mogi T, Stern LJ, Hackett NR, Khorana HG. Bacteriorhodopsin mutants containing single tyrosine to phenylalanine substitutions are all active in proton translocation. Proc Natl Acad Sci USA. 1987;84:5595–5599. doi: 10.1073/pnas.84.16.5595. [DOI] [PMC free article] [PubMed] [Google Scholar]
- 63.Gadaczek I, Krause K, Hintze KJ, Bredow T. MSINDO-sCIS: A new method for the calculation of excited states of large molecules. J Chem Theory Comput. 2011;7:3675–3685. doi: 10.1021/ct200595b. [DOI] [PubMed] [Google Scholar]


