Abstract
Adenosine triphosphate (ATP) is a versatile molecule used mainly for energy and a phosphate source. The hydrolysis of γ phosphate initiates the reactions and these reactions almost always start when ATP binds to protein. Therefore, there should be a mechanism to prevent spontaneous hydrolysis reaction and a mechanism to lead ATP to a pure energy source or to a phosphate source. To address these questions, we extensively analyzed the effect of protein to ATP conformation based on the sampling of the ATP solution conformations obtained from molecular dynamics simulation and the sampling of ATP structures bound to protein found in a protein structure database. The comparison revealed mainly the following three points; 1) The ribose ring in ATP molecule, which puckers in many ways in solution, tends to assume either C2′ exo or C2′ endo when it binds to protein. 2) The adenine ring in ATP molecule, which takes open-book motion with the two ring structures, has two distinct structures when ATP binds to protein. 3) The glycosyl-bond and the bond between phosphate and the ribose have unique torsion angles, when ATP binds to protein. The combination of torsion angles found in protein-bound forms is under-represented in ATP molecule in water. These findings suggest that ATP-binding protein exerts forces on ATP molecule to assume a conformation that is rarely found in solution, and that this conformation change should be a trigger for the reactions on ATP molecule.
Keywords: adenosine triphosphate, curvature, database analysis, molecular dynamics simulation, torsion angle
Adenosine triphosphate (ATP) is a widely used molecule in the cell for an energy source1. A textbook example of the use of ATP is a chemical bond formation between two substrates coupled with ATP hydrolysis catalyzed by an enzyme. In this reaction, a phosphoanhydride bond between β and γ phosphate groups is cleaved, and the released energy is used to condense the substrates. The released energy can also be a trigger for alteration of the conformation of protein2. In either case, the remaining adenosine diphosphate (ADP) and the inorganic phosphate are released to water. Some of the reactions yield an inorganic diphosphate by cleaving the bond between α and β phosphate groups3. Other than the reaction to gain energy, ATP is utilized as a source for phosphate group, adenosine monophosphate (AMP) and adenine. These chemical groups are utilized for phosphorylation that transfers the inorganic phosphate to the substrate4, adenylation that transfers AMP to the substrate5, and adenosylation that transfers adenosyl to the substrate6, respectively.
The use of the same ATP molecules in a variety of chemical reactions is evidently based on its versatility in the conformation, but the mechanism for regulating the conformation for distinct functions has not been addressed. The ATP molecule that undertakes a hydrolysis between β and γ phosphate groups, for instance, should block the chemical reaction pathways to phosphorylation, adenylation and others, otherwise the unrelated functions would be carried out. In addition, ATP molecule in water needs to have a certain mechanism to stay away from the chemically reactive situations leading to a spontaneous hydrolysis.
These conjectures can be tested by protein structure database analysis and computer simulation. Accumulation of the coordinate data of ATP bound to the proteins enabled us to obtain ATP conformations on proteins at the variety of functions. Improvements in simulation techniques and computer hardware enable us to sample conformations of ATP in water. Comparisons of these ATP conformations will give us a clue to solidify the conjecture.
Here, we compared the structures of ATP molecules in Protein Data Bank (PDB)7 and those sampled from the molecular dynamics (MD) simulation. We found that the conformation of protein-bound ATP is under-represented in ATP in water, which suggests that ATP molecule should be forced to take a specific conformation on a protein to initiate biological functions.
Methods
Choosing proteins with ATP molecule from PDB
Three-dimensional coordinate data of protein structure with ATP were selected from PDB7. The protein entries with coordinates of ATP were first selected on Het-PDB Navi.8 using “ATP” as a query term. Redundancy in entries was eliminated by grouping the proteins with their sequence identity. The interactions between protein chain and ATP molecule were detected by differences in accessible surface areas of the protein chain when the area was calculated with and without the ATP molecule. We calculated the accessible surface area by the in-house program and the program is now available at http://cib.cf.ocha.ac.jp/bitool/ASA/. The calculation is based on the method of Shrake and Rupley9. Chains with less than 60 amino acid residues were discarded. Classification of proteins by sequence identity was carried out using BLASTClust10. The sequence identity for the classification was set to 25%. From each group, a protein chain with the best resolution was selected as the representative.
Conformation sampling of ATP molecule by molecular dynamics simulation
Molecular dynamics simulation of ATP was performed to sample conformations of ATP in water. The initial structure of ATP was taken from the three-dimensional structure data of Thermus thermophilus D-alanine:D-alanine ligase (PDB ID, 2zdq)11. The ATP numbered 1501 in A chain was used. For the calculation, GROMACS 4.0.412 was used. We employed a standard NPT procedure for the simulation described in the manual of GROMACS. We used the force field for ATP molecule implemented in ffG43a1.rtp file. The file described the parameters for all the atoms of ATP except for methyl hydrogen atoms, which were united to the bonded carbon atoms. A hydrogen atom not described in PDB file was geometrically generated at an allowed position. The geometric center of the ATP molecule was then placed at the center of a cube with 2.7×10⁴ Å3 volume filled with water molecules with periodic boundary condition. By removing water molecule overlapping with ATP, the number of water molecules was settled to 876. After minimizing the energy of the system by steepest decent method and performing molecular dynamics with restraint on ATP in 1 ns, we performed 2 ns simulation of ATP in solvent with 2 fs step size. The temperature was set in 300 K. Cutoff distance of van der Waals and electrostatic interactions was set to 10 Å. We ran ten different sets of the simulation starting with a different random-number seed. From each trajectory file, coordinates of ATP in every 0.1 ps were retrieved and snapshot structures from the latter 1 ns simulation were used for analyses.
Comparison of ATP structures: torsion angle and ring curvature
Conformations of ATP molecules in protein-bound and free forms were compared by torsion angles of bonds and flatness of ring structures.
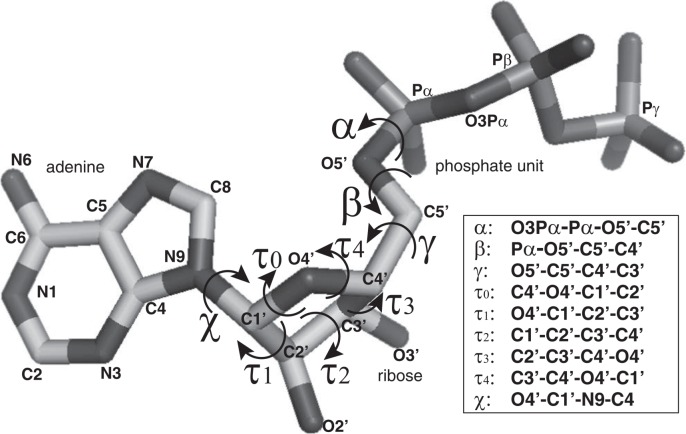
Torsion angles in ATP were defined as shown in Figure 1. The definition is the same as the ones commonly used in DNA and RNA (see Chapter 5 of Schlick T.13, for instance). A torsion angle of a glycosyl bond (C1′-N9), for example, is defined by O4′, C1′, N9 and C4. The cis position of O4′ and C4 is defined as zero degree and the clockwise rotation of the N9-C4 bond viewed in C1′-N9 direction is defined as a positive rotation.
Figure 1.
Definition of the torsion angle for ATP molecule. Each torsion angle is named as shown in the right box. In the box, the torsion angle of the bond by the second and the third atoms is defined by the rotation between the first-second and the third-fourth bonds. cis location of the first and the fourth atoms is defined as zero degree. The order of the atoms also defines the sign of rotation, namely clockwise rotation of the fourth atom against the first atom is defined as a positive rotation. The arrows in the figure depict the positive rotation of the bond.
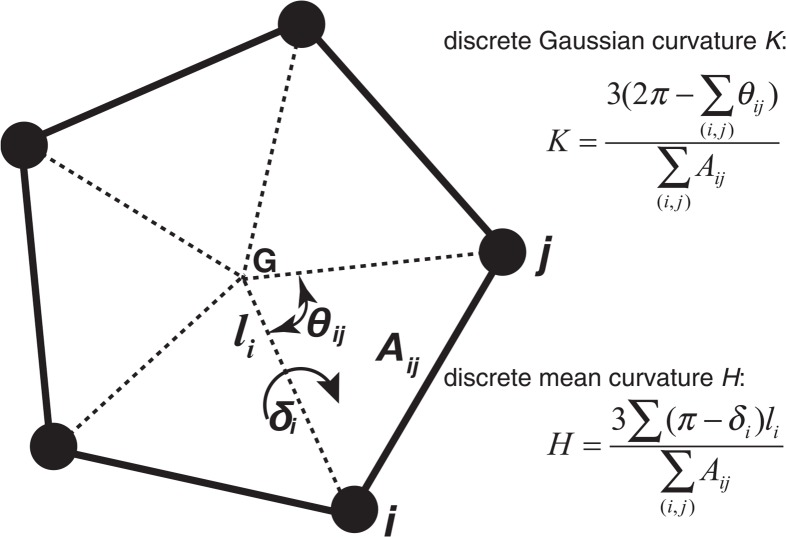
Flatness of the ring structure of ribose and adenine was calculated using discrete Gaussian curvature (K) and mean curvature (H) descriptions (Fig. 2). The Gaussian curvature at a point on a surface is defined as a product of the maximum and minimum curvatures of a plane embedding the normal vector of the point (the principal curvatures), and the mean curvature is defined as a mean of the principal curvatures. With both curvatures, the degree of flatness and of puckering of a ring structure can be described. Here we employed the definition of the discrete Gaussian and mean curvatures described in references 14 and 15. The discrete Gaussian curvature at the gravity center of a ring can be calculated as;
and the discrete mean curvature at the gravity center can be calculated as;
In these calculations, Aij is the area of triangle spanned by atoms i, j and the gravity center of the ring, θij is the angle in radian between the two lines, the line connecting atom i and the gravity center, and the line connecting atom j and the gravity center, δi is the torsion angle in radian between two triangles over the line drawn between atom i and the gravity center, and li is the length of the line drawn between atom i and the gravity center. The subscripts i and j go over all the atoms for the ring14,15. For the curvature calculation of the ribose, namely C1′, C2′, C3′, C4′ and O4′ atoms were used. Curvature calculation for the two ring structures in adenine was done separately. For the curvature calculation of the six-membered ring in the adenine, N1, C2, N3, C4, C5 and C6 atoms were used, and of the five-membered ring, C4, C5, N7, C8, and N9 atoms were used. The relative orientation of the two rings in the adenine was described by the flatness of the pseudo-hexagon consisting of C6, C5, N7, N9, C4 and N3 atoms.
Figure 2.
The definition of the discrete Gaussian and mean curvatures at the gravity center.
Intuitively, the discrete Gaussian curvature measures whether the surface is curved or not, whilst the discrete mean curvature measures the degree of the mixture of the concaveness and convexness. In this analysis, the Gaussian curvature at the gravity center of the ring is always negative. The sign of the mean curvature depends on the strength of concaveness and convexness of the ring structure at the gravity center. Flatness and puckering of the ring can be described by both curvatures through concaveness and convexness.
Results and Discussion
Coordinate set of ATP from PDB
The set of proteins with ATP in PDB is shown in Table 1. There were 188 unique protein-ATP complex. The uniqueness was defined by the sequence identity of the proteins. No proteins in the set have sequence identity more than 25% based on the calculation by BLASTClust10. The biological uniqueness of these proteins was checked based on Uni Prot16 ID. UniProt ID is basically built by protein function abbreviation with a species name abbreviation connected by an underscore. None of the entries in Table 1 has the same protein function based on the UniProt ID.
Table 1.
Functional classification of ATP-binding proteins
| ATP hydrolysis, Pi is released (energy extration reaction) | |||||
| Protein Name | Family | PDB ID | chain | resol | Uniprot ID |
|
| |||||
| vacuolar protein sorting-associating protein 4B | AAA ATPase family | 2zan | A | 3.00 | VPS4B_MOUSE |
| N-ethylmaleide sensitive factor | AAA ATPase family | 1nsf | A | 1.90 | NSF_CRIGR |
| FbpC nucleotide-binding domain | ABC transporter domain | 3fvq | B | 1.90 | FBPC_NEIG1 |
| histidine permease | ABC transporter superfamily | 1b0u | A | 1.50 | HISP_SALTY |
| maltose/maltodextrin transport ATP-binding protein MalK | ABC transporter superfamily | 1q12 | A | 2.60 | MALK_ECOLI |
| ATP-binding cassette sub-family B meber 6 | ABCB family | 3nh9 | A | 2.10 | ABCB6_HUMAN |
| alpha actin 1 | actin family | 2fxu | A | 1.35 | ACTS_RABIT |
| actin-related protein 2 | actin family | 1tyq | B | 2.55 | ARP3_BOVIN |
| arsenical Pump-driving ATPase | arsA ATPase family | 1ii0 | B | 2.40 | ARSA1_ECOLI |
| ATP synthase subunit alpha | ATPase alpha/beta chains family | 2r9v | A | 2.10 | ATPA_THEMA |
| v-type ATP synthase beta chain | ATPase alpha/beta chains family | 3b2q | A | 2.10 | VATB_METMA |
| biotin carboxylase | biotin carboxylation domain | 1dv2 | A | 2.50 | ACCC_ECOLI |
| sarcoplasmic/endoplasmic reticulumn calcium ATPase 1 | cation transport ATPase (P-type) family | 3ar4 | A | 2.15 | AT2A1_RABIT |
| GroEL | chaperonin (HSP60) family | 1kp8 | A | 2.00 | CH60_ECOLI |
| heat shock locus U (HslU) | clpX chaperone family | 1do0 | A | 3.00 | HSLU_ECOLI |
| DNA mismatch repair protein Mlh1 | DNA mismatch repair mutL/hexB family | 3na3 | A | 2.50 | MLH1_HUMAN |
| DNA mismatch repair protein MutS | DNA mismatch repair mutS family | 1w7a | A | 2.27 | MUTS_ECOLI |
| PurL, Formylglycinamide ribonucleotide amidotransferase | FGAMS family | 2hs0 | A | 2.52 | PURL_THEMA |
| Gar synthetase (PurD) | GARS family | 2yw2 | A | 1.80 | PUR2_AQUAE |
| aspartyl/glutamyl-tRNA amidotransferase subunit B | gatB/gatE family | 3h0r | H | 3.00 | GATB_AQUAE |
| 70kDa heat shock cognate protein | heat shock protein 70 family | 1kax | A | 1.70 | HSP7C_BOVIN |
| PcrA DNA helicase | helicase family | 1qhh | B | 2.50 | PCRA_BACST |
| nitrogenase iron protein 1 | nifH/bchL/chlL family | 2c8v | A | 2.50 | NIH1_AZOVI |
| cell division inhibitor MinD | parA family | 3q9l | A | 2.34 | MIND_ECOLI |
| bacterial chromosome segregation protein SoJ | ParAB family | 2bek | A | 1.80 | Q72H90_THET2 |
| 5-formaminoimidazole-4-carboxamide-1-beta-D-ribofuranosyl 5′-monophosphate synthetase | phosphohexose mutase family | 2r7l | A | 2.10 | PURP_METJA |
| phosphoribosylaminoimidazole carboxylase ATPase subunit | purK/purT family | 3eth | A | 1.60 | PURK_ECOLI |
| glycinamide ribonucleotide transformylase (purT) | purK/purT family | 1kj9 | B | 1.60 | PURT_ECOLI |
| Holliday junction DNA helicase RuvB | ruvB family | 1j7k | A | 1.80 | RUVB_THEMA |
| phoshpribosylamidoimidazole-succinocarboxamide synthase | SAICAR synthetase family | 1obd | A | 1.40 | PUR7_YEAST |
| translocase SecA subunit | secA family | 2fsg | B | 2.20 | SECA_ECOLI |
| larget T antigen helicase domain | SF3 helicase domain | 1svm | C | 1.94 | LT_SV40 |
| Psp operon transcriptional activator (PspF) | sigma-54 factor interaction domain | 2c96 | A | 1.80 | PSPF_ECOLI |
| Rad50 ABC-ATPase N-terminal domain | SMC family | 1f2u | A | 1.60 | RAD50_PYRFU |
| sulfiredoxin | sulfiredoxin family | 3cyi | A | 1.80 | SRXN1_HUMAN |
| NTPase P4 (molecular motor) | superfamily 4 helicase motif | 2vhq | A | 2.15 | Q94M05_9VIRU |
| transglutaminase 2 | Transglutaminase family | 3ly6 | A | 3.14 | TGM2_HUMAN |
| EcoR124I restriction enzyme HSDR subunit | typeII restriction enzyme | 2w00 | B | 2.60 | Q304R3_ECOLX |
| UvrABC component UvrB | uvrB family | 1d9z | A | 3.15 | UVRB_BACCA |
| twitching motility protein PilT | not classified | 2eww | A | 3.20 | O66950_AQUAE |
| transcriptional regulatory protein ZraR | not classified | 1ojl | E | 3.00 | ZRAR_SALTY |
| myosin II heavy chain | not classified | 1fmw | A | 2.15 | MYS2_DICDI |
| dethiobiotin synthetase | not classified | 1a82 | A | 1.80 | BIOD_ECOLI |
|
| |||||
| ATP hydrolysis, Pi is transferred (phosphprylation) | |||||
| Protein Name | Family | PDB ID | chain | resol | Uniprot ID |
|
| |||||
| isocitrate dehydrogenase kinase/phosphatase (AceK) | AceK family | 3eps | A | 2.80 | ACEK_ECO57 |
| cAMP-dependent protein kinase | AGC Ser/Thr protein kinase family | 3fjq | E | 1.60 | KAPCA_MOUSE |
| protein kinase C iota type | AGC Ser/Thr protein kinase family: PKC subfamily | 3a8w | B | 2.10 | KPCI_HUMAN |
| G protein coupled receptor kinase 1 (crystals of 6 different states) | AGC Ser/Thr protein kinsae family: GRK kinase family | 3c4w | B | 2.70 | RK_BOVIN |
| myosin heavy chain kinase A | alpha-type protein kinase family | 3lmi | B | 2.20 | MHCKA_DICDI |
| Isopentenyl phosphate kinase | Amino acid kinase family | 3ll5 | C | 1.99 | Q9HLX1_THEAC |
| anti-sigma F factor | anti-sigma-factor family | 1tid | A | 2.50 | SP2AB_BACST |
| ribokinase | carbohydrate kinase pfkB family | 3ikh | A | 1.88 | A6T989_KLEP7 |
| casein kinase-1 | CK1 Ser/Thr protein kinase family | 1csn | A | 2.00 | CKI1_SCHPO |
| dephospho-CoA kinase | coaE family | 1jjv | A | 2.00 | COAE_HAEIN |
| mevalonate kinase | GHMP kinase family | 1kvk | A | 2.40 | KIME_RAT |
| gluconate kinase | gluconokinase gntK/gntV family | 1ko5 | A | 2.28 | GNTK_ECOLI |
| Inositol 1,4,5-triphosphate 3-kinase B | inositol phosphokinase (IPK) family | 2aqx | A | 2.50 | IP3KB_RAT |
| KaiC | kaiC family | 2gbl | A | 2.80 | KAIC_SYNP7 |
| l-seryl-tRNA kinase | L-seryl-tRNA(Sec) kinase family | 3am1 | A | 2.40 | PSTK_METJA |
| NAD kinase | NAD kinase family | 1z0s | A | 1.70 | PPNK_ARCFU |
| nucleotide diphosphate kinase | NDK family | 1wkl | B | 2.20 | NDK_THET8 |
| pyruvate dehydrogenase kinase isoform 2 | PDK/BCKDK protein kinase family | 2bu2 | A | 2.40 | PDK2_HUMAN |
| phosphoenolpyruvate carboxykinase | phosphoenolpyruvate carboxykinase family | 2olr | A | 1.60 | PPCK_ECOLI |
| phosphofruktokinase | phosphofructokinase family | 3o8l | A | 3.20 | K6PF_RABIT |
| phosphoglycerate kinase | phosphoglycerate kinase family | 1vjd | A | 1.90 | PGK1_PIG |
| phosphatidylinositol 3-kinase catalytic subunit | PI3/PI4-kinase family | 1e8x | A | 2.20 | PK3CG_PIG |
| polyhosphate kinase | polyphosphate kinase family | 1xdp | A | 2.50 | PPK_ECOLI |
| Pantothenate kinase | prokaryotic pantothenate kinase family | 2zsf | A | 2.80 | COAA_MYCTU |
| cell division protein kinse 2 | protein kinase superfamily | 2cch | A | 1.70 | CDK2_HUMAN |
| pyridoxine kinase | pyridoxine kinase family | 2ddo | A | 2.60 | PDXK_ECOLI |
| pyruvate kinase | pyruvate kinase family | 1a49 | A | 2.10 | KPYM_RABIT |
| Rio1 serine kinase | RIO-type Ser/Thr kinase family | 1zp9 | A | 2.00 | RIO1_ARCFU |
| Rio2 serine kinase | RIO-type Ser/Thr kinase family | 1zao | A | 1.84 | RIO2_ARCFU |
| mitotic checkpoint serine/threonin-protein kinase Bub1 | Ser/Thr protein kinase family | 3e7e | A | 2.31 | BUB1_HUMAN |
| SR protein kinase | Ser/Thr protein kinase family | 1q97 | A | 2.30 | SKY1_YEAST |
| shikimate kinase | shikimate kinase family | 2iyw | A | 1.85 | AROK_MYCTU |
| Tao2 kinase domain | STE20 subfamily | 1u5r | A | 2.10 | TAOK2_RAT |
| thymidylate kinase | thymidylate kinase family | 1e2q | A | 1.70 | KTHY_HUMAN |
| thiazole kinase | Thz kinase family | 1esq | C | 2.50 | THIM_BACSU |
| MET receptor tyrosine kinase | Tyr protein kinase family | 3dkc | A | 1.52 | A1L467_HUMAN |
| phosphofruktokinase | not classified | 3f5m | B | 2.70 | O15648_9TRYP |
| D-alanine-D-alanine ligase | not classified | 2zdq | A | 2.30 | Q5SHZ3_THET8 |
| chloramphenicol phosphotransferase | not classified | 1qhx | A | 2.50 | CPT_STRVL |
| aminoglycoside phosphotransferase | not classified | 3hav | B | 2.45 | Q9EVD7_ENTFC |
| Thiamine monophosphate kinase | not classified | 3c9r | A | 2.30 | O67883_AQUAE |
| UMP kinase | not classified | 2jjx | A | 2.82 | Q81S73_BACAN |
|
| |||||
| ATP hydrolysis, PPi is released (energy extration reaction) | |||||
| Protein Name | Family | PDB ID | chain | resol | Uniprot ID |
|
| |||||
| adenylate cyclase type 5 | adenylyl cyclase class-4/guanylyl cyclase family | 3c16 | A | 2.87 | ADCY5_CANFA |
| argininosuccinate synthetase | argininosuccinate synthase family | 1kp3 | A | 2.00 | ASSY_ECOLI |
| beta-lactam synthetase | asparagine synthetase family | 1mb9 | B | 2.11 | BLS_STRCL |
| Acyl-coenzyme A synthetase Acsm2A | ATP-dependent AMP-binding enzyme | 3c5e | A | 1.60 | ACS2A_HUMAN |
| D-alanine-polyphosphoribitol ligase subunit 1 | ATP-dependent AMP-binding enzyme family | 3fce | A | 1.90 | DLTA_BACCR |
| DNA ligase from bacteriophage T7 | ATP-dependent DNA ligase family | 1a0i | A | 2.60 | DNLI_BPT7 |
| tryptophan-tRNA synthetase | class-I aminoacyl-tRNA synthetase familiy | 1mau | A | 2.15 | SYW_BACST |
| glutamyl-tRNA synthetase | class-I aminoacyl-tRNA synthetase familiy | 1j09 | A | 1.80 | SYE_THET8 |
| glutaminyl-tRNA synthetase | class-I aminoacyl-tRNA synthetase family | 1gtr | A | 2.50 | SYQ_ECOLI |
| tyrosine-tRNA synthetase | class-I aminoacyl-tRNA synthetase family | 1h3e | A | 2.90 | SYY_THETH |
| tryptophanyl-tRNA synthetase | class-I aminoacyl-tRNA synthetase family | 2qui | A | 2.40 | SYWC_HUMAN |
| histidyl-tRNA synthetase | class-II aminoacyl-tRNA synthetase familiy | 1kmn | C | 2.80 | SYH_ECOLI |
| prolyl-tRNA synthetase | class-II aminoacyl-tRNA synthetase family | 2i4o | A | 2.40 | SYP_RHOPA |
| Class II AARS homologue (bll0957) | class-II aminoacyl-tRNA synthetase family | 3mey | A | 2.50 | Q89VT8_BRAJA |
| Lysyl-tRNA synthetase | class-II aminoacyl-tRNA synthetase family | 3bju | A | 2.31 | SYK_HUMAN |
| glycyl-tRNA synthetase | class-II aminoacyl-tRNA synthetase family | 2zt7 | A | 2.70 | SYG_HUMAN |
| pyrrolysyl-tRNA synthetase | class-II aminoacyl-tRNA synthetase family | 2q7g | A | 1.90 | PYLS_METMA |
| aspartyl-tRNA synthetase | class-II aminoacyl-tRNA synthetase family | 3nem | B | 1.89 | SYD_PYRKO |
| Threonyl-tRNA synthetase | class-II aminoacyl-tRNA synthetase family | 1nyr | A | 2.80 | SYT_STAAW |
| alanyl-tRNA synthetase | class-II aminoacyl-tRNA synthetase family | 1yfr | A | 2.15 | SYA_AQUAE |
| serryl-tRNA synthetase | class-II aminoacyl-tRNA synthetase family | 3lss | B | 1.95 | Q384V4_9TRYP |
| tRNA-lysidine synthase | tRNA(Ile)-lysidine synthase family | 2e89 | A | 2.50 | TILS_AQUAE |
| prolyl-tRNA synthetase | not classified | 2j3m | B | 2.30 | Q831W7_ENTFA |
| serryl-tRNA synthetase | not classified | 2cja | B | 2.20 | Q46AN5_METBA |
| NH3-dependent NAD+ synthetase | NAD synthetase family | 1xng | B | 1.70 | NADE_HELPY |
| bacteriophage phi 6 RNA dependent RNA polymerase | Polymerase family | 1hi1 | A | 3.00 | RDRP_BPPH6 |
| tRNA CCA-pyrophosphorylase | tRNA nucleotidyltransferase/poly(A) polymerase family | 3h39 | B | 2.85 | Q9WZH4_THEMA |
| polyA polymerase | tRNA nucleotidyltransferase/poly(A) polymerase family | 3aqn | A | 3.30 | C9QS13_ECOD1 |
| RNA editing ligase Mp52 | not classified | 1xdn | A | 1.20 | RLGM1_TRYBB |
|
| |||||
| ATP hydrolysis, PPi is released and AMP is transferred (adenylation) | |||||
| Protein Name | Family | PDB ID | chain | resol | Uniprot ID |
|
| |||||
| nicotinamide mononucleotide (NMN) adenylyltransferase | archaeal NMN adenylyltransferase family | 1f9a | A | 2.00 | NADM_METJA |
| phosphopantetheine adenylyltransferase | bacterial coaD family | 1gn8 | A | 1.83 | COAD_ECOLI |
| glucose-1-phosphate adenylyltransferase small | bacterial/plant glucose-1-phosphate | 1yp3 | C | 2.60 | GLGS_SOLTU |
| subunit | adenylyltransferase family | ||||
| DNA polymerase IV | DNA polymerase type-Y family | 3m9o | B | 2.00 | DPO42_SULSO |
| adenylyltransferase ThiF | hesA/moeB/thiF family | 1zfn | A | 2.75 | THIF_ECOLI |
| lipoate-protein ligase A | lplA family | 2aru | A | 2.50 | LPLA_THEAC |
| nicotinate-nucleotide adenylyltransferase | nadD family | 1yun | A | 2.00 | NADD_PSEAE |
| pantoate-beta-alanine ligase | pantothenate synthetase family | 2a84 | A | 1.55 | PANC_MYCTU |
| polyA polymerase | poly(A) polymerase family | 2q66 | A | 1.80 | PAP_YEAST |
| tRNA CCA-pyrophosphrylase | tRNA nucleotidyltransferase/poly(A) polymerase family | 3ovb | A | 1.95 | CCA_ARCFU |
| ubiquitin-activating enzyme E1C (Uba3) | ubiquitin-activating E1 family | 1r4n | B | 3.60 | UBA3_HUMAN |
| ubiquitin-like 2 activating enzyme E1B | ubiquitin-activating E1 family | 1y8q | D | 2.25 | ULE1B_HUMAN |
| ubiquitin-like modifier-activating enzyme 5 | ubiquitin-activating E1 family | 3h8v | A | 2.00 | UBA5_HUMAN |
| biotin protien ligase | not classified | 2dto | A | 1.50 | O57883_PYRHO |
| FMN adenylyltransferase | not classified | 3g59 | A | 1.87 | Q6FNA9_CANGA |
|
| |||||
| ATP hydrolysis, PPPi is relased and adenosine is transferred (adenosylation) | |||||
| Protein Name | Family | PDB ID | chain | resol | Uniprot ID |
|
| |||||
| methionine adenosyltransferase | AdoMet synthse family | 1o9t | A | 2.90 | METK1_RAT |
| CoB(I)alamin adenosyltransferase | Cob(I)alamin adenosyltransferase family | 1g5t | A | 1.80 | BTUR_SALTY |
| CoB(I)yrinic acid A,C-diamide adenosyltransferase | Cob(I)alamin adenosyltransferase family | 2idx | A | 2.50 | MMAB_HUMAN |
|
| |||||
| Others | |||||
| Protein Name | Family | PDB ID | chain | resol | Uniprot ID |
|
| |||||
| 7,8-dihydro-6-hydroxymethylpterin-pyrophosphokinase | HPPK family | 1dy3 | A | 2.00 | HPPK_ECOLI |
| Preneck appendage protein | not classified | 3gqn | A | 2.15 | B3VMP8_BPPH2 |
| ATPsynthase epsilon subunit | ATPase epsilon chain family | 2e5y | A | 1.92 | ATPE_BACP3 |
| Eukaryotic peptide chain release factor subunit 1 | eukaryotic release factor 1 family | 3e1y | A | 3.80 | ERF1_HUMAN |
| prabable ATP-dependent RNA helicase Ddx58 | helicase family | 3lrr | A | 2.15 | DDX58_HUMAN |
| NAD-dependent malic enzyme | malic enzymes family | 1gz4 | A | 2.20 | MAOM_HUMAN |
| DCP2 protein | Nudix hydrolase family | 2qkm | B | 2.80 | DCP2_SCHPO |
| acetylglutamate kinase-like protein | P(II) protein family | 2rd5 | D | 2.51 | GLNB_ARATH |
| STRADalpha | STE Ser/Thr protein kinase family | 3gni | B | 2.35 | STRAA_HUMAN |
| redox-sensing transcriptional repressor Rex | transcriptional regulatory rex family | 2vt3 | B | 2.00 | REX_BACSU |
| transient receptor potential cation channel subfamily V member 1 | transient receptor | 2pnn | A | 2.70 | TRPV1_RAT |
| polyhedrin | not classified | 2oh5 | A | 1.98 | O10693_CPVBM |
| pertussis toxin subunit 4 | not classified | 1bcp | E | 2.70 | TOX4_BORPE |
| non-biological protein | not classified | 2p09 | A | 1.65 | — |
| 5′-AMP-activated protein kinase catalytic subunit alpha-1 | 5′-AMP-activated protein kinase gamma subunit family | 2v92 | E | 2.40 | AAKG1_RAT |
| apoptosis regulator Ced4 | AAA+ family/CARD domain/NB-ARC domain | 2a5y | B | 2.60 | CED4_CAEEL |
| Clp1(inactive form) | Clp1 family | 2npi | A | 2.95 | CLP1_YEAST |
| Rck dmain of YuaA protein | ktrA potassium transport (TC 2.A.38.4) family | 2hmu | A | 2.25 | KTRA_BACSU |
| nitrogen regulatory protein P-II | P(II) protein family | 2xbp | A | 1.20 | GLNB_SYNE7 |
| O-sialoglycoprotien endopeptidase (probably miss annotation, in reality, AP endonuclease) | peptidase M22 family | 2ivp | A | 2.50 | GCP_PYRAB |
| Rat synapsin I | synapsin family | 1pk8 | A | 2.10 | SYN1_RAT |
| putative uncharacterized protein TTHA0350 | not classified | 3ab8 | A | 1.70 | Q5SLE3_THET8 |
| phosphofruktokinase | not classified | 3opy | B | 3.05 | Q8TGA0_PICPA |
| chloride channel protein 5 (clc-5) | chloride channel family | 2j9l | C | 2.30 | CLCN5_HUMAN |
| gluconate kinase | FGGY kinase family | 3ll3 | A | 2.00 | Q5FM28_LACAC |
| Hypothetical protein YfbG | fmt family/ sugar epimerase familiy | 1z7e | D | 3.00 | ARNA_ECOLI |
| ATP-dependent molecular chaperone Hsp82 | heat shock protein 90 family | 2cg9 | B | 3.10 | HSP82_YEAST |
| DNA packaging protein Gp17 | myoviridae large terminase family | 2o0h | A | 1.88 | TERL_BPT4 |
| AP4a hydrolase | Nudix hydrolase family | 2pq1 | A | 1.95 | O66548_AQUAE |
| aspartate carbamoyltransferase regulatory chain (PyrI) | PyrI family | 2yww | B | 2.00 | PYRI_METJA |
| ribonucleotide reductase R1 | ribonucleoside diphosphate reductase large chain family | 3r1r | A | 3.00 | RIR1_ECOLI |
| SMC protein | SMC family | 1xex | A | 2.50 | SMC_METJA |
| molybdenum storage protein subunit alpha | UMP kinase family | 2ogx | A | 1.60 | MOSA_AZOVD |
| uncharacterized protein | universal stress protein A family | 3cis | G | 2.90 | O06189_MYCTU |
| Actin-depolymerizing factor Brevin | villin/gelsolin family | 2fgh | A | 2.80 | GELS_HORSE |
| ethanolamine utilization protein EutJ | not classified | 3h1q | A | 2.80 | — |
| universal stress protein F | not classified | 3fdx | A | 1.58 | A6T8F5_KLEP7 |
| alcaligin biosynthesis protein | not classified | 2x0q | A | 1.96 | P94255_BORBR |
| l-proline dehydrogenase alpha subunit | not classified | 1y56 | A | 2.86 | O59088_PYRHO |
| FtsA | not classified | 1e4g | T | 2.60 | Q9WZU0_THEMA |
| NTRC-like two-domain protein | not classified | 3fkq | A | 2.10 | — |
| hemerythrin-like domain protein DcrH | not classified | 3a8t | A | 2.37 | Q9REU3_DESVU |
| Protein Mj1225 | not classified | 3lfz | A | 2.20 | Y1225_METJA |
| pyridoxal kinase | not classified | 3ibq | A | 2.00 | Q88YB5_LACPL |
| ATP:CoB(I)alamin adenosyltransferase | not classified | 2zhz | A | 1.80 | Q2SZ09_BURTA |
| clbalamin adenosyltransferase PduO-like protein | not classified | 3gah | A | 1.17 | Q50EJ2_LACRE |
| putative ribokinase II | not classified | 3iq0 | B | 1.79 | Q8FD38_ECOL6 |
| Universal stress protein family | not classified | 2z08 | A | 1.55 | Q5SJV7_THET8 |
| phosphofruktokinase | not classified | 3ie7 | A | 1.60 | Q929S5_LISIN |
| achromobactin synthetase protein D (ACSD) | not classified | 2x3j | A | 2.00 | Q93AT8_ERWCH |
| MccB | not classified | 3h5n | A | 1.90 | Q47506_ECOLX |
| HipA | not classified | 3dnt | B | 1.66 | HIPA_ECOLI |
| pyruvate carboxylase | not classified | 3bg5 | A | 2.80 | Q99UY8_STAAM |
| probable ATP-dependent DNA ligase D | not classified | 2faq | A | 1.90 | Q9I1X7_PSEAE |
| ParA ATPase | not classified | 3ea0 | B | 2.20 | Q8KF94_CHLTE |
| small nucleolar RNP similar to Gar1 | not classified | 2hvy | B | 2.30 | Q8U029_PYRFU |
We checked through the literatures of all these data for the biological function of ATP molecules and tabulated them based on the function. We found that 43 were for energy extraction through Pi hydrolysis, 42 for phosphorylation, 29 for energy extraction through PPi hydrolysis, 15 for adenylation, 3 for adenosylation and the remaining 56 were miscellaneous or function unknown (Table 1).
Molecular dynamics simulation of ATP in solvent
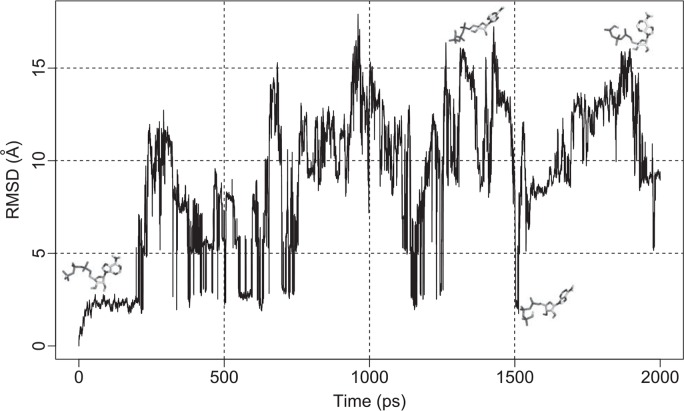
One of the results for 2 ns ATP simulations is shown in Figure 3. For the first 200 ps, the structure of ATP molecule seemed to oscillate amongst a limited number of conformations, but after that the molecule assumed many types of conformations. The behaviour in detail was different in different runs of simulation (Supplementary Figs. 1A–I), but the overall tendency and the scale of fluctuation were quite similar. For the analyses hereafter, we used all the conformations obtained in the latter 1 ns of ten runs, namely 100,000 samples of the conformations.
Figure 3.
Root mean square deviation (RMSD) of ATP during the simulation. The calculation was done between the initial structure and structures of every 0.1 ps. All 36 atoms including hydrogen atoms were used in the calculation. Four snap shot structures were drawn in the graph. From left to right, conformations of 0 ps, 1,437 ps, 1,513 ps and 1,899 ps. This graph and the following ones were drawn by R21 except Figure 9.
Sufficiency of conformation sampling in this set of simulations is important in the following analyses. Figure 3 and Supplementary Figure 1 showed that, after 1 ns of simulation, ATP molecule underwent a compact and an extended conformations for a couple of times. These back-and-forth trajectories suggest that ATP molecule assumed quite a number of different conformations. In the following analyses, the analysis applied on conformations from each trajectory and the one applied to all as a whole did not show significant differences with a minor exception. This behaviour of the data suggests that the reasonable number of conformations was obtained in the ten runs of 2 ns simulation.
Comparison of ribose conformations
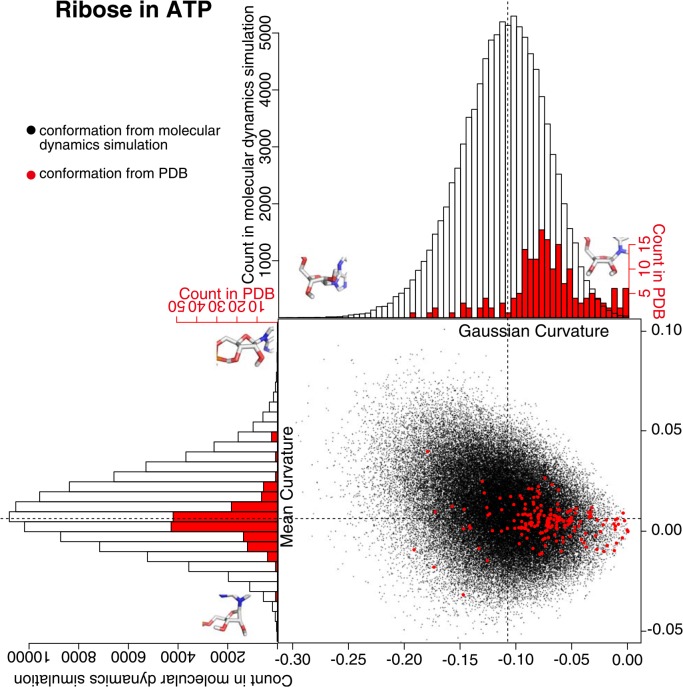
Curvature of ribose in ATP had different distributions between the one calculated from the snapshot conformation in MD simulation and the one from PDB data (Fig. 4). The Gaussian curvature of the ribose from MD simulation had normal-like distribution around −0.11 and the mean curvature had normal-like distribution around 0.02. This behaviour was almost the same in each trajectory of ten runs (Supplementary Fig. 2). The distribution of the mean curvature of the ribose from PDB was more or less the same as the distribution from MD simulation, but the distribution of the Gaussian curvature of the ribose from PDB was not in the normal form and about 70% of them lay between −0.10 and −0.05. The value of the Gaussian curvature is always negative by definition, and when the value is close to zero, the ring structure is close to a flat structure. Therefore, the comparison of the structures above suggests that the ribose in ATP is off the plane when it exists in water, but is restricted to relatively planar structure when bound to a protein. This difference is not that obvious when the structures are compared in torsion angles of the ribose ring.
Figure 4.
Ribose curvature in the conformations from molecular dynamics simulation and from PDB. A black dot is obtained from the snap shot conformation form the molecular dynamics simulation, and a red dot is from PDB. The histogram in black clarifies the distribution of black dots, and the one in red clarifies the distribution of red dots. The ribose with minimum/maximum curvature values in the snap shot conformations from the molecular dynamics simulation were drawn on the histograms.
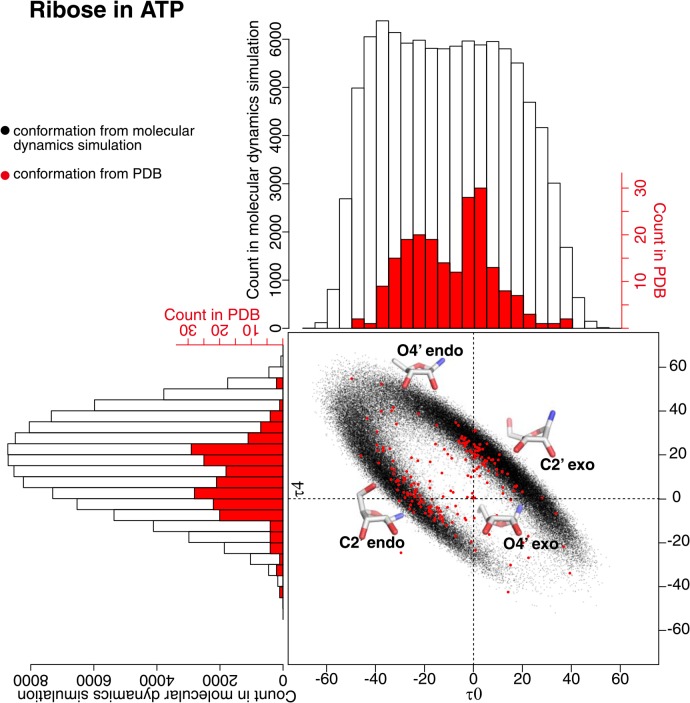
The torsion angles τ0 and τ4 can be good indicators of puckering structure of ribose ring. As shown in Figure 5, a cluster of structures at the first quadrant (τ0>0 and τ4>0) is C2′ exo conformation, the second quadrant (τ0<0 and τ4>0) is O4′ endo conformation, the third quadrant (τ0<0 and τ4<0) is basically C2′ endo conformation, and the fourth quadrant (τ0>0 and τ4<0) is O4′ exo conformation. In water, C2′ exo and C2′ endo conformations was highly dominated followed by O4′ endo conformation. When the distribution in different ten runs of simulation was examined (Supplementary Fig. 3), four runs (trajectories 01, 03, 06, 07) had more numbers of C2′ exo conformations and two runs (trajectories 05, 09) had more numbers of C2′ endo conformations. As a whole, there is a tendency to prefer both C2′ exo and C2′ endo conformations in water. When ATP bound to protein, the number of C2′ exo and C2′ endo conformations were more or less the same and O4′ endo conformation was less populated.
Figure 5.
Ribose torsion angles τ0 and τ4 in the conformations from molecular dynamics simulation and from PDB. A black dot is obtained from the conformation of molecular dynamics simulation, and a red dot is from PDB. The histogram in black clarifies the distribution of black dots, and the one in red clarifies the distribution of red dots.
The difference in puckering seemingly has a connection to the biological role of ATP molecules. Out of 188 protein-bound ATP molecules in the dataset, 43 ATP molecules were for energy extraction through Pi hydrolysis, and 42 ATP molecules were for phosphorylation (Table 1). About 50% of 43 plus 42 ATP molecules took either C2′ exo or C2′ endo conformation. Interestingly, 33% of ATP molecules in energy extraction group (the maximum portion in the group) took C2′ endo conformation, and 33% of ATP molecules in phosphorylation group (the maximum portion in the group) took C2′ exo conformation.
Comparison of adenine conformation
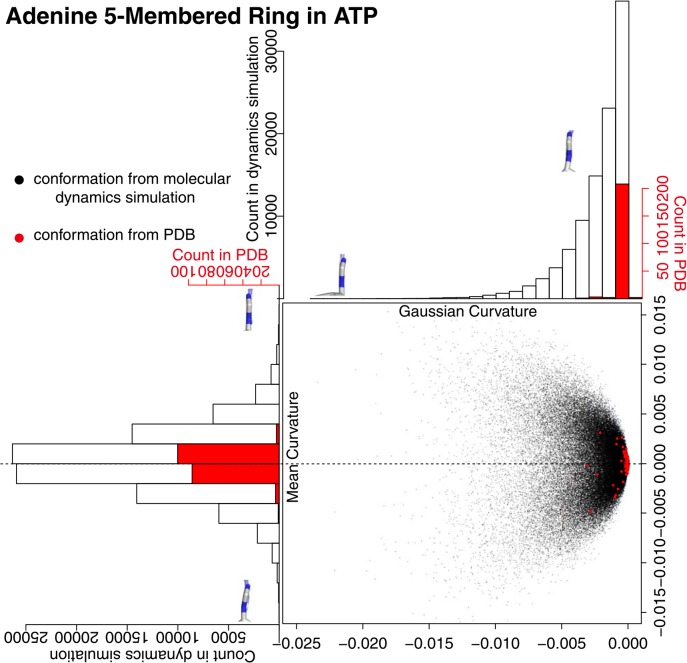
We analyzed the conformation of adenine in two separate rings, namely five-membered ring and six-membered ring. The five-membered ring had a flat conformation during the MD simulation with an occasional slight deviation (Fig. 6). The distribution of the black dots in the figure, which forms an eastbound comet shape in any runs of simulation (Supplementary Fig. 4), suggests that the five-membered ring in adenine should undergo puckering in a very slight scale. The five-membered rings of adenine in the ATP molecules in PDB took a very flat conformation as visualized in the figure by red dots. Almost all the dots were found at the head of the comet shape, where both Gaussian and mean curvatures were very close to zero.
Figure 6.
Adenine five-membered ring curvature in the conformations from the molecular dynamics simulation and from PDB. A black dot is obtained from the conformation of the molecular dynamics simulation, and a red dot is from PDB. The histogram in black clarifies the distribution of black dots, and the one in red clarifies the distribution of red dots. The adenine five-membered rings with minimum/maximum curvature values in the snap shot conformations from the molecular dynamics simulation were drawn on the histograms. A chemical bond at the bottom of each figure is a glycosyl bond and six-membered ring is located at the far side.
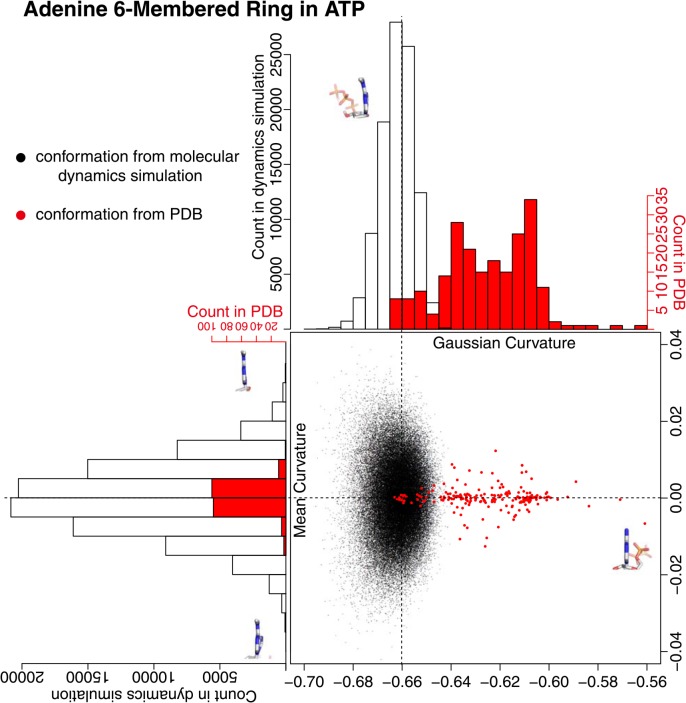
The conformation of six-membered ring in adenine had different characteristics compared with the five-membered ring. In the conformation obtained by the MD simulation, the distribution of the Gaussian curvature was significantly different from that for the five-membered ring (Fig. 7). In the Gaussian curvature, the absolute value of the center of the distribution was significantly greater, and the width of the distribution was significantly wider than those of five-membered ring. The magnitude of distribution in the mean curvature was also greater than that of five-membered ring. These differences evidently appeared in any runs of the simulations (Supplementary Fig. 5). All of these facts indicate that the six-membered ring in solution was deviated from a flat structure in a greater scale compared with the five-membered ring. These deviations from flatness were, however, considerably adjusted when ATP molecule bound to a protein. The distribution of Gaussian curvature of six-membered ring in PDB protruded out to the east direction from the distribution of the Gaussian curvature and squeezed to the center of the mean curvature of ATP in water (red dots in Fig. 7). The six-membered ring of adenine was apparently flattened by the protein, to the extent of the flatness that rarely appeared in ATP in water.
Figure 7.
Adenine six-membered ring curvature in the conformations from the molecular dynamics simulation and from PDB. A black dot is obtained from the conformation of the molecular dynamics simulation, and a red dot is from PDB. The histogram in black clarifies the distribution of black dots, and the one in red clarifies the distribution of red dots. The adenine six-membered rings with minimum/maximum curvature values in the snap shot conformations from the molecular dynamics simulation were drawn on the histograms except for the conformation on the far right side which is derived from PDB structure (PDB ID: 2J9L). A chemical bond at the bottom of each figure is a glycosyl bond and five-membered ring is located at the far side.
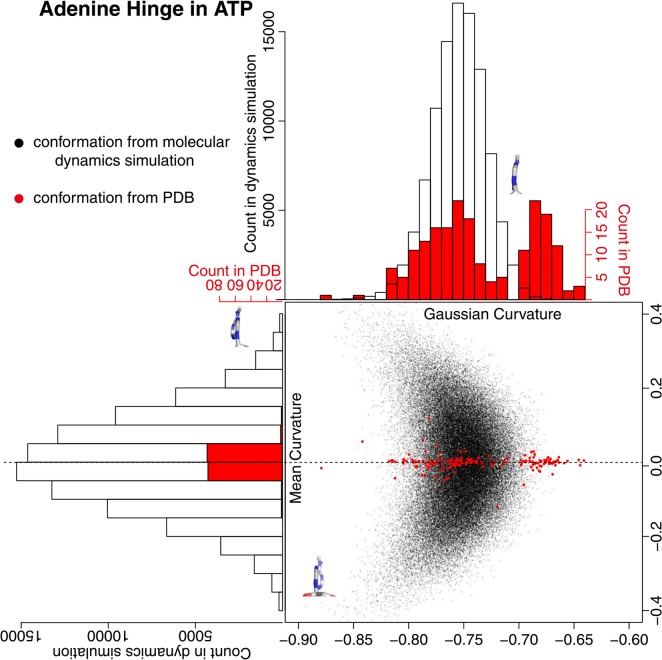
Adenine structure can be approximated to two flat rings that oscillate at the connection and the oscillation motion can be observed in the MD simulation. We described the oscillation motion by defining a pseudo-ring across the two rings and calculated Gaussian and mean curvatures (Fig. 8). In the conformation obtained from the MD simulation, both Gaussian and mean curvatures had normal-like distribution and a crescent-shape distribution when combined; two edges of the crescent consisted of the conformations in the long tail of the Gaussian curvature. These distributions were observed in trajectories of ten runs (Supplementary Fig. 6). In the conformations from PDB, however, the values of the mean curvature were virtually zero and the values of the Gaussian curvature distributed around two peaks, namely the peaks at −0.75 and at −0.68. The former conformations mostly lay within the distribution of ATP in solution, but the latter conformations lay out of the range of the distribution of ATP in solution. The distribution of Gaussian curvature in PDB had no clear correlation to other values such as buriedness of ATP molecule to the protein or the function of ATP molecules, and hence the physicochemical explanation for this distinction needs further study. It seems that, due to some structural constraints, the conformation with Gaussian curvature −0.70 is prohibited in the adenine ring.
Figure 8.
Adenine hinge motion. The hinge motion is defined by the open-book movement in five-membered and six-membered rings in the adenine molecule. A pseudo-ring was defined to assess the openness of the hinge. See the method section for the detail. A black dot is obtained from the conformation of the molecular dynamics simulation, and a red dot is from PDB. The histogram in black clarifies the distribution of black dots and the one in red clarifies the distribution of red dots. The hinge conformations with minimum/maximum curvature values in the molecular dynamics simulation were drawn. A chemical bond at the bottom of each figure is a glycosyl bond and six-membered ring is located at the far side.
Different distributions of torsion angles between the conformations of MD simulation and of PDB
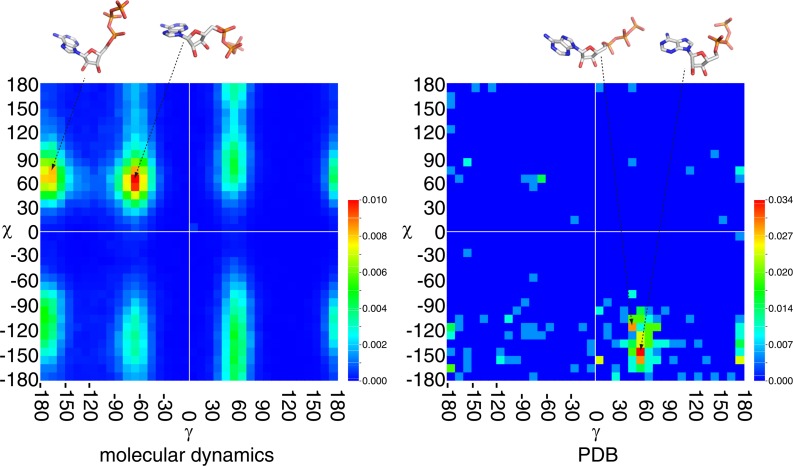
The torsion around the chemical bond between the phosphate unit and the ribose (γ), and that around the glycosyl bond connecting the ribose and adenine (χ) are apparently far more flexible than the torsion angles around the bonds for ribose and adenine rings in ATP molecule (Fig. 1). However, the torsion angles around these bonds in conformations from MD simulation were heavily populated at only two states. When the conformations were counted with the bins of torsion angles digitized by 10 degrees, the densely populated bins were represented by a pair of torsion angles γ=−170 and χ=70, and by a pair of γ=−60 and χ=60. Both conformations were found around 1.0% of the whole population (Fig. 9). Different trajectories had peak population in different torsion angle pairs (Supplementary Fig. 7), but the two peaks in Figure 9 were almost consistently appeared as one of the top peaks in all trajectories. The noticeable exceptions were trajectories 5 and 6. Both trajectories did have a peak at γ=−60 and χ=60, but did not have a peak at γ=−170 and χ=70. The torsion angles γ=−90 to −180 represents a trans conformation between O5′ and C3′. The torsion angle χ=60 represents a gauche+ or syn conformation between the ribose and the adenine. Obviously the ATP molecule assumes a compact conformation by syn conformer in water.
Figure 9.
Probability density function map of the torsion angles &gamma and χ. The left map is derived from the snap shot conformations of the molecular dynamics simulation, and the right map is from the conformations in PDB. The probability is depicted in rainbow colour scheme from blue to red in ascending order as shown in the colour bars. Note that the dynamic range of the two maps is different. One of the structures in highly populated torsion angles is shown on the top.
Peaks in a pair of torsion angles were found in different values in the conformations from PDB. The most heavily populated pair of angles was γ=50, χ=−150 (3.4%), followed by γ=50, χ=−160 (2.9%) and γ=40, χ=−120 (2.9%) (Fig. 9). The torsion angle γ=50 represents a cis conformation between O5′ and C3′.χ=−120 to −160 represents an anti conformation between the ribose and the adenine. When bound to a protein, the ATP molecule is extended over the protein.
In the population derived from MD simulation, the proportion of the conformations abundant in PDB was approximately half of the most populated conformation. Both the conformations with γ=50 and χ=−150 and the conformations with γ=50 and χ=−160 occupied about 0.4%, and the conformations with γ=40 and χ=−120 about 0.2%. In trajectory 6 in ten runs of simulations, 1% of the population was found in a pair of torsion angles close to the conformations found in PDB. This is, however, the only run with the dense population and none of the nine others had the dense population at the corresponding torsion angle pairs. On the other hand, in the population of PDB, the proportion of the conformations abundant in MD simulation was virtually none. These results strongly suggest that during the process of ATP binding to protein, the protein should exert forces on ATP molecule to assume the specific conformation that were under-represented in solution.
As mentioned above, there were three sets of torsion angles in ATP molecules that often appeared in PDB. These three sets were virtually grouped into two, namely, a pair of 50≤γ<60 and −160<χ≤−140, and a pair of 40≤γ<50 and −120<χ ≤−110 (Fig. 9). When we examined the function of ATP molecules in both peaks, we found that the proteins in the former peak had ATP for phosphorylation function twice as many as those in the latter peak (the second group in Table 1). Mildvan discussed in his review17 and his works with the coworkers, that the former peak of χ angle (they called low-antiglycosyl torsional angle) was found in ATP-Mn2+ binary complex and represented presumably an inactive form, and that the latter peak of χ angle (they called high-antiglycosyl torsional angle) was found in ATP-Mn2+-kinase ternary complex and presumably represented an active form. Combined with the current analyses, we suggest that the former peak (50≤γ<60 and −160<χ≤−140) is the set of torsion angles for inactive form and may be easily crystalized. And the latter (40≤γ<50 and −120<χ≤−110) peak is the torsion angles for active form and may be difficult for crystalization, because the conformation initiates chemical reactions. This may explain the difference in the density of population in two peaks. The over-representation of ATP molecules for phosphorylation in the former peaks can be explained by the possibility that they were much easily crystalized in the inactive form.
Conclusion
In this paper, we extensively analyzed the effect of protein to ATP conformations. It has been implicitly assumed that protein affects on ATP conformation when it binds, but there were no comprehensive study on this issue.
Based on the sampling of the ATP solution structures obtained from MD simulation, and the sampling of ATP structures bound to a protein in Protein Data Bank, the following three characteristics were found.
The ribose ring in ATP molecule, which is flexible in solution, tends to assume C2′ exo or C2′ endo conformation when it binds to protein. Proteins that use ATP for energy source tend to bind ATP with C2′ endo forms. Proteins that use ATP for phosphorylation tend to bind ATP with C2′ exo forms.
The adenine ring in ATP molecule, which assumes open-book motion with the two ring structures, has two distinct structures when ATP binds to protein. One of the structures is commonly found in solution but the other not. The physicochemical background of this distinction needs further study.
The torsion angles of glycosyl bond (χ) and the bond between phosphate unit and the ribose (γ) take unique values when ATP binds to protein. The combination of the torsion angles well populated in solution rarely found in the ATP molecule on the protein. There are two well-populated torsion angles in ATP bound to proteins, one of which may represent active form and the other inactive form.
These findings suggest that ATP-binding protein forces ATP to take rare conformation in solution when ATP binds to protein, and that this conformational change exerted by the protein should be the trigger for the cleavage of the γ phosphate group.
Finding a conformation of the bound ligand is a big issue in protein-ligand docking problem18,19,20. The widely used methods introduced MD to search for the conformation of the ligand placed close to the protein. The current study implies that, in the case of ATP molecule, protein bound conformation can hardly be achieved by simple MD simulation, as shown that flatness of the ring structures and the χ and γ torsion angles for protein-bound ATP rarely appears in solution. Therefore, a sophisticated MD simulation that includes both a ligand and a protein at once is, at least, necessary to sample the conformations for protein-ligand complex. In addition, the failure in finding the appropriate conformation in MD simulation can be circumvented by a database search (database sampling), in case the protein-ligand conformations are abundant in the database.
Supplementary Materials
Acknowledgments
K.Y. was supported by Targeted Proteins Research Program (TPRP) and by Platform for Drug Discovery, Informatics, and Structural Life Science from the Ministry of Education, Culture, Sports, Science and Technology (MEXT) of Japan.
References
- 1.Senez JC. Some considerations on the energetics of bacterial growth. Bacteriol Rev. 1962;26:95–107. [PMC free article] [PubMed] [Google Scholar]
- 2.Kitamura K, Tokunaga M, Esaki S, Hikikoshi-Iwane A, Yanagida T. Mechanism of muscle contraction based on stochastic properties of single actomyosin motors observed in vitro. BIOPHYSICS. 2005;1:1–19. doi: 10.2142/biophysics.1.1. [DOI] [PMC free article] [PubMed] [Google Scholar]
- 3.Arnez JG, Moras D. Structural and functional considerations of the aminoacylation reaction. Trends Biochem Sci. 1997;22:211–216. doi: 10.1016/s0968-0004(97)01052-9. [DOI] [PubMed] [Google Scholar]
- 4.Tarrant MK, Cole PA. The chemical biology of protein phosphorylation. Annu Rev Biochem. 2009;78:797–825. doi: 10.1146/annurev.biochem.78.070907.103047. [DOI] [PMC free article] [PubMed] [Google Scholar]
- 5.Schulman BA, Harper JW. Ubiquitin-like protein activation by E1 enzymes: the apex for downstream signalling pathways. Nat Rev Mol Cell Biol. 2009;10:319–331. doi: 10.1038/nrm2673. [DOI] [PMC free article] [PubMed] [Google Scholar]
- 6.Bauer CB, Fonseca MV, Holden HM, Thoden JB, Thompson TB, Escalante-Semerena JC, Rayment I. Three-Dimensional Structure of ATP:corrinoid adenosyltransferase from Salmonella typhimurium in its free state, complexed with MgATP, or complexed with hydroxycobalamin and MgATP. Biochemistry. 2001;40:361–374. doi: 10.1021/bi002145o. [DOI] [PubMed] [Google Scholar]
- 7.Berman HM, Henrick K, Nakamura H. Announcing the worldwide Protein Data Bank. Nat Struct Biol. 2003;10:980. doi: 10.1038/nsb1203-980. [DOI] [PubMed] [Google Scholar]
- 8.Yamaguchi A, Iida K, Matsui N, Tomoda S, Yura K, Go M. Het-PDB Navi.: A database for protein-small molecule interactions. J. Biochem. (Tokyo) 2004;135:79–84. doi: 10.1093/jb/mvh009. [DOI] [PubMed] [Google Scholar]
- 9.Shrake A, Rupley JA. Environment and exposure to solvent of protein atoms. Lysozyme and insulin. J Mol Biol. 1973;79:351–364. doi: 10.1016/0022-2836(73)90011-9. [DOI] [PubMed] [Google Scholar]
- 10.Altschul SF, Madden TL, Schaffer AA, Zhang J, Zhang Z, Miller W, Lipman DJ. Gapped BLAST and PSI-BLAST: a new generation of protein database search programs. Nucleic Acids Res. 1997;25:3389–3402. doi: 10.1093/nar/25.17.3389. [DOI] [PMC free article] [PubMed] [Google Scholar]
- 11.Kitamura Y, Ebihara A, Agari Y, Shinkai A, Hirotsu K, Kuramitsu S. Structure of D-alanine-D-alanine ligase from Thermus thermophilus HB8: cumulative conformational change and enzyme-ligand interactions. Acta Crystallogr D Biol Crystallogr. 2009;65:1098–1106. doi: 10.1107/S0907444909029710. [DOI] [PMC free article] [PubMed] [Google Scholar]
- 12.Hess B, Kutzner C, van der Spoel D, Lindahl E. GROMACS 4: Algorithms for Highly Efficient, Load-Balanced, and Scalable Molecular Simulation. J Chem Theory Comput. 2008;4:435–447. doi: 10.1021/ct700301q. [DOI] [PubMed] [Google Scholar]
- 13.Schlick T. Molecular Modeling and Simulation: An Interdisciplinary Guide. 2nd Edition. Springer; New York: 2010. [Google Scholar]
- 14.Hyde ST, Ninham BW, Zemb T. Phase boundary for ternary microemulsions. Predictions of a Geometric Model. J Phys Chem. 1989;93:1464–1471. [Google Scholar]
- 15.Hyde ST, Barnes IS, Ninham BW. Curvature energy of surfactant interfaces confined to the plaquettes of a cubic lattice. Langmuir. 1990;6:1055–1062. [Google Scholar]
- 16.The UniProt Consortium Ongoing and future developments at the Universal Protein Resource. Nucleic Acids Res. 2011;39:D214–D219. doi: 10.1093/nar/gkq1020. [DOI] [PMC free article] [PubMed] [Google Scholar]
- 17.Mildvan AS. Mechanisms of signaling and related enzymes. PROTEINS: Structure, Function, and Genetics. 1997;29:401–416. [PubMed] [Google Scholar]
- 18.Jones G, Willett P, Glen RC, Leach AR, Taylor R. Development and validation of a genetic algorithm for flexible docking. J Mol Biol. 1997;267:727–748. doi: 10.1006/jmbi.1996.0897. [DOI] [PubMed] [Google Scholar]
- 19.Huang S-Y, Zou X. Advances and challenges in protein-ligand docking. Int J Mol Sci. 2010;11:3016–3034. doi: 10.3390/ijms11083016. [DOI] [PMC free article] [PubMed] [Google Scholar]
- 20.Kokubo H, Tanaka T, Okamura Y. Ab initio prediction of protein-ligand binding structures by replica-exchange umbrella sampling simulations. J Comp Chem. 2011;32:2810–2821. doi: 10.1002/jcc.21860. [DOI] [PubMed] [Google Scholar]
- 21.R Development Core Team . R: A language and environment for statistical computing. R Foundation for Statistical Computing; Vienna, Austria: 2011. [Google Scholar]
Associated Data
This section collects any data citations, data availability statements, or supplementary materials included in this article.


