Abstract
Low-dose X-ray computed tomography (CT) simulation from high-dose scan is required in optimizing radiation dose to patients. In this study, we propose a simple low-dose CT simulation strategy in sinogram domain using the raw data from high-dose scan. Specially, a relationship between the incident fluxes of low- and high- dose scans is first determined according to the repeated projection measurements and analysis. Second, the incident flux level of the simulated low-dose scan is generated by properly scaling the incident flux level of high-dose scan via the determined relationship in the first step. Third, the low-dose CT transmission data by energy integrating detection is simulated by adding a statistically independent Poisson noise distribution plus a statistically independent Gaussian noise distribution. Finally, a filtered back-projection (FBP) algorithm is implemented to reconstruct the resultant low-dose CT images. The present low-dose simulation strategy is verified on the simulations and real scans by comparing it with the existing low-dose CT simulation tool. Experimental results demonstrated that the present low-dose CT simulation strategy can generate accurate low-dose CT sinogram data from high-dose scan in terms of qualitative and quantitative measurements.
Index Terms: X-ray CT, low-dose, high-dose, simulation
I. Introduction
Radiation dose has raised significant concerns among patients and operators because of extensive routine X-ray computed tomography (CT) examinations [1], [2]. Various techniques, including optimized scan protocols, auto-milliampere-seconds (mAs) control, raw data pre-processing, and advanced reconstruction algorithms, have been explored to reduce radiation dose. Among these techniques, lowering the mAs in data acquisition is an effective and easy way to minimize the radiation dose. However, the associated images would be seriously degraded if no adequate noise control is applied during image reconstruction [3], [4]. To optimize the minimum radiation dose with reliable diagnostic information through advanced image reconstruction algorithms, developing a low-dose CT simulation strategy from high-dose scan is an interesting and useful task.
To date, several approaches of simulating low-dose CT scan have been proposed [5]–[14]. Notably, when the raw data of high-dose scan is available, generating some simulated low-dose projection data can be straightforward by injecting Poisson or a combination of Poisson and Gaussian noise into high-dose ones according to the scan protocols and noise properties of the measurements [5], [6]. For example, Massoumzadeh et al. [8], [9] proposed an accurate simulation method to generate low-dose projection data by adding synthetic noise to high-dose data with a realistic projection measuring process that was extensively studied by Whiting et al. [7]. Zabic et al. [10] proposed a low-dose CT simulation tool that is achieved by properly accounting for the noise variance of the high-dose data. In their simulations, the effect of electronic noise was also considered. Considering that the high-dose projection data and related calibration parameters are not fully available to general academic researchers, several studies attempted to simulate low-dose CT images by directly adding appropriate noise to the high-dose ones in image domain [11]–[14]. For example, Veldkamp et al. [13] generated the low-dose CT images by adding Gaussian white noise with a certain standard deviation to high-dose images. Kim et al. [14] proposed a synthetic CT noise simulation method by considering incident photon flux and system electronic noise. Although these low-dose CT image simulation techniques are distinct and understandable, more concerns occur in realistic applications because of the unstable noise properties of the CT image particular in the low-dose case [8], [11].
Inspired by our previous studies on low-dose CT imaging [15]–[17], in this paper we propose a simple low-dose CT simulation strategy in sinogram domain using the raw data from high-dose scan. The idea is based on the fact that a relationship between the mAs levels and the corresponding incident flux levels can be established as an inverse proportional function [16], [17]. According to the determined relationship, the incident flux level of the simulated low-dose scan can be generated by properly scaling the incident flux level of a high-dose scan, and then the low-dose CT projection data by energy-integrating detection can be simulated by adding a statistically independent Poisson noise distribution and a statistically independent Gaussian noise distribution. The contributions of the current study can be summarized as follows: (i) estimating a relationship between the incident fluxes of low- and high- dose scans in the service of low-dose CT simulation wherein all the system calibration operations on raw data can be implicitly included in the related curve fitting; and (ii) presenting a simple low-dose CT simulation strategy from high-dose scan with extensive qualitative and quantitative validation and evaluation.
The remaining sections of this paper are organized as follows. In Sec. II, the background knowledge on the properties of noise statistics in transmission domain is briefly described and then the proposed low-dose CT simulation strategy is presented. The experimental setup is also included in this section. In Sec. III, experimental results are presented in detail. Finally, the discussion and conclusion are provided in Sec. IV.
II. Methods and Materials
A. Statistical Model of CT Transmission Data
Based on the polyenergetic nature of X-ray generation, a compound Poisson model can be used to accurately describe the statistical properties of CT transmission data [18], [19]. In practice, several reports have demonstrated that a simple Poisson distribution can be close to the compound Poisson distribution with the assumption of monochromatic X-ray generation [17], [19]–[21]. For example, a statistical model of CT transmission data by energy integrating detection can be described as a statistically independent Poisson distribution and a statistically independent Gaussian distribution [20], [22], [23]. The associative formula can be expressed as follows:
| (1) |
where Î is the measured noisy transmission datum and λ is the mean number of photon passing though the patient, and the magnitude of λ is primarily determined by the mAs value. me and are the mean and variance of the electronic noise, respectively. In modern CT systems, me can be immediately determined before each scan and are usually calibrated to be zero, and can be estimated from the sample variance of a series of dark current measurements [22], [24]. Mathematically, the mean signal and variance of Î in Eq. (1) with me = 0 can be written as follows [7], [8], [10]:
| (2) |
where A is a scaling factor dependent on the X-ray spectrum and CT system. Assuming that the focal spot is stable and well calibrated, A can be estimated as a ratio between the variance of Î and the mean of Î, i.e.,
| (3) |
B. Low-dose CT Simulation Procedure
Based on the theoretical statistical model of CT transmission data in Eq. (1), in this paper we propose a simple low-dose CT simulation strategy in sinogram domain using the raw data from high-dose scan. To smoothly describe the present low-dose CT simulation strategy in detail, we first list the main simulation procedure and definitions of the related factors as follows:
Step 1: Obtain the raw data files of high-dose (or normal-dose) sinogram data pnd from a CT scanner.
Step 2: Extract the header information of the raw data files, including kVp, mA, rotation time per circle.
Step 3: Convert the high-dose sinogram data pnd to the transmission one, i.e., Tnd = exp(−pnd).
Step 4: Multiply the transmission data Tnd by the simulated low-dose scan incident flux to produce the simulated low-dose transmission data Īld,sim, i.e., , wherein the factor is determined by a relationship between the incident fluxes of low- and high- dose scans as described in following subsection.
Step 5: Generate the simulated low-dose transmission data Ild,sim by injecting Poisson and Gaussian noise into Īld,sim, i.e., , where the factors me and are determined by the techniques described in following subsection.
Step 6: Achieve the desired low-dose sinogram data pld,sim by performing the logarithm transform on the ratio of simulated unattenuated and attenuated signal Ild,sim, i.e., .
Step 7: Perform image reconstruction by different methods from the simulated low-dose sinogram data pld,sim. In this study, conventional filtered back-projection (FBP) method [23] is used for image reconstruction with a fan-beam imaging geometry.
1) Determining , me, and
For the present low-dose sinogram data simulation strategy, three parameters should be determined, namely, the incident flux level of the desired low-dose scan, the means (me) and the variance of electronic noise. In modern CT systems, these parameters can be measured during the standard routine calibration operation. Specifically, (1) the incident flux level across the field-of-view (FOV) can be estimated from the measurements of air scans; (2) the mean me of the electronic noise, arising from the detector dark current, can be immediately determined before each scan by sampling the signals in those unexposed detectors over a certain time interval [22], [24]; and (3) the variance of the electronic system noise can be estimated from the sample variance of a series of dark current measurements.
2) Relationship Between the Incident Fluxes of Low- and High- Dose Scans
The incident flux level of desired low-dose scan acquired by air scan at each mAs is not practical. To address this issue, we first establish a relationship between the incident fluxes of low- and high- dose scans aiming to continuously simulate the desired incident flux levels only according to a high-dose scan. As reported in a previous study [8], the incident flux I on the object equals to the output of the X-ray tube, i.e.,
| (4) |
where K is a constant determined by a specific CT system and c is a collimation factor. Based on Eq. (4), the ratio between the incident flux and , which correspond to the high-dose scan at a given mAsnd and the desired low-dose scan at a specific mAsld,sim, respectively, can be denoted as
| (5) |
where a = c1/(c2 × mAsnd). The ratio κ between the incident flux and nearly expresses as a linear function about mAsld,sim. In practice, with the effects of system noise, the relationship in Eq. (5) can be expressed as follows:
| (6) |
where b represents an error compensation factor. In the low-dose sinogram simulation, if two parameters, a, b, are determined, then any desired at mAsld,sim can be generated from the given under a fixed kVp. A simple method to determine the parameters a and b from the repeatedly measured sinogram data is presented in Sec. III. A.
C. Experimental Data Acquisition
1) Anthropomorphic Torso Phantom
An anthropomorphic torso phantom (Radiology Support Devices Inc., Long Beach, CA) as shown in Fig. 1 (a) was used for experimental data acquisition. A clinical CT scanner (Siemens SOMATOM Sensation 16 CT) was used to scan the phantom with the following scanning geometry parameters: (1) each rotation included 1,160 projection views evenly spaced on a circular orbit; (2) each view contained a total of 672 data elements each from one of the 672 detector bins; (3) the detector arrays were on an arc concentric to the X-ray source with a distance of 1,040 mm; (4) the distance from the rotation center to the X-ray source was 570 mm; and (5) the detector cell spacing was 1.407 mm. The data acquisition protocols were as follows: 16 mm × 0.75 mm detector collimation, 0.5 s per rotation, and 120 kVp tube voltage. A total of five different mAs values were set from 100 down to 17, i.e., 100, 80, 60, 40, and 17 mAs. At each mAs level, the phantom was scanned 150 times repeatedly with a step-and-shoot mode at a fixed bed position. Based on the calibrated output of projections as described in previous studies [16], [25], the obtained raw data in the present study were scaled by a scaling factor 2,294.5, which relates to the number of bits stored in the computer. In the experiments, the sinogram data acquired at 100 mAs (namely, high-dose scan) was used as an input for simulating a low-dose scan.
Fig. 1.
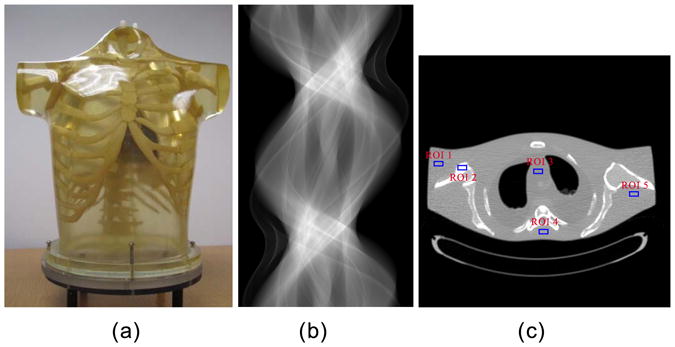
Illustration of an anthropomorphic torso phantom (Radiology Support Devices, Inc., Long Beach, CA) (a), an acquired sinogram dataset from one slice of the 16 detector rows at a protocol of 100 mAs and 120 kVp (b), and a CT image reconstructed by the FBP method with ramp filter from the sinogram dataset (c).
2) Patient Data
The patient scan was scheduled for a chest CT study with medical reasons under patient consent. The experimental data were acquired by a Siemens SOMATOM Sensation 16 CT scanner. The scanning geometry parameters are the same as that described in Sec. II-C1 and the remaining parameters were set as follows: the time of per gantry rotation was 0.5 s with the pitch of 1.0, the tubes currents were 400 mA and 40 mA with the fixed tube voltage of 120 kVp, and the slice thickness was 5.0 mm. In the simulation study, the high-dose scan with 200 mAs was selected as an input to simulate the low-dose scan with 20 mAs.
D. Performance Evaluation
To validate and evaluate the present low-dose simulation method, qualitative and quantitative comparisons would be performed between the simulated and real low-dose data in both the sinogram and image domains.
1) Visualization-based Evaluation
In this study, a qualitative evaluation is conducted using visual inspection and comparison between simulated and actual low-dose data in sinogram and image domains. Although visual inspection in sinogram and image domain both only provide a qualitative evaluation of simulation performance, visual inspection can be an informative assessment of the simulated images, particularly in the presence of photon-starved measurements in sinogram domain and artifacts in image domain that are otherwise difficult to evaluate meaningfully using quantified metrics. In sinogram domain, the narrow grayscale window is used to reveal the photon-starved measurements and artifacts that may be otherwise invisible in the wide grayscale window for the comparison between simulated and actual low-dose data.
2) Quantitative Evaluation
In this study, to quantitatively demonstrate the benefits of the proposed scheme, we calculate root mean square relative error (RMSRE) [8] between the simulated and actual low-dose data in sinogram and image domains, i.e., , where mi and si refer to the measured or simulated data at i. In sinogram domain, the calculation of variance is performed for all detectors over all gantry steps between the original and simulated scans. In image domain, the performance of the simulation method on the reconstruction of ROIs with detail structures, which are labelled with red solid squares in Fig. 1 (c), was evaluated. Four different simulated low-dose scans would be obtained from the high-dose scan with 100 mAs, i.e., 17, 40, 60 and 80 mAs. These images will be compared with the associative real images. Five square ROIs comprising 40 × 40 pixels are defined at various locations on the phantom images, and the pixel statistics (mean and standard deviation) are estimated in these ROIs. This selection provides a total of four sets of simulated ROIs to be compared with four sets of original ROIs for a total of 20 comparisons. In addition, we also adopted the method in [26] to measure the noise of the simulated and real data in sinogram and image domains to validate the noise properties of the simulated data by comparing with the corresponding real one.
3) Profile-based Evaluation
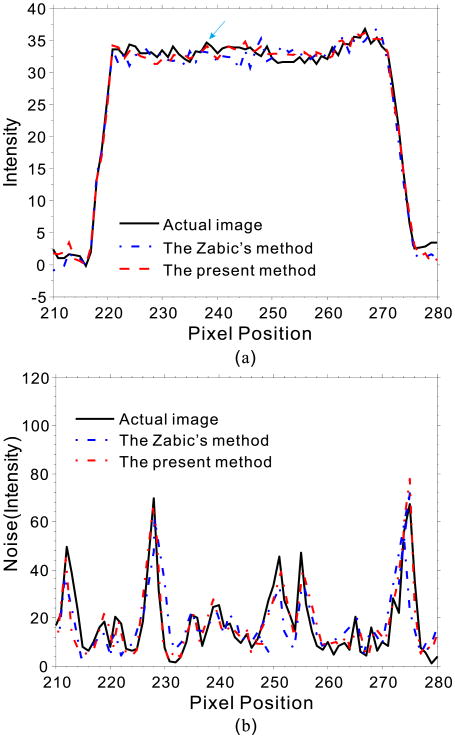
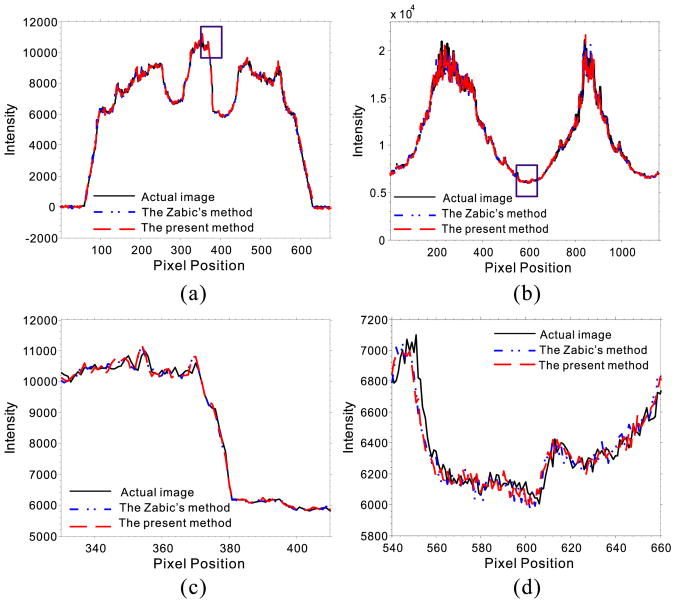
To further visualize the performance of the three simulation methods at local details, we perform profile-based evaluations in sinogram and image domains. In sinogram domain, horizontal and vertical profiles of the resulting sinogram data are drawn across the 580th row and 386th column, respectively. In image domain, a horizontal line profile of the simulated low-dose images and actual low-dose image are drawn across the red line labelled in Fig. 8 (a). These horizontal line profiles are the average (in the vertical direction) of a strip with a height of 5 pixels. In addition, the noise for the horizontal line profile is compared between the simulated low-dose and actual low-dose images.
Fig. 8.
Targeted horizontal profiles (as indicated by a line in Fig. 7 (a)) of the reconstructed images by two different simulation methods.
4) Subjective Assessment
For subjective assessment, 5 radiologists with at least five years of experience in CT imaging scored the simulated images by measuring the degree of similarity between the real and simulated images in terms of the following attributes: image noise, artifacts, edge and structure. A total of eight low-dose sinograms are simulated from sinograms acquired with high-dose protocols. Specifically, from both measured sinograms at 100 and 80 mAs levels, low-dose sinograms were simulated at 17, 40, and 60 mAs levels; from the measured sinogram at 60 mAs level, low-dose sinograms at 17 and 40 mAs levels were simulated. The total of eight simulated datasets was used to compare with the corresponding datasets from the original scans with 17, 40, and 60 mAs. For the patient study, there is one dataset in the cases of 20 mAs simulated from the original scan with 200 mAs. The scoring was performed with a five-point scale: excellent is 5; good is 4; adequate is 3; suboptimal is 2; poor is 1.
E. Comparison Method
To further evaluate the performance of the present low-dose CT simulation strategy, we use the method proposed by Zabic [10] for comparison. The associative simulated low-dose scan incident flux Ild,sim from a high-dose scan can be written as follows:
| (7) |
where A is a ratio between the variance and the mean of raw data. α and β denote the high and low current, respectively. Dc represents the influence of the detector noise. The noise variances of the high-dose scan and the electronic noise with an energy-integrating detector are both considered in the simulation model.
III. Results
A. Parameters Estimation of a, b in Eq. (6)
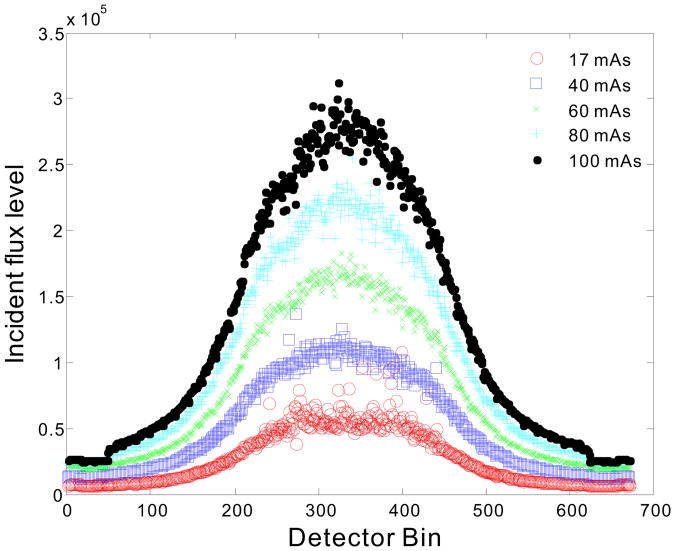
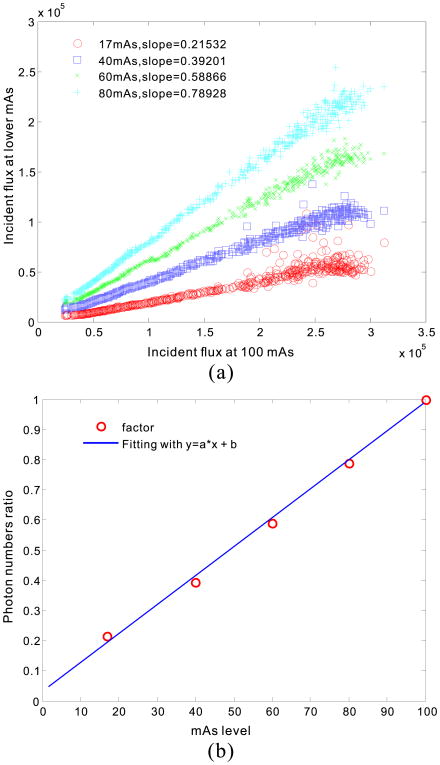
Fig. 2 shows the incident flux values {Ii} from a total of 150 repeatedly measured samples at the five different mAs levels. The curves at different mAs levels have a similar shape and the detected incident flux level increases with mAs changing from 17 to 100 mAs at the fixed 120 kVp. The curve shape was mainly caused by the bowtie filtration aiming to minimize radiation dose by reducing intensity variations across the FOV. The similarity of {Ii} at different mAs was further explored by plotting the paired points {Ii,100, Ii,mAs}, where Ii,100 denotes the value of Ii at 100 mAs, whereas Ii,mAs denotes the value of Ii at another mAs level. Fig. 3 (a) shows the plots of the paired points at the five different mAs. An experiment-grounded linear relationship can be observed at each mAs level, i.e., 17, 40, 60, and 80. Furthermore, the ratios of κ = Ii,mAs/Ii,100 versus the mAs values are shown in Fig. 3 (b). Through a linear fitting operation, the coefficients of the fit curve with 95% confidence bounds were obtained (Table I). The results illustrate that the theoretical linear relationship in Eq. (6) can be successfully validated. As for the explored CT scanner, a ∈ (0.008484,0.01508), b ∈ (−0.0383,0.1002) are optimal values for our concerned low-dose CT simulation.
Fig. 2.
Illustration of the incident flux value {Ii} calculated from the 150 repeatedly measurements at the five different mAs level.
Fig. 3.
Illustration of a linear relationship between incident flux at 100 mAs level and other lower mAs levels from the variance model with consideration of the electronic noise (a), and the factors {κ} at five different mAs levels with considering electronic noise and their fitted curves with a linear functional (b).
Table I.
The Coefficients of the Fitting Curve with 95% Confidence Bounds.
| Coefficients of (with 95% confidence determination bounds) | SSE | R-squares | RMSE | |
|---|---|---|---|---|
|
| ||||
| a | b | |||
| 0.0095 (0.0085,0.0151) | 0.0309 (-0.0383, 0.1002) | 0.0014 | 0.9964 | 0.0214 |
B. Simulation Validation From Anthropomorphic Torso Phantom Study
1) Visualization-based Evaluation in Sinogram Domain
In this experiment, the case of 17 mAs level was chosen as the object of the study and 100 mAs sinogram data was used as an input. Fig. 4 shows the sinogram data of 100 mAs, original 17 mAs, and simulated 17 mAs by the two methods. It can be seen that the starved photon was serious in the sinogram data of original 17 mAs. Meanwhile, the simulated sinogram data of 17 mAs by both the Zabic's method and the present method closely match the original low-dose data in terms of noise level and photon starvation artifacts. To further reveal the detailed structural features, an ROI indicated by a yellow dotted square in Fig. 4 was selected to display the images with a zoom fashion in Fig. 5. The results illustrate that the difference between the Zabic's and the present methods was insignificant in terms of visual inspection.
Fig. 4.
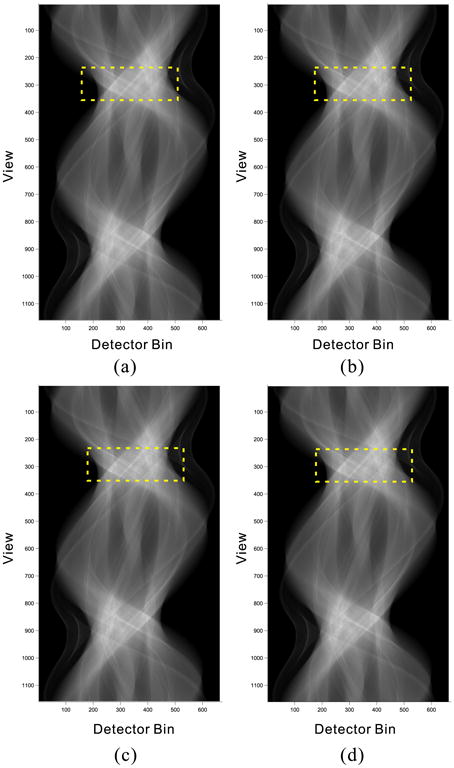
Presentation of sinogram images at real 100 mAs (a), real 17 mAs (b) and different noise simulation algorithms: the Zabic's method (c) and the present method (d). All images are displayed with same window. The ROIs indicated by the yellow squares are zoomed in to display the details, as shown in Fig. 5. All the images are displayed in the same window: [0, 3 × 10⁴].
Fig. 5.
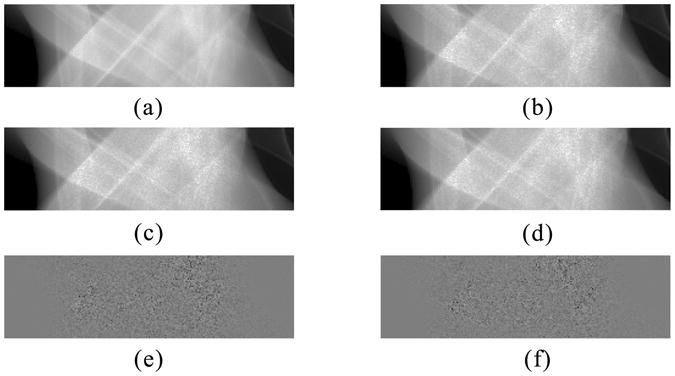
Zoomed ROIs indicated by the yellow squares in the Fig. 4 and the corresponding difference ROI images. (a) is the zoomed ROI of real 100 mAs sinogram images; (b) is the zoomed ROI of real 17 mAs sinogram images; (c) is the zoomed ROI of simulated sinogram images by the Zabic's method; (d) is the zoomed ROI of simulated sinogram images by the present method; (e) is the corresponding difference image of (c) and (b); and (f) is the corresponding difference image of (d) and (b). The display window of (a)-(d) is [0, 2.5×10⁴]. The display window of (e)-(f) is [-5000, 5000].
2) Profile-based Comparison
Fig. 6 shows the horizontal and vertical profiles of the resulting sinogram data drawn across the 580th row and 386th column, respectively. Both the present and Zabic's methods can produce closely matching results overall. To further reveal the detailed structural features in the profile comparison study, the ROIs indicated by the navy blue dotted squares in Figs. 6 (a) and (b) were zoomed in Figs. 6 (c) and (d). The results indicate that the gains from the present method yielded a similar resolution to that from the Zabic's method.
Fig. 6.
Horizontal and vertical profiles of the original sinogram data and simulated sinogram data with different simulation methods. (a) is the horizontal profiles across 580th row; (b) is the vertical profiles across 386th column; (c) is the zoomed ones of (a); and (d) is the zoomed ones of (b).
3) RMSRE Measure in Sinogram Domain
A sinogram at a lower mAs level was simulated using the 100 mAs level scan as an input to the present simulation tool, and the RMSRE between the original and simulated sinograms was computed. The RMSREs are 3.46%, 4.05%, 3.89%, and 1.73% for the 17, 40, 60 and 80 mAs simulations, and are less than 9% for all individual cases [8]. The results demonstrate no significant difference between the selections of the simulated and original sinogram data in terms of the RMSRE measurement.
4) Noise Measurements in Sinogram Domain
The noise of the original and simulated sinograms at four different mAs levels was measured respectively. The corresponding results are listed in Table II. It can be observed that the present method can yield more accurate noise simulation in sinogram domain than the Zabic's method in term of the percent difference between the original and simulated CT sinograms for all the cases.
Table II.
Noise measurements of the original and simulated sinograms at different mAs levels.
| mAs | Real Noise Level | The Zabic's Method | Percent Difference (%) | The Present Method | Percent Difference (%) |
|---|---|---|---|---|---|
| 17 | 45.33 | 41.71 | -7.99 | 43.52 | -3.99 |
| 40 | 25.54 | 25.86 | 1.25 | 25.76 | 0.85 |
| 60 | 16.59 | 16.17 | -2.54 | 16.25 | -2.04 |
| 80 | 12.04 | 12.72 | 5.66 | 12.38 | 2.79 |
5) Visualization-based Evaluation in Image Domain
Fig. 7 shows the reconstruction images from the original and simulated sinograms with 17 mAs. It can be seen that the simulated images obtained by the three methods can closely match the real image in terms of the noise level and streak artifacts. Furthermore, the zoomed images within these ROIs were displayed to examine the reconstruction details. The results again indicate that the present method can successfully simulate the photon starvation artifacts compared to the real values with an eye-appealing visualization.
Fig. 7.
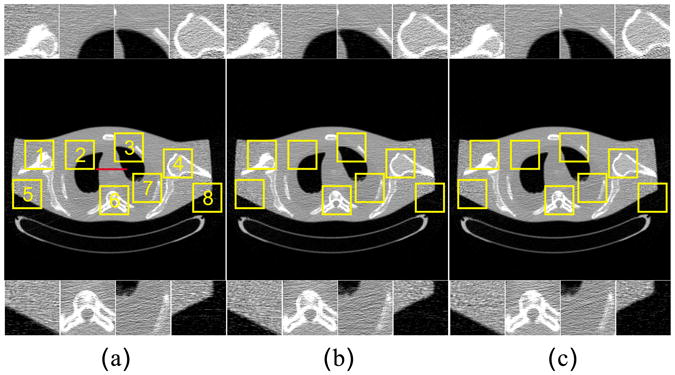
Comparison among the real scan (a) and the different noise simulation algorithms: the Zabic's method (b), and the present method (c). Row 1: the zoomed images from ROI 1 to ROI 4; Row 2: the images within the entire transverse slice; and Row 3: the zoomed images from ROI 5 to ROI 8. All the images are displayed with a same window.
6) Profile-based Comparison
Fig. 8 (a) shows the targeted horizontal profiles (as indicated by a red line in Fig. 7 (a)) of the reconstructed images by different simulation methods (Figs. 7 (b) and (c)) compared with that of the original image in Fig. 7 (a). These horizontal line profiles were the average (in the vertical direction) of a strip with a height of 5 pixels. Both the line profiles from the three methods show reasonable agreement between the simulated and actual images overall. In addition, the pixel indicated by the green arrow in Fig. 8 (a) was more approximately isointense than that in the Zabic's method. In addition, the noise for a horizontal line was compared in Fig. 8 (b) between the actual and simulated images for the 17 mAs level, further demonstrating this agreement. In other words, the present method can yield accurate low-dose simulation in terms of noise and detail distribution measurements.
7) Quantitative Analysis in Image Domain
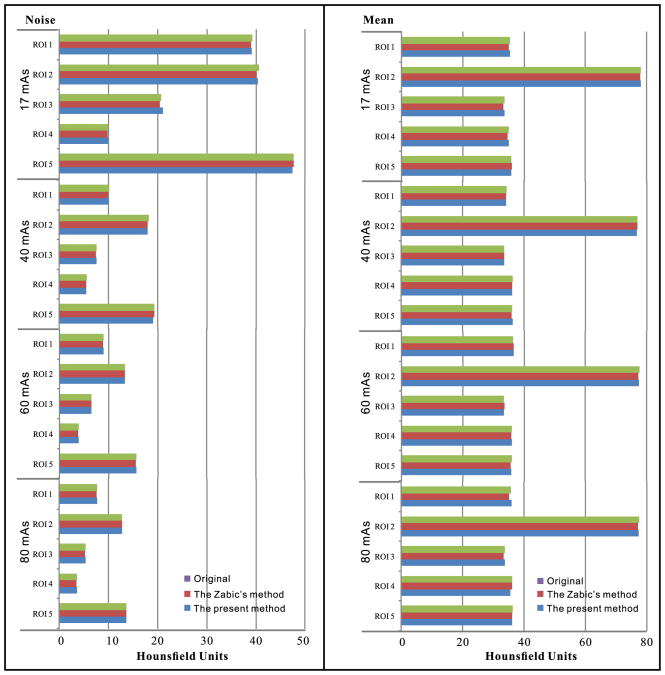
For the anthropomorphic torso phantom images reconstructed from the original and different simulated sinograms at four different mAs levels, Fig. 9 shows the corresponding noise and mean of CT values in five ROIs at four different mAs levels, respectively. It can be observed that the noise and mean from the simulated low-dose CT image using the present method closely match with those from the ground-truth as compared with the Zabic's method in all the cases. Therefore, these results demonstrate that the present method can achieve slight gains over the Zabic's method in term of simulation accuracy in image domain.
Fig. 9.
The associative noise and mean of CT values in five ROIs at four different mAs levels (17, 40, 60, and 80 mAs): the original data (purple bars); the simulated data from the Zabic's method (red bars) and the present method (blue bars).
8) Subjective Assessments
A total of eight images were scored by each radiologist and the subjective scores are listed in Table III. The results indicate that the simulated images from the two methods are acceptable to radiologists and the images from the real and simulated sinograms in the same case of mAs were equivalent in term of visual inspection. Meanwhile, the present method can yield slight higher subjective scores than the Zabic's method in all the cases.
Table III.
Subjective assessments on the images from two different methods at three mAs levels.
| mAs | The Zabic's Method | The Present Method |
|---|---|---|
| 17 | 4.25±0.06 | 4.30±0.04 |
| 40 | 4.37±0.03 | 4.41±0.02 |
| 60 | 4.35±0.02 | 4.42±0.02 |
C. Simulation Validation From Patient Study
Fig. 10 shows the images reconstructed by the FBP method from the original and simulated sinograms with 200 and 20 mAs, respectively. Two FBP images from the original sinograms with 200 and 20 mAs, as shown in Figs. 10 (a) and (b), shared mostly similar anatomic structures except some noticeable organ with elastic deformation as indicated by the red rectangles due to the breathing or heartbeat. Fig. 10 (c) shows the FBP image reconstructed from the simulated 20 mAs sinogram using the presented method. It can be seen that the image from the simulated sinogram can closely match that from the original one in term of noise-induced artifacts. Furthermore, the noise measurements of the corresponding images were performed and the results are listed in Table IV. The results illustrate that there are no significant difference of noise level between the original and simulated CT images in the case of 20 mAs. As an additional validation, we also performed subjective assessments on the simulated images from the present method and the score is 4.65±0.25, which is well consistent with that from the physical phantom simulation. Therefore, the presented method would be useful for practical tasks.
Fig. 10.
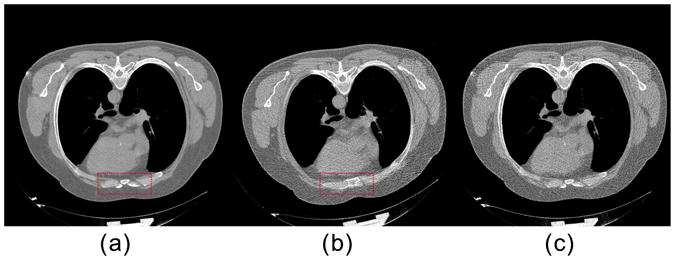
Images reconstructed by the FBP method from the original and simulated sinograms. (a) is from the original sinogram with 200 mAs; (b) is from the original sinogram with 20 mAs; and (c) is from the simulated sinogram using the present method in the case of 20 mAs. All the images are displayed in the window [0.0089 0.0200] mm−1.
Table IV.
Noise measurements of the original and simulated CT images at different mAs levels.
| mAs | Real Noise Level | The Present Method | Percent Difference (%) |
|---|---|---|---|
| 200 | 3.08 | n/a | n/a |
| 20 | 9.82 | 9.23 | -6.01 |
IV. Discussion and Conclusion
The low-dose CT simulation tool can offer radiologists, technologists, and medical physicists the ability to retrospectively study the effect of lower dose on image quality in actual patients. It is known that compared with the simulation method in image domain, the simulation methods in sinogram domain were straightforward and accurate by considering the noise properties and incident flux level [8], [11]. Zabic et al. [10] presented a low-dose incident flux simulation strategy from a high-dose scan by fully taking the variance/mean of high-dose scan and electronic noise into consideration with reasonable gains in low-dose CT simulation. Meanwhile, there are four parameters, i.e., A, α, β and Dc in the Zabic's method need to be determined. Among them, A and Dc are related to system calibration process, which are rarely accessible to general academic researchers. In this study, we propose a simple low-dose CT simulation strategy in sinogram domain. The main difference between the present and other methods is that low-dose projection can be simulated from high-dose scan via a linear relationship between the incident fluxes of low- and high- dose scans. And, one major advantage of the present method over other methods is that there are only two parameters, i.e., a & b, to be determined and all the system calibration operations on raw data can be implicitly included in the related curve fitting. Through extensive experiments, the effectiveness of the present method has been validated and evaluated by comparison with the state-of-the-art method developed by Zabic et al. [10].
To develop an accurate low-dose CT simulation tool, both an accurate statistical distribution synthesis of projection data and a reasonable background electronic noise should be fully considered. In this study, we only considered the case of monochromatic photon model which implied a simple Poisson statistical model. In realistic low-dose CT projection data simulation, the polychromatic photon model should be further explored. In addition, the validation of the present method in image domain is only based on the FBP method in terms of qualitative and quantitative measurements. In our further study, more validation and evaluation would be performed on the real images reconstructed by the statistical iterative methods to determine whether our present method is effective for clinical real data.
In summary, the present low-dose simulation method can be used in various areas of evaluating CT acquisition by simulating realistic low-dose CT images, including optimizing low-dose scan protocol and developing advanced low-dose CT image reconstruction algorithms. This is another interesting topic in our future research.
Acknowledgments
This work was partially supported by the National Natural Science Foundation of China under grand (No. 81371544, No. 81101046), the National Science and Technology Major Project of the Ministry of Science and Technology of China (No. 2014BAI17B02), and Science and Technology Program of Guangzhou, China (No. 201510010039). Z. Liang also was partially supported by the NIH/NCI under Grant #CA143111 and Grant #CA082402.
Contributor Information
Dong Zeng, Email: zd1989@smu.edu.cn, School of Biomedical Engineering, Southern Medical University, Guangzhou 510515, China.
Jing Huang, Email: hjing@fimmu.com, School of Biomedical Engineering, Southern Medical University, Guangzhou 510515, China.
Zhaoying Bian, Email: zybian@smu.edu.cn, School of Biomedical Engineering, Southern Medical University, Guangzhou 510515, China.
Shanzhou Niu, Email: szniu@smu.edu.cn, School of Biomedical Engineering, Southern Medical University, Guangzhou 510515, China.
Hua Zhang, Email: xinsier@smu.edu.cn, School of Biomedical Engineering, Southern Medical University, Guangzhou 510515, China.
Qianjin Feng, Email: fengqj99@fimmu.com, School of Biomedical Engineering, Southern Medical University, Guangzhou 510515, China.
Zhengrong Liang, Email: jzl@mil.sunysb.edu, Department of Radiology, State University of New York, Stony Brook, NY 11794, USA.
Jianhua Ma, Email: jhma@smu.edu.cn, School of Biomedical Engineering, Southern Medical University, Guangzhou 510515, China.
References
- 1.Brenner DJ, Hall EJ. Computed tomography–an increasing source of radiation exposure. N Engl J Med. 2007;357:2277–84. doi: 10.1056/NEJMra072149. [DOI] [PubMed] [Google Scholar]
- 2.Einstein AJ, Henzlova MJ, Rajagopalan S. Estimating risk of cancer associated with radiation exposure from 64-slice computed tomography coronary angiography. JAMA. 2007;298:317–23. doi: 10.1001/jama.298.3.317. [DOI] [PubMed] [Google Scholar]
- 3.Hsieh J. Adaptive streak artifact reduction in computed tomography resulting from excessive x-ray photon noise. Med Phys. 1998;25:2139–47. doi: 10.1118/1.598410. [DOI] [PubMed] [Google Scholar]
- 4.Li T, Li X, Wang J, Wen J, Lu H, Hsieh J, Liang Z. Nonlinear sinogram smoothing for low-dose X-ray CT. IEEE Trans Nucl Sci. 2004;51:2505–13. [Google Scholar]
- 5.Mayo JR, Whittall KP, Leung AN, Hartman TE, Park CS, Primack SL, Chambers GK, Limkeman MK, Toth TL, Fox SH. Simulated dose reduction in conventional chest CT: validation study. Radiology. 1997;202:453–7. doi: 10.1148/radiology.202.2.9015073. [DOI] [PubMed] [Google Scholar]
- 6.Frush DP, Slack CC, Hollingsworth CL, Bisset GS, Donnelly LF, Hsieh J, Lavin-Wensell T, Mayo JR. Computer-simulated radiation dose reduction for abdominal multidetector CT of pediatric patients. Am J Roentgenol. 2002;179:1107–13. doi: 10.2214/ajr.179.5.1791107. [DOI] [PubMed] [Google Scholar]
- 7.Whiting BR, Massoumzadeh P, Earl OA, Sullivan JAO, Snyder DL, Williamson JF. Properties of preprocessed sinogram data in x-ray computed tomography. Med Phys. 2006;33:3290–303. doi: 10.1118/1.2230762. [DOI] [PubMed] [Google Scholar]
- 8.Massoumzadeh P, Don S, Hildebolt CF, Bae KT, Whiting BR. Validation of CT dose-reduction simulation. Med Phys. 2009;36:174–89. doi: 10.1118/1.3031114. [DOI] [PMC free article] [PubMed] [Google Scholar]
- 9.Massoumzadeh P, Earl OA, Whiting BR. Noise simulation in x-ray CT. Proc SPIE Med Imag. 2005 Feb;5745:898–909. [Google Scholar]
- 10.Zabic S, Wang Q, Morton T, Brown KM. A low dose simulation tool for CT systems with energy integrating detectors. Med Phys. 2013;40:031102. doi: 10.1118/1.4789628. [DOI] [PubMed] [Google Scholar]
- 11.Britten AJ, Crotty M, Kiremidjian H, Grundy A, Adam EJ. The addition of computer simulated noise to investigate radiation dose and image quality in images with spatial correlation of statistical noise: an example application to X-ray CT of the brain. Br J Radiol. 2004;77:323–8. doi: 10.1259/bjr/78576048. [DOI] [PubMed] [Google Scholar]
- 12.Li X, Samei E, DeLong DM, Jones RP, Gaca AM, Hollingsworth CL, Maxfield CM, Colsher JG, Frush DP. Pediatric MDCT:Towards assessing the diagnostic influence of dose reduction on the detection of small lung nodules. Academic Radiology. 2009;16:872–80. doi: 10.1016/j.acra.2009.01.028. [DOI] [PubMed] [Google Scholar]
- 13.Veldkamp WJH, Kroft LJM, Delft JPA, Geleijns J. A Technique for Simulating the Effect of Dose Reduction on Image Quality in Digital Chest Radiography. J Digit Imaging. 2009;22:114–25. doi: 10.1007/s10278-008-9104-5. [DOI] [PMC free article] [PubMed] [Google Scholar]
- 14.Kim CW, Kim JH. An image-based approach to low-dose CT simulation. Proc SPIE Med Imag. 2012 Feb;8313:83134D–83134D. [Google Scholar]
- 15.Ma J, Liang Z, Fan Y, Liu Y, Huang J, Lu H, Chen W. A study on CT sinogram statistical distribution by information divergence theory. Nucl Sci Symp Med Imag Conf Rec. 2011 Oct;:3191–6. [Google Scholar]
- 16.Ma J, Liang Z, Fan Y, Huang J, Li L, Chen W, Lu H. Variance estimation of X-ray CT sinogram in Radon domain. Proc SPIE Med Imag. 2012 Feb;8313:83132G–83132G. [Google Scholar]
- 17.Ma J, Liang Z, Fan Y, Liu Y, Huang J, Chen W, Lu H. Variance analysis of x-ray CT sinograms in the presence of electronic noise background. Med Phys. 2012;39:4051–65. doi: 10.1118/1.4722751. [DOI] [PMC free article] [PubMed] [Google Scholar]
- 18.Whiting BR. Signal statistics of x-ray computed tomography. Proc SPIE Med Imag. 2002 Feb;4682:53–60. [Google Scholar]
- 19.Elbakri IA, Fessler JA. Statistical image reconstruction for polyenergetic X-ray computed tomography. IEEE Trans Med Imag. 2002;21:89–99. doi: 10.1109/42.993128. [DOI] [PubMed] [Google Scholar]
- 20.Lasio GM, Whiting BR, Williamson JF. Statistical reconstruction for x-ray computed tomography using energy-integrating detectors. Phys Med Biol. 2007;52:2247–66. doi: 10.1088/0031-9155/52/8/014. [DOI] [PubMed] [Google Scholar]
- 21.Xu J, Tsui BMW. Electronic Noise Modeling in Statistical Iterative Reconstruction. IEEE Trans Image Process. 2009;18:1228–38. doi: 10.1109/TIP.2009.2017139. [DOI] [PMC free article] [PubMed] [Google Scholar]
- 22.Hsieh J. Computed tomography: principles, design, artifacts, and recent advances. Bellingham, WA: SPIE; 2003. [Google Scholar]
- 23.Kak AC, Slaney M. Principles of computerized tomographic imaging. New York: Society for Industrial and Applied Mathematics; 2001. [Google Scholar]
- 24.La Riviere PJ, Bian J, Vargas PA. Penalized-likelihood sinogram restoration for computed tomography. IEEE Trans Med Imag. 2006;25:1022–36. doi: 10.1109/tmi.2006.875429. [DOI] [PubMed] [Google Scholar]
- 25.Wang J, Lu H, Liang Z, Eremina D, Zhang G, Wang S, Chen J, Manzione J. An experimental study on the noise properties of x-ray CT sinogram data in Radon space. Phys Med Biol. 2008;53:3327–41. doi: 10.1088/0031-9155/53/12/018. [DOI] [PMC free article] [PubMed] [Google Scholar]
- 26.Liu X, Tanaka M, Okutomi M. Single-image Noise Level Estimation for Blind Denoisin. IEEE Trans Image Process. 2013;22:5226, 37. doi: 10.1109/TIP.2013.2283400. [DOI] [PubMed] [Google Scholar]


