

Abstract
Purpose
As part of the Danish Diabetes Impact Study 2013, we present trends in the incidence, morbidity, mortality, and prevalence of diabetes in Denmark for the period 2000 through 2011.
Patients and methods
The Danish National Diabetes Register was established in 2006 and is assumed to cover all patients with diabetes, alive as of the end of 1996, and all subsequent new cases. The present study is based on the content of the register as of July 3, 2013 (n=497,232 patients). Using the personal identification code assigned to all Danish inhabitants, all available supplementary information from the Danish National Patient Register and the Danish Civil Registration Service was used to define the date of diagnosis of diabetes and the first date of experiencing complications (grouped according to impact and severity).
Results
During the period of 2000 to 2011, the incidence rate of diabetes increased approximately 5% annually. During the same period, decreasing trends were observed for both the rates of progression in complications and of the complication-specific mortality. During the same period, the prevalence of diabetes doubled.
Conclusion
The increasing prevalence of diabetes in Denmark is driven by increasing incidence combined with decreasing morbidity and mortality in the population of patients with diabetes. These mechanisms will be explored further as part of the Diabetes Impact Study 2013, together with investigations into the socioeconomic and health economic aspects of diabetes.
Keywords: diabetes, registries, morbidity, complications
Introduction
Diabetes is a major global health problem, which currently affects millions of people worldwide with high and escalating costs to societies.1,2 We have established the Diabetes Impact Study 2013 with the aim to provide an updated account of the current and future epidemiological profile of diabetes in Denmark together with an appraisal of the costs to patients and society that is attributable to diabetes. The study takes advantage of the establishment of the Danish National Diabetes Register (NDR) in 20063 which, together with the high quality of Danish health registers, offers unique opportunities for epidemiological and public health research in diabetes.4
Here, we present the Diabetes Impact Study 2013 and the first epidemiological results, with focus on the trends in the incidence, the mortality, and the resulting prevalence of diabetes in Denmark from 2000 to 2011. As a novelty, we also introduce the framework of using register data to classify diabetes by complications status to investigate the epidemiological characteristics of chronic complications of diabetes.
Patients and methods
Data sources
NDR is established on the basis of information contained in already existing Danish health registers,3 including the Danish National Patient Register (DNPaR),5 the Danish National Prescription Registry,6 and the Danish National Health Service Register.7 Linkage of person-specific data between the registers is possible using the personal identification number that is assigned to each Danish citizen and is used for administrative purposes throughout the public and private sectors in Denmark. As previously summarized,3,8 inclusion in NDR takes place for a given person when the first of several possible ascertainment criteria are met: the first date of either a contact registered in the DNPaR with a diagnosis relevant to diabetes mellitus, fulfillment of specific criteria of purchasing prescriptions with either insulin or peroral antidiabetic drugs, fulfillment of one of two specific patterns of measurement of blood sugar, or a registration of a chiropodist service specifically provided to a person with diabetes.
All data on moves, migrations, and deaths recorded for the population of NDR registrants were obtained from the Danish Civil Registration System, which, since 1968, has kept electronic records on all demographic data for all Danish inhabitants.9
NDR is supposed to cover all persons fulfilling inclusion criteria and being alive at the end of 1996 plus all persons with inclusion date since the start of 1997.
For the present analysis, a data set was extracted with all patients cumulatively registered with NDR on July 3, 2013 (n=497,232). For these patients, all contacts (regardless of the date of contact) in DNPaR were extracted, including coded data in all diagnostic and therapeutic interventions performed, together with information on primary and secondary diagnoses underlying the contact, the hospital, and all relevant dates related to the contact. DNPaR contains information on all activities in the Danish hospitals back to 1977 for inpatient contacts and 1995 for outpatient contacts, including visits to emergency rooms.5
Establishing milestones in the lifetime cause of diabetes
By means of the personal identification number, data for each of the registrants in NDR were linked with DNPaR to establish relevant clinical milestones for each patient. These milestones included the date of first occurrence of the diagnosis of diabetes, and the date of first occurrence of codes classifying for chronic complications related to diabetes (see “Establishing the diagnosis of diabetes” section). Information from Danish Civil Registration System was used to establish the date of death (regardless of the cause of death) and the date of emigration as relevant.
Establishing the diagnosis of diabetes
The date of the clinical diagnosis of diabetes is not available in NDR and has been operationally established as the first date of fulfillment of a criterion for inclusion in NDR.8 If the first registration of a diagnosis or an intervention code specific for diabetes occurred in DNPaR for a patient before the date of inclusion registered with NDR, this date has been used as a proxy for the date of diagnosis. Otherwise, the date of inclusion in NDR has been used. The right column of Table 1 shows how groups of codes of diagnoses and interventions have been used in this process. The complete list of all the codes of diagnoses and interventions which qualify for the diagnosis of diabetes and related complications may be accessed from http://www.appliedeconomics.dk/index.php/publications/reports-for-download.
Table 1.
Grouping of diagnoses and interventions used for classifying hospital activities by complication groups of relevance for diabetes and with respect to diagnostic specificity for diabetes
| Diagnosis or procedure | Qualifying for complication groupa | Specificity for diabetesb |
|---|---|---|
| Diabetes in pregnancy, childbirth, and the puerperium | 0 | 1 |
| Diabetes, without indication of chronic complication | 0 | 1 |
| Hypoglycemic coma not otherwise specified | 0 | 0 |
| Screening for diabetic retinopathy | 0 | 1 |
| Drug treatment or instruction specific for diabetes | 0 | 1 |
| Acute myocardial infarction | 1 | 0 |
| Diabetes with complication, not further specified | 1 | 1 |
| Diabetes with complications in peripheral vascular system | 1 | 1 |
| Diabetes with eye complication | 1 | 1 |
| Diabetes with foot ulcer | 1 | 1 |
| Diabetes with microangiopathy | 1 | 1 |
| Diabetes with neurological complication | 1 | 1 |
| Diabetes with peripheral angiopathy | 1 | 1 |
| Diabetes with renal complication | 1 | 1 |
| Diabetic cataract | 1 | 1 |
| Diabetic polyneuropathy | 1 | 1 |
| Diabetic retinopathy not otherwise specified | 1 | 1 |
| Diseases of the lens | 1 | 0 |
| Polyneuropathy | 1 | 0 |
| Proliferative diabetic retinopathy | 1 | 1 |
| Uremia | 1 | 0 |
| Simplex diabetic retinopathy | 1 | 1 |
| Cataract, retinopathy in diabetes | 1 | 1 |
| Diabetic angiopathy in extremities | 1 | 1 |
| Diabetic nephropathy, Kimmelstiel–Wilson syndrome | 1 | 1 |
| Neuropathy, diabetic polyneuritis, diabetes | 1 | 1 |
| Amputation at or below ankle level | 1 | 0 |
| Coronary bypass operation | 1 | 0 |
| Surgery for eye complication | 1 | 0 |
| Treatment of ulcer of lower limb | 1 | 0 |
| Diabetes with gangrene; diabetic gangrene | 2 | 1 |
| Diabetes with multiple complications | 2 | 1 |
| Diabetic maculopathy | 2 | 1 |
| Dialysis | 2 | 0 |
| Diseases of the retina | 2 | 0 |
| Heart failure | 2 | 0 |
| Kidney transplantation | 2 | 0 |
| Renal failure | 2 | 0 |
| Stroke | 2 | 0 |
| Blindness | 2 | 0 |
| Gangrene of lower limb | 2 | 0 |
| Intracerebral hemorrhage | 2 | 0 |
| Amputation above ankle level | 2 | 0 |
Notes:
0, complication group 0 (no signs of complications); 1, complication group 1 (complications of moderate impact); 2, complication group 2 (complications of major impact);
values indicate specificity for diabetes (0, unspecific for diabetes; 1, specific for diabetes).
Occurrence and classification of complications relevant for diabetes
We have attempted to assess when a patient has developed chronic diabetes complications based on coded information from the DNPaR. In the absence of published guidelines, we have relied on consultations with clinical experts combined with decisions made on the basis of the actual distribution of relevant codes. This classification scheme comprises three complication groups on a tentative basis: without evidence of complications from available data (complication group 0, CG0); with evidence of at least one complication of intermediate impact (complication group 1, CG1); and with evidence of at least one complication of major impact (complication group 2, CG2). We have assumed irreversibility so that once qualified for CG1, the patient cannot revert to CG0 and can only remain in CG1 until death or progression to CG2. For patients with transition directly from CG0 to CG2, it has been assumed, for computational reasons, that the patient first progresses to CG1, but instantaneously progresses further to CG2 without producing person-time in CG1.
The date of progression to a given complication group has been taken as the first occurrence of a code of diagnosis or procedure registered in DNPaR qualifying for a CG. Table 1 (middle column) provides a summary of this information and the complete list of all the codes of diagnoses and interventions, which qualify for a complication group and may be accessed from http://www.appliedeconomics.dk/index.php/publications/reports-for-download. Codes not qualifying for any complication are assigned to CG0 by default.
Some codes of diagnoses and procedures are specific for diabetes (eg, diabetic retinopathy), while others are unspecific (eg, myocardial infarction and amputations). For patients having developed such complication(s) before the operational date of the diagnosis of diabetes, the patients will be assigned to the concerned CG at the date of diagnosis of diabetes and the patient can only contribute with person-time at risk for progression to a more advanced CG.
Framework of epidemiological analysis
The epidemiological analyses of transition rates and prevalence proportions have been performed within the framework of an illness-stage-death model outline in Figure 1. The number of persons present in each of the stages, represented in the flow chart in Figure 1, on the last date of a given calendar year represents the prevalence of patients with the complication status for that year. These numbers provide for the annual complication-specific prevalence proportions by division with the total population size. Annual transition rates (incidence rate of the disease; morbidity rates reflecting rates of progression from CG0 to CG1 and from CG1 to CG2, respectively; and mortality rates from each of the complication groups) have been estimated from the numbers of transitions divided with the appropriate numbers of person-years at risk during the calendar year concerned.
Figure 1.

An illness-stage–death model with three categories of complications as the framework for epidemiological analysis.
Notes: The model is populated on an annual basis. Numbers in the boxes represent annual complication-specific prevalence and numbers assigned to the arrows represent annual incidence, progression between complication categories (morbidity), and complication-specific mortality.
For each calendar year, we calculated individual person-time, in terms of 1) the exact number of days experienced in any combination of 5-year age-groups; and 2) complication status based on the transition dates between age-groups and complication groups. Age groups were further collapsed to the groups: 0–24, 25–49, 50–74, and 75+ years. The analyses of morbidity and mortality were done on the basis of age standardization within each sex using the age composition of the population of persons with diabetes 2006 ultimo.
For the estimation of the incidence rate of diabetes, population time at risk of developing diabetes for each calendar year was obtained from Statistics Denmark,10 with subtraction of the person-time experienced with diabetes during that year in order to estimate true person-time at risk in the denominator. The analysis of incidence rate of diabetes was done on the basis of age standardization within each sex, using the age composition of the Danish population 2006 ultimo in four groups: 0–24, 25–49, 50–74, and 75+ years.10
χ2-based analyses were employed to test for heterogeneity over calendar time. An approximated Poisson distribution and the binomial distribution for rates and proportions were used to calculate 95% confidence intervals.
Because we consider the first operational years of the NDR (1997–1999) as a running-in phase, the present analysis focuses on the period from 2000 to 2011.
Ethical aspects
The Diabetes Impact Study 2013 is an observational register-based investigation with no contact to registered persons. Permission to extract and analyze data was obtained from the Danish Data Protection Agency (Jnr 2013-21-1749) and the Danish National Board of Health (FSEID-00000440).
Results
As of July 3, 2013, a total of 497,232 persons were registered in NDR. After exclusion of 688 persons with invalid or inconsistent data, 496,514 persons (99.9% of all registrants) were included in the present analysis.8 Table 2 contains a summary of all events observed and inferred from the registry data by complication group for the total population, with stratification for men and women.
Table 2.
Summary of data by complication group
| Year | New cases of diabetes by complication status at diagnosis
|
Progressions to CG1 and CG2
|
Prevalent cases ultimo year by complication status
|
Number of deaths by complication status
|
||||||||||
|---|---|---|---|---|---|---|---|---|---|---|---|---|---|---|
| CG0 | CG1 | CG2 | Total | CG1 | CG2 | CG0 | CG1 | CG2 | Total | CG0 | CG1 | CG2 | Total | |
| All | ||||||||||||||
| 1999 | NA | NA | NA | NA | NA | NA | 82,261 | 27,061 | 32,143 | 141,465 | NA | NA | NA | NA |
| 2000 | 13,806 | 1,825 | 2,745 | 18,376 | 6,963 | 5,467 | 86,830 | 28,988 | 35,564 | 151,382 | 2,170 | 1,370 | 4,774 | 8,314 |
| 2001 | 14,727 | 2,020 | 2,913 | 19,660 | 7,122 | 5,644 | 92,131 | 31,111 | 39,088 | 162,330 | 2,193 | 1,341 | 4,998 | 8,532 |
| 2002 | 16,274 | 2,189 | 3,355 | 21,818 | 7,666 | 5,912 | 98,299 | 33,582 | 42,961 | 174,842 | 2,315 | 1,422 | 5,369 | 9,106 |
| 2003 | 17,696 | 2,432 | 3,644 | 23,772 | 8,246 | 5,910 | 105,273 | 36,806 | 46,836 | 188,915 | 2,310 | 1,512 | 5,653 | 9,475 |
| 2004 | 17,652 | 2,388 | 3,872 | 23,912 | 8,380 | 6,127 | 112,044 | 39,952 | 51,103 | 203,099 | 2,344 | 1,453 | 5,702 | 9,499 |
| 2005 | 16,206 | 2,343 | 3,588 | 22,137 | 8,305 | 6,053 | 117,467 | 43,012 | 54,627 | 215,106 | 2,333 | 1,479 | 6,097 | 9,909 |
| 2006 | 16,718 | 2,442 | 3,829 | 22,989 | 8,340 | 6,051 | 123,201 | 46,064 | 58,304 | 227,569 | 2,469 | 1,638 | 6,173 | 10,280 |
| 2007 | 17,967 | 2,411 | 4,040 | 24,418 | 7,651 | 5,727 | 130,841 | 48,661 | 61,667 | 241,169 | 2,533 | 1,686 | 6,375 | 10,594 |
| 2008 | 19,585 | 2,720 | 4,345 | 26,650 | 7,852 | 6,039 | 139,896 | 51,472 | 65,478 | 256,846 | 2,530 | 1,672 | 6,547 | 10,749 |
| 2009 | 19,580 | 2,641 | 4,367 | 26,588 | 8,252 | 6,386 | 148,353 | 54,108 | 69,233 | 271,694 | 2,732 | 1,808 | 6,963 | 11,503 |
| 2010 | 20,258 | 2,762 | 4,487 | 27,507 | 8,170 | 6,339 | 157,413 | 56,790 | 72,891 | 287,094 | 2,851 | 1,851 | 7,129 | 11,831 |
| 2011 | 23,622 | 3,107 | 5,092 | 31,821 | 8,343 | 6,523 | 169,635 | 59,813 | 77,176 | 306,624 | 2,823 | 1,841 | 7,237 | 11,901 |
| Men | ||||||||||||||
| 1999 | NA | NA | NA | NA | NA | NA | 38,993 | 15,161 | 17,385 | 71,539 | NA | NA | NA | NA |
| 2000 | 6,919 | 1,128 | 1,509 | 9,556 | 3,689 | 2,935 | 41,083 | 16,313 | 19,320 | 76,716 | 1,087 | 721 | 2,496 | 4,304 |
| 2001 | 7,357 | 1,232 | 1,613 | 10,202 | 3,869 | 3,058 | 43,432 | 17,628 | 21,344 | 82,404 | 1,070 | 712 | 2,621 | 4,403 |
| 2002 | 7,849 | 1,368 | 1,871 | 11,088 | 4,071 | 3,211 | 46,008 | 19,063 | 23,504 | 88,575 | 1,140 | 755 | 2,903 | 4,798 |
| 2003 | 8,838 | 1,524 | 2,035 | 12,397 | 4,470 | 3,277 | 49,126 | 20,969 | 25,781 | 95,876 | 1,143 | 788 | 3,020 | 4,951 |
| 2004 | 8,777 | 1,513 | 2,159 | 12,449 | 4,484 | 3,340 | 52,152 | 22,806 | 28,186 | 103,144 | 1,170 | 799 | 3,073 | 5,042 |
| 2005 | 8,094 | 1,451 | 2,032 | 11,577 | 4,442 | 3,396 | 54,613 | 24,463 | 30,340 | 109,416 | 1,105 | 807 | 3,256 | 5,168 |
| 2006 | 8,295 | 1,588 | 2,196 | 12,079 | 4,474 | 3,344 | 57,176 | 26,240 | 32,609 | 116,025 | 1,167 | 922 | 3,252 | 5,341 |
| 2007 | 8,898 | 1,536 | 2,249 | 12,683 | 4,080 | 3,187 | 60,674 | 27,738 | 34,605 | 123,017 | 1,229 | 897 | 3,418 | 5,544 |
| 2008 | 9,682 | 1,806 | 2,522 | 14,010 | 4,196 | 3,315 | 64,827 | 29,473 | 36,910 | 131,210 | 1,235 | 916 | 3,519 | 5,670 |
| 2009 | 9,988 | 1,713 | 2,581 | 14,282 | 4,562 | 3,595 | 68,829 | 31,113 | 39,222 | 139,164 | 1,349 | 991 | 3,846 | 6,186 |
| 2010 | 10,324 | 1,803 | 2,682 | 14,809 | 4,372 | 3,572 | 73,267 | 32,702 | 41,611 | 147,580 | 1,402 | 969 | 3,835 | 6,206 |
| 2011 | 11,786 | 2,000 | 3,031 | 16,817 | 4,525 | 3,655 | 79,015 | 34,535 | 44,220 | 157,770 | 1,388 | 1,012 | 4,023 | 6,423 |
| Women | ||||||||||||||
| 1999 | NA | NA | NA | NA | NA | NA | 43,268 | 11,900 | 14,758 | 69,926 | NA | NA | NA | NA |
| 2000 | 6,887 | 697 | 1,236 | 8,820 | 3,274 | 2,532 | 45,747 | 12,675 | 16,244 | 74,666 | 1,083 | 649 | 2,278 | 4,010 |
| 2001 | 7,370 | 788 | 1,300 | 9,458 | 3,253 | 2,586 | 48,699 | 13,483 | 17,744 | 79,926 | 1,123 | 629 | 2,377 | 4,129 |
| 2002 | 8,425 | 821 | 1,484 | 10,730 | 3,595 | 2,701 | 52,291 | 14,519 | 19,457 | 86,267 | 1,175 | 667 | 2,466 | 4,308 |
| 2003 | 8,858 | 908 | 1,609 | 11,375 | 3,776 | 2,633 | 56,147 | 15,837 | 21,055 | 93,039 | 1,167 | 724 | 2,633 | 4,524 |
| 2004 | 8,875 | 875 | 1,713 | 11,463 | 3,896 | 2,787 | 59,892 | 17,146 | 22,917 | 99,955 | 1,174 | 654 | 2,629 | 4,457 |
| 2005 | 8,112 | 892 | 1,556 | 10,560 | 3,863 | 2,657 | 62,854 | 18,549 | 24,287 | 105,690 | 1,228 | 672 | 2,841 | 4,741 |
| 2006 | 8,423 | 854 | 1,633 | 10,910 | 3,866 | 2,707 | 66,025 | 19,824 | 25,695 | 111,544 | 1,302 | 716 | 2,921 | 4,939 |
| 2007 | 9,069 | 875 | 1,791 | 11,735 | 3,571 | 2,540 | 70,167 | 20,923 | 27,062 | 118,152 | 1,304 | 789 | 2,957 | 5,050 |
| 2008 | 9,903 | 914 | 1,823 | 12,640 | 3,656 | 2,724 | 75,069 | 21,999 | 28,568 | 125,636 | 1,295 | 756 | 3,028 | 5,079 |
| 2009 | 9,592 | 928 | 1,786 | 12,306 | 3,690 | 2,791 | 79,524 | 22,995 | 30,011 | 132,530 | 1,383 | 817 | 3,117 | 5,317 |
| 2010 | 9,934 | 959 | 1,805 | 12,698 | 3,798 | 2,767 | 84,146 | 24,088 | 31,280 | 139,514 | 1,449 | 882 | 3,294 | 5,625 |
| 2011 | 11,836 | 1,107 | 2,061 | 15,004 | 3,818 | 2,868 | 90,620 | 25,278 | 32,956 | 148,854 | 1,435 | 829 | 3,214 | 5,478 |
Abbreviations: CG0, no complications; CG1, minor complications; CG2, major complications; NA, not available.
Incidence
The trend in standardized incidence rate is shown in Figure 2, demonstrating an increasing incidence, with fluctuations. There is strong evidence of heterogeneity between calendar years (P<0.001). In absolute numbers, the incidence increased from approximately 18,000 new cases in year 2000 to almost 32,000 new cases in year 2011, corresponding to an average annual increase at approximately 5%. The men:women standardized rate ratio over the period was 1.25 (P<0.001). Approximately 75% of the persons with diabetes, slightly higher for women than for men, were without complications at diagnosis, and this proportion remained largely constant through the period of analysis (Table 2).
Figure 2.
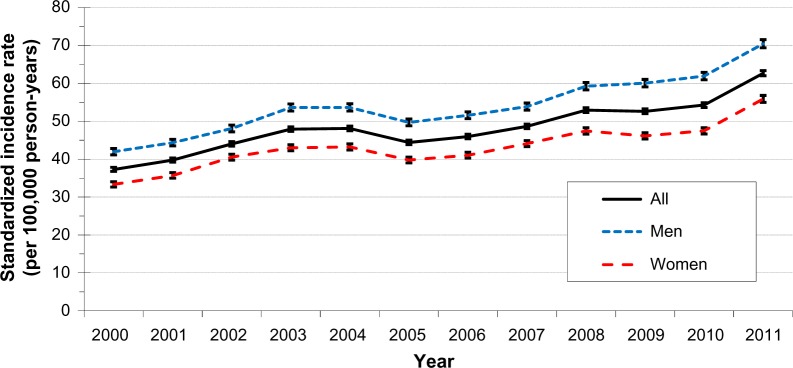
Standardized incidence rate of diabetes, 2000–2011, (per 100,000 person-years).
Complications
An increasing number of persons progressed to CG1 and CG2, respectively (Table 2), over the period. However, when taking into consideration the person-time at risk of developing these complications, the rate of developing complications decreased for both complication groups (Figure 3), mostly pronounced for the category of severe complications (CG2). These trends were statistically significant for men as well as for women (P<0.001). The rate of progression to CG1 was higher for men than for women, with a men:women standardized rate ratio at 1.37 (P<0.001), whereas the rate of progression to CG2 was more similar, yet statistically significantly different, for men and women with men:women standardized rate ratio at 1.03 (P<0.001).
Figure 3.
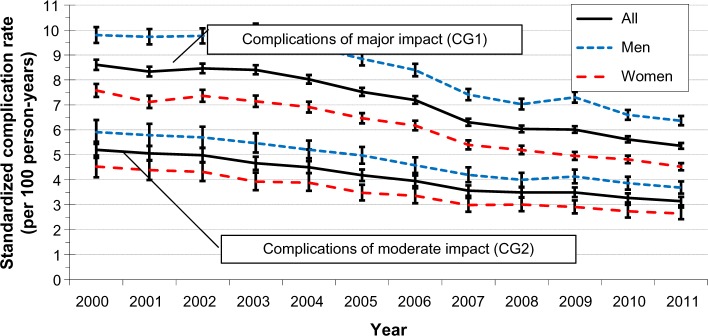
Standardized rate of developing complications, 2000–2011, (per 100 person-years).
Mortality
The number of deaths (regardless of cause of death) increased slightly from approximately 8,300 in year 2000 to almost 12,000 in year 2011 (Table 1). However, when taking into consideration the person-time at risk of dying in the various complication groups, the mortality rate decreased for both men and women and for all complication groups (Figure 4). Overall, the standardized mortality rate declined from 5.7 deaths per 100 person-years to 3.9 deaths per 100 person-years, corresponding with a decrease of 3% annually. The men:women standardized rate ratio was 1.29 (P<0.001). The mortality rate was lowest for CG0, with a decline in the rate from 2.9 to 2.0 deaths per 100 person-years (men:women standardized rate ratio: 1.27, P<0.001). The mortality rate was intermediate for CG1, with a decline in the mortality rate from 5.1 to 3.3 deaths per 100 person-years (men:women standardized rate ratio: 1.09, P<0.001). The mortality rate was highest for CG2, with a decline in the mortality rate from 11.4 to 7.4 deaths per 100 person-years (men:women standardized rate ratio: 1.15, P<0.001).
Figure 4.
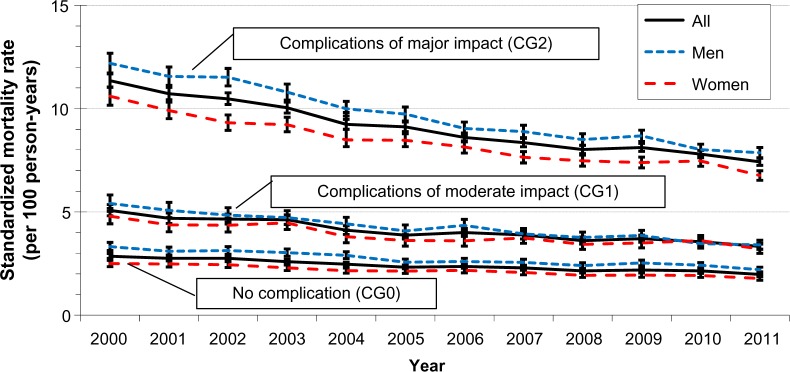
Standardized mortality rates by complication group, 2000–2011, (per 100 person-years).
Prevalence
The number of prevalent patients increased from approximately 140,000 patients at the end of the year 1999 to more than 300,000 at the end of the year 2011 (Table 2). The standardized prevalence proportion increased from 28 per 1,000 population 1999 ultimo to 52 per 1,000 population 2011 ultimo (Figure 5). For each of the years covered by the study, men had a statistically significant (P<0.001) higher prevalence proportion than women, with the men:women standardized proportion ratio ranging from 1.1 to 1.4. The relative prevalence of patients in CG0 fell slightly from approximately 58% at the end of 1999 to approximately 55% at the end of 2011 (Figure 6). This was caused by an increase in the proportion of patients in CG2 from less than 23% at the end of 1999 to more than 25% at the end of 2011, whereas the proportion of patients in CG1 was almost constant throughout the period of analysis. As compared with women, there were relatively fewer men in CG0 and relatively more men in both CG1 and CG2 (data not shown).
Figure 5.
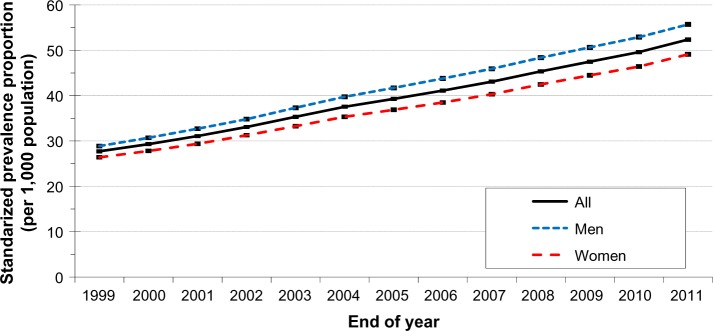
Overall standardized prevalence proportions from the end of 1999 to the end of 2011, (per 1,000 population).
Figure 6.
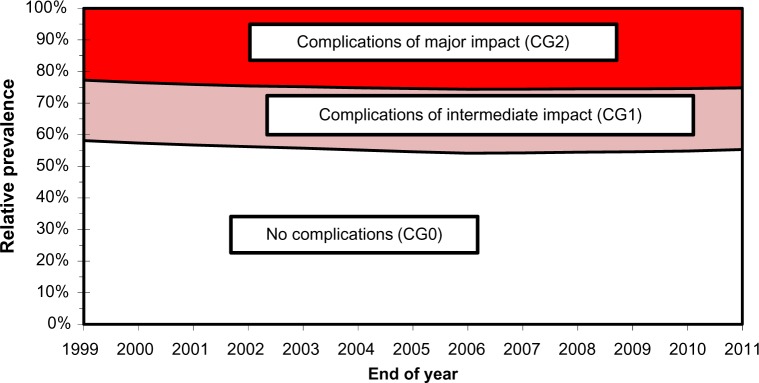
Relative prevalence by complication group from the end of 1999 to the end of 2011.
Discussion
We have used already existing national health register data to establish a comprehensive characterization of the central epidemiological features of diabetes in Denmark, with all advantages and limitations attached to this approach.
Data from the nationwide Danish health registers are generally considered to have a very high level of completeness in terms of coverage of all the relevant persons and activities.4 Furthermore, using already existing data collected for purposes independent of the study concerned reduces both bias and need to collect additional data. Nevertheless, a series of limitations are involved when using NDR and the other Danish health registers for research purposes.8 Thus, NDR may include up to 20% registrants who do not have diabetes. A sensitivity analysis with exclusion of these persons yields a reduction of approximately 30% for all key figures presented in Table 1, but with similar trends in the proportions and rates as found for the total material.
Another concern is that for more than 10% of the registrants, the operationally established date of diagnosis of diabetes is systematically biased toward too late a date.8 We have addressed this issue by using the full information available in DNPaR to establish the earliest possible date of registration with a diabetes-specific event.
Relevant data on diabetes and comorbidity captured in the primary health care sector are not available in NDR and DNPaR, including values of glycosylated hemoglobin as well as measurements of microalbuminuria and results of screening for diabetes eye complications. Such information would improve the classification of diabetic complications by severity.
The data extracted from the DNPaR may suffer from misclassifications and errors in coding practice, and in addition, cause omissions of otherwise relevant registrations; such errors may lead to misclassification of the date of onset of complications. Compared with previous epidemiological analyses based on NDR,11 our approach is novel as we attempted to assess complication status and categorize it by level of impact. Even though this may be questioned on clinical grounds, it seems to work at the group level as evidenced by the fact that the mortality level is higher for the group of patients with complications of moderate impact as compared with patients without complications, but is even higher in the group of patients with complications of severe impact.
With these limitations in mind, we believe our results accurately reflect the current trends in diabetes epidemiology in Denmark and extend previous epidemiological analyses based on NDR by confirming an increasing incidence level.11 Because the diagnosis of diabetes is established by means of the first occurrence of certain events, fluctuations in incidence occur as a consequence of changes in administrative practice, like reimbursement for services specific for patients with diabetes, but since the majority of patients are ascertained by hospital diagnoses or prescriptions with antidiabetic drugs, such explanation seems less likely.8 Alternatively, the increasing incidence level might be explained by increased awareness, leading to earlier diagnosis than in previous times. If so, it would be expected that the proportion of patients having signs of complications already at the time of diagnosis should decrease over time, but this is not the case, as evidenced in Table 2. Currently, no data are available to assess the impact of changes in overweight and obesity on the incidence rate of diabetes, thus making further investigations highly needed.
We find that the prevalence of diabetes is increasing exponentially as evidenced by the net influx to the population of patients with diabetes (ie, the difference between the annual number of new cases and the annual number of deaths), which is steadily increasing. Our study demonstrates that this trend is driven not only by an increasing incidence, but also by a decreasing trend in the risk of developing complications as well as a decreasing mortality level regardless of the presence of complications, but with most reduction among patients with severe complications. These trends have been observed also in subsets of patients attending the Steno Diabetes Center in Denmark and have been ascribed to intensified glycemic control in the patient population.12 In this perspective, the emerging so-called diabetes epidemic is partly a result of improved care. We believe that the trends seen in the Danish population may be generalized to other nations with similar socioeconomic characteristics.
Our results have demonstrated that for incidence, complication, and mortality rates as well as prevalence proportions, men have higher levels than do females. Concerning incidence rates and prevalence proportions, this pattern was also observed from the first epidemiological analyses on the basis of NDR data,11 but so far these observations remain unexplained.
Together with our previously published study on the validation of the NDR,8 the results of the present study provide the basis of additional studies. As part of the Diabetes Impact Study 2013, we will perform in-depth analysis of the relative importance of those factors that drive the prevalence and use such models to establish scenarios for the future evolution of the prevalence of diabetes in Denmark, in line with similar approaches in other communities.13 New insight into the future societal burden of diabetes will be obtained by combining epidemiological data with information on patients’ demographic, ethnic, and socioeconomic characteristics as well as estimates of costs attributable to diabetes within categories characterized by age, sex, and complication status.
Conclusion
The prevalence of patients with diabetes registered in Denmark is rising exponentially due to the synergistic effect of increasing incidence combined with decreasing rate of developing complications as well as decreasing mortality in the patient population. Further studies will seek to quantify the relative importance of these factors, and this will enable for establishment of scenarios for estimating the future burden of diabetes.
Acknowledgments
This study has been conducted on behalf of the Danish Diabetes Association by ApEHR and supported by a PhD program at COHERE, supported by the Danish Centre for Strategic Research in Type 2 Diabetes, DD2. Jacob Grauslund (Department of Ophthalmology, Odense University Hospital, Denmark) and Jan Erik Henriksen (Department of Endocrinology, Odense University Hospital, Denmark) are thanked for consultative advice concerning classification of diabetes complications by means of codes used in clinical and administrative practice. The authors thank Sabrina I Imeroski for editorial assistance.
Footnotes
Author contributions
Anders Green: leading role in conception and design, acquisition of data, data analysis, interpretation of data, and drafting and revising the article. Camilla Sortsø: major contributory role in acquisition of data, data analysis, interpretation of data, and a major role in drafting and revising the article. Peter Bjødstrup Jensen: leading role in data management and data analysis, and a contributory role in drafting and revising the article. Martha Emneus: major role in conception and design, acquisition of data, data analysis, interpretation of data, and a contributory role in drafting and revising the article. All authors gave final approval of the version to be published, and agree to be accountable for all aspects of the work.
Disclosure
The authors report no conflicts of interest in this work.
References
- 1.Wild S, Roglic G, Green A, Sicree R, King H. Global prevalence of diabetes: estimates for 2000 and projections for 2030. Diabetes Care. 2004;27:1047–1053. doi: 10.2337/diacare.27.5.1047. [DOI] [PubMed] [Google Scholar]
- 2.International Diabetes Federation . Diabetes Atlas Sixth Edition. Brussels, Belgium: IDF; 2013. [Accessed October 5, 2014]. Available from: http://www.idf.org/sites/default/files/EN_6E_Atlas_Full_0.pdf. [Google Scholar]
- 3.Carstensen B, Kristensen JK, Marcussen MM, Borch-Johnsen K. The National Diabetes Register. Scand J Public Health. 2011;39(Suppl 7):S58–S61. doi: 10.1177/1403494811404278. [DOI] [PubMed] [Google Scholar]
- 4.Thygesen LC, Daasnes C, Thaulow I, Brønnum-Hansen H. Introduction to Danish (nationwide) registers on health and social issues: structure, access, legislation, and archiving. Scand J Public Health. 2011;39(Suppl 7):S12–S16. doi: 10.1177/1403494811399956. [DOI] [PubMed] [Google Scholar]
- 5.Lynge E, Sandegaard JL, Rebolj M. The Danish National Patient Register. Scand J Public Health. 2011;39(Suppl 7):S30–S33. doi: 10.1177/1403494811401482. [DOI] [PubMed] [Google Scholar]
- 6.Kildemoes H, Sørensen H, Hallas J. The Danish National Prescription Registry. Scand J Public Health. 2011;39(Suppl 7):S38–S41. doi: 10.1177/1403494810394717. [DOI] [PubMed] [Google Scholar]
- 7.Andersen JS, Olivarius Nde F, Krasnik A. The Danish National Health Service Register. Scand J Public Health. 2011;39(Suppl 7):S34–S37. doi: 10.1177/1403494810394718. [DOI] [PubMed] [Google Scholar]
- 8.Green A, Sortsø C, Jensen PB, Emneus M. Validation of the Danish National Diabetes Register. Clin Epidemiol. 2015;7:5–15. doi: 10.2147/CLEP.S72768. [DOI] [PMC free article] [PubMed] [Google Scholar]
- 9.Pedersen CB. The Danish Civil Registration System. Scand J Public Health. 2011;39(Suppl 7):S22–S25. doi: 10.1177/1403494810387965. [DOI] [PubMed] [Google Scholar]
- 10.Statistics Denmark . Demographic Tables of the Danish Population. Copenhagen, Denmark: Statistics Denmark; 2014. [Accessed October 5, 2014]. Available from: http://www.statistikbanken.dk/statbank5a/default.asp?w=1366. [Google Scholar]
- 11.Carstensen B, Kristensen JK, Ottosen P, Borch-Johnsen K, Steering Group of the National Diabetes Register The Danish National Diabetes Register: trends in incidence, prevalence and mortality. Diabetologia. 2008;51:2187–2196. doi: 10.1007/s00125-008-1156-z. [DOI] [PubMed] [Google Scholar]
- 12.Færch K, Carstensen B, Almdal TP, Jørgensen ME. Improved survival among patients with complicated type 2 diabetes in Denmark: a prospective study (2002–2010) J Clin Endocrinol Metab. 2008;99:E642–E646. doi: 10.1210/jc.2013-3210. [DOI] [PubMed] [Google Scholar]
- 13.Maruthur NM. The growing prevalence of type 2 diabetes: increased incidence or improved survival? Curr Diab Rep. 2013;13:786–794. doi: 10.1007/s11892-013-0426-4. [DOI] [PubMed] [Google Scholar]