



Abstract
The synaptotagmin (Syt) family of proteins plays an important role in vesicle docking and fusion during Ca2+-induced exocytosis in a wide variety of cell types. Its role as a Ca2+ sensor derives primarily from its two C2 domains, C2A and C2B, which insert into anionic lipid membranes upon binding Ca2+. Syt isoforms 1 and 7 differ significantly in their Ca2+ sensitivity; the C2A domain from Syt7 binds Ca2+ and membranes much more tightly than the C2A domain from Syt1, due at least in part to greater contributions from the hydrophobic effect. While the structure and membrane activity of Syt1 have been extensively studied, the structural origins of differences between Syt7 and Syt1 are unknown. The present study used site-directed spin labeling and electron paramagnetic resonance spectroscopy to determine depth parameters for the Syt7 C2A domain, for comparison to analogous previous measurements with Syt1 C2A. In a novel approach, the membrane docking geometry of both Syt1 and Syt7 C2A was modeled by mapping depth parameters onto multiple molecular dynamics simulated structures of the Ca2+-bound protein. The models reveal membrane penetration of Ca2+ binding loops (CBLs) 1 and 3, and membrane binding is more sensitive to mutations in CBL3. On average, Syt7 C2A inserts more deeply in the membrane than Syt1 C2A, although depths vary among the different structural models. This observation provides a partial structural explanation for the hydrophobically driven membrane docking of Syt7 C2A.
Keywords: protein-lipid interaction, membrane bound structure, calcium signaling, exocytosis, power saturation
Synaptotagmins (Syt) are a family of proteins characterized by their membrane targeting C2 domains. Syt proteins contain a transmembrane helix which anchors a cytoplasmic region consisting of two C2 domains (C2A and C2B) connected by a short linker.1, 2 Each C2 domain is composed of two four-stranded β-sheets forming a β-sandwich structure with three flexible Ca2+ binding loops, although not all Syt C2 domains bind Ca2+.3, 4 There are 17 human isoforms of Syt, eight of which show varying degrees of Ca2+ binding affinity.5–7 The individual C2 domains of each Syt exhibit a variety of affinities; for example, Syt1 C2A binds anionic lipids such as phosphatidylserine (PS) nonspecifically in the presence of Ca2+, while Syt1 C2B additionally binds phosphatidylinositol 4,5-bisphosphate (PIP2) in a partially Ca2+-independent fashion.8–12 Syt1 C2B may additionally interact with the soluble N-ethylmaleimide-sensitive fusion protein attachment receptor (SNARE) protein SNAP25 in a manner proposed to inhibit vesicle fusion prior to Ca2+ influx.13–15 Influx of Ca2+ into the cytoplasm releases the fusion clamp and triggers membrane insertion by the two Syt C2 domains, thereby accelerating vesicle fusion.1, 6, 14 The mechanism by which this happens is unknown but believed to rely on the membrane insertion and bending activity of Syt; mutations that disrupt C2 domain membrane interactions also decrease exocytosis.16–19 Thus, a better understanding of the structural mechanism of Syt C2 domain membrane binding is central to a fuller description of exocytosis.
Much of what is currently known about the structure of membrane-bound Syt comes from studies using electron paramagnetic resonance (EPR) spectroscopy. EPR detects the relaxation of unpaired electrons excited by incident microwaves within a magnetic field of 8–10 GHz. Incorporation of unpaired electrons into a protein of interest involves an established approach known as site-directed spin labeling,20 in which unique cysteine residues are introduced at locations of interest on the target protein through site-directed mutagenesis. A nitroxide spin label such as MTSSL is then attached through formation of a disulfide bond to the engineered cysteine. EPR spectra are useful for observing local environmental interactions with the unpaired nitroxide electron, and an application termed continuous wave power saturation is capable of measuring protein-membrane docking geometry.21, 22 Power saturation relies on the accessibility of a spin label to various paramagnetic probes. EPR signal amplitude increases linearly with the square root of incident power up to a saturation point, which is dependent on the relaxation rate of the spin label. Heisenberg spin exchange between the spin label and extrinsic paramagnetic probes increases the relaxation rate; thus, power saturation measurements reveal the relative accessibility of the spin label to each paramagnetic probe. Paramagnetic probes with differing concentration gradients in a membrane such as O2 (predominantly in the membrane interior) and nickel ethylenediamine diacetic acid (NiEDDA, excluded from the membrane) allow for the calculation of membrane depth parameters (Φ). The depth parameters from a library of spin-labeled protein variants can be mapped onto a known structure of the protein in order to calculate an optimized membrane docking geometry to fit the experimental results.21
To date the most extensively studied member of the Syt family is Syt1, which acts as a Ca2+ sensor for the fast synchronous release of synaptic vesicles in neuronal cells. This is the fastest known membrane fusion event, occurring in the μs to ms timescale.1, 23, 24 Previous EPR power saturation studies have revealed the membrane docking geometries of Syt1 C2A and C2B, both individually and in the context of the C2AB tandem.25–27 In agreement with qualitative studies based on fluorescence changes,28, 29 these EPR measurements demonstrated that both Syt1 C2A and C2B insert more deeply into membranes in the context of the C2AB tandem.30 The precise mechanism by which C2A-C2B copenetration occurs is unknown. Interestingly, EPR experiments utilizing double electron-electron resonance (DEER) distance measurements of Syt1 C2AB fragments have yielded models requiring the CBLs of C2A and C2B to be oriented in opposite directions when membrane bound, consistent with this protein’s observed ability to induce negative curvature in membranes.31 By contrast, the isolated Syt1 C2A domain binds membranes via a combination of electrostatic and hydrophobic interactions, dominated by electrostatic contacts within the polar headgroup region.25, 32, 33 Its docking geometry shows membrane penetration by CBLs 1 and 3, with CBL1 located entirely within the headgroup region and CBL3 inserting somewhat more deeply.25 Each of these loops contains a single hydrophobic residue at its apex: M173 on loop 1 and F234 on loop 3 of Syt1. Intriguingly, while F234 is conserved among all stimulatory Syt isoforms, M173 is somewhat variable, for example corresponding to Phe in Syt7 and Ser in Syt3.6, 7 It is not yet known whether the membrane binding properties of Syt1 are common to other Syt isoforms.
Presumably, the variability among Syt isoforms is indicative of the various and complex functions this family of proteins has evolved to fill.34 Syt7, although not as well studied as Syt1, performs many important functions. In particular, Syt7 is involved in the regulation of insulin secretion in pancreatic β-cells. Dysregulation of insulin secretion has been implicated in the development of type 2 diabetes and in part efforts to further understand the underlying factors of this disease has lead to research into the structure and function of this protein.35, 36 Similar to Syt1 C2A, Syt7 C2A binds nonspecifically to anionic lipid head groups through electrostatic interactions with no particular affinity for PIP2 beyond simple electrostatic interactions.37 The Syt7 C2A domain, however, is sensitive to much lower concentrations of Ca2+ and also exhibits a 60-fold slower membrane dissociation rate compared to Syt1 C2A.37, 38 We have previously shown that the slower off rate of Syt7 C2A can be attributed in part to a stronger hydrophobic component of the Syt7 C2A docking mechanism, and we hypothesized that this is mainly due to deeper membrane penetration by F167 on CBL1.37
Here, we test our previous hypothesis by measuring the docking geometry of the Syt7 C2A domain using methods analogous to those previously used for Syt1 C2A. We report depth parameters for 13 separate spin-labeled mutants, including key locations in CBLs 1 and 3. These data are interpreted by modeling docking geometry based on these depth parameters and five protein structures: three from a molecular dynamics simulation of Ca2+-bound Syt7 C2A, and two for comparison from a publically accessible Ca2+-free solution NMR structure. The results suggest a somewhat deeper membrane penetration for the isolated Syt7 C2A compared to Syt1 C2A, anchored primarily via CBL3 and secondarily by CBL1. The companion paper describes molecular dynamics simulations of Syt7 C2A binding to a lipid bilayer, revealing a balance between hydrophobic and electrostatic effects.
Experimental Methods
Materials
All materials were reagent grade unless otherwise specified. Synthetic lipids 1-palmitoyl-2-oleoyl-sn-glycero-3-phosphocholine (phosphatidylcholine, POPC, PC) and 1-palmitoyl-2-oleoyl-sn-glycero-3-phosphoserine (phosphatidylserine, POPS, PS) were obtained from Avanti Polar Lipids (Alabaster, AL) in chloroform. The spin label 1-oxyl-2,2,5,5-tetramethyl-Δ3-pyrroline-3-methylmethanethiosulfonate (MTSSL, R1) was from Toronto Research Chemicals. Fluorescein-5-maleimide was from AnaSpec (Fremont, CA). Doxyl lipids 1-palmitoyl-2-stearoyl-(12-doxyl)-sn-glycero-3-phophocholine (12-doxyl PC), 1-palmitoyl-2-stearoyl-(10-doxyl)-sn-glycero-3-phophocholine (10-doxyl PC), 1-palmitoyl-2-stearoyl-(7-doxyl)-sn-glycero-3-phophocholine (7-doxyl PC), and 1-palmitoyl-2-stearoyl-(5-doxyl)-sn-glycero-3-phophocholine (5-doxyl PC) were from Avanti Polar Lipids. N-[5-(dimethylamino)naphthalene-1-sulfonyl]-1,2-dihexadecanoyl-sn-glycero-3-phosphoethanolamine (dansyl-PE, dPE) was from Life Technologies.
Protein Mutagenesis, Expression, Spin Labeling, and Purification
The initial goal for protein mutagenesis was to create a cysteine-free (cysless) variant of Syt7 C2A, so that unique cysteine residues could be introduced at desired positions. A GST-fused C2A expression construct encompassing residues N135-S266 was cloned from cDNA (ATCC: 11045721) as previously described.37 Mutations were generated using the QuikChange II XL (Agilent) site directed mutagenesis kit using the manufacturer’s protocol. The cysless mutant of Syt7 C2A, C260S, was used as the parent DNA for developing a library of single cysteine mutants. A total of 17 single cysteine mutants were created at the positions listed in Table 1. All mutations were verified by primer-extension sequencing of the full C2A coding sequence.
Table 1.
Measured rate constants for kinetic measurements
| Species | koff (s−1)a | koff relative to C260S | kobs for binding (s‐1)b | kobs relative to C260S |
|---|---|---|---|---|
| Wild Type | 26 | 1.5 | 27 | 0.47 |
| C260S (cysless) | 17 | 1 | 57 | 1 |
| L136R1 | 19 | 1.1 | 35 | 0.61 |
| Q148R1 | 20 | 1.2 | 27 | 0.47 |
| A164R1c | 21 | 1.2 | 18 | 0.32 |
| F167R1 | 27 | 1.6 | 52 | 0.91 |
| S168R1 | 34 | 2.0 | 29 | 0.51 |
| G169R1 | 19 | 1.1 | 25 | 0.44 |
| T170R1 | 19 | 1.1 | 51 | 0.89 |
| N195R1 | 33 | 1.9 | 65 | 1.14 |
| L196R1 | 38 | 2.2 | 60 | 1.05 |
| L224R1 | 35 | 2.1 | 34 | 0.60 |
| Y226R1c | 69 | 4.1 | 5 | 0.09 |
| R228R1 | 24 | 1.4 | 73 | 1.28 |
| F229R1c | 69 | 4.1 | 34 | 0.60 |
| R231R1 | 16 | 0.9 | 50 | 0.88 |
| N232R1 | 23 | 1.4 | 34 | 0.60 |
| P234R1 | 21 | 1.2 | 65 | 1.14 |
Measured by rapid addition of excess EDTA to pre-formed protein/Ca2+/liposome complex
Measured by rapidly mixing protein and liposomes in the presence of excess Ca2+
Species excluded from further study due to aberrant kinetics
Each single mutant was expressed as a fusion protein with a GST tag and purified via a glutathione affinity resin (GE Healthcare) as previously described, including elution with assay buffer (140 mM KCl, 25 mM HEPES, 15 mM NaCl, 0.5 mM MgCl2, pH 7.4) following thrombin cleavage between the GST and C2A domains.37 Labeling with the methanethiosulfonate spin label (MTSSL) was achieved by incubating protein with MTSSL either 1 hr at 4 °C while the GST-C2A fusion protein was bound to the resin, or overnight at 4 °C following thrombin cleavage and elution, with approximately equivalent labeling efficiencies of >75% obtained in either case (Figure S1). Protein purity was verified by SDS-PAGE and ultraviolet absorbance spectroscopy. Due to the positive charge on Syt 7 C2A, contamination with nucleic acids is sometimes observed and can interfere with protein-lipid binding.39 Thus, high-salt washes were included in the column purification protocol. We note that this removal was more critical for kinetic measurements of protein-membrane association than for EPR measurements. Only samples with an OD260/OD280 ratio of ≤ 1.0, indicating only minor levels of contamination, were determined to be acceptable. Any purified proteins showing a ratio greater than 1.0 were further treated with benzonase (Sigma) for 1 h at 25 °C and a new spectrum recorded to confirm the removal of nucleic acid. EPR measurements are less sensitive to nucleic acid contamination due to the long time period over which measurements are taken, allowing proteins to be in equilibrium with the large excess of lipid vesicles. Concentrations were calculated from OD280 measurements using an extinction coefficient of 14280 M−1 cm−1.
Preparation of Lipid Vesicles
Lipids in chloroform were mixed in the appropriate molar ratio, dried under N2, and then placed under vacuum for 2 h in order to remove all traces of solvent. Dried lipids were then hydrated with assay buffer. Small unilamellar vesicles (SUV) were then generated through probe sonication, stored at 4 °C for no more than 7 days, and allowed to equilibrate overnight at 25 °C prior to EPR measurement. Vesicle stock solutions for EPR were prepared with a molar ratio of 75:25 POPC:POPS and a total lipid concentration of 80 mM; vesicle stocks for kinetic measurements consisted of 75:20:5 POPC:POPS:dansyl-PE in order to maintain 25% anionic content, and a total lipid concentration of 3 mM.
Stopped Flow Kinetic Measurements
Membrane association and dissociation rates were measured using a BioLogic SFM-3000 stopped-flow fluorescence spectrometer essentially as outlined previously.37 Briefly, protein-to-membrane fluorescence resonance energy transfer (FRET) was measured between Trp residues in the C2 domain and dansyl-PE lipids included in vesicles. Association measurements were performed by rapidly mixing protein and vesicles in the presence of 200 μM CaCl2, and dissociation measurements were performed following rapid addition of 1 mM EDTA to pre-formed protein-lipid complexes. Protein-to-accessible lipid ratios were maintained at 1:100 for kinetic measurements, including 1 μM protein and 100 μM total accessible lipid in all association measurements (all concentrations after mixing). Observed association rates were fit to equations of the form
| (1) |
where kobs is the apparent association rate constant, ΔFmax is the amplitude of the fluorescence change, and C is an offset. Dissociation profiles were subjected to nonlinear least-squares fitting to a single- or double-exponential function (Eq 2 or 3, respectively):
| (2) |
| (3) |
where the koff are dissociation rate constants and C is an offset. Except where otherwise noted, dissociation profiles for mutants were single-exponential.
Measuring EPR Spectra
An EPR spectrum was recorded for each single cysteine variant using a Bruker ELEXSYS E500 spectrometer (9.4 GHz) with a loop gap resonator (Medical Advances). Each sample consisted of 30–150 μM MTSSL-labeled Syt7 C2A, 1.5–2.0 mM CaCl2, and either no lipids present for unbound spectra or 3:1 POPC:POPS lipids for bound spectra. Although this results in Ca2+ concentrations higher than physiological (typically ~10–500 μM, depending on cell type and stimulus), the C2A domain binds up to 3 Ca2+ ions and so at least a 3-fold molar excess is required in order to saturate membrane binding.40 A high total lipid concentration of 30 mM (15 mM accessible), similar to previous EPR studies,25, 41, 42 was used in order to minimize the possibility of spin-spin interactions between the MTSSL tags of bound Syt7 C2A domains. This corresponds to a protein:accessible lipid ratio of between 1:100 and 1:500. Measurements were performed at 2.0 mW incident power with a minimum of 5 scans of 100 G. EPR spectra were normalized to their second integral representing the total number of spins. This technique has proven effective in previous studies for comparing spectra of varying spin label concentrations particularly when comparing bound and unbound states.41, 42
Continuous Wave Power Saturation Measurements
Each sample was loaded into a gas-permeable TPX capillary tube (Medical Advances). Power saturation curves were measured between 0.2 mW and 50 mW taking saturation measurements at predefined intervals, over 30 G with at least 2 scans per interval. Power saturation curves for each sample were measured under three separate conditions: (1) atmospheric oxygen (20%), (2) after equilibration under N2 for 15 min, and (3) after addition of 10 mM NiEDDA and equilibration under N2 for 15 min. All three accessibility measurements for a single protein were taken on the same day in order to minimize slight variations in sample preparation instrument (resonator) performance. The measurements include n-doxyl PC standards measured under the same conditions (temperature, buffer, and [Ni2+]) as the protein samples. Amplitudes were plotted as a function of microwave power squared and fit using Kaleidagraph to the equation:21, 22
| (4) |
where A represents the peak-to-peak amplitude of the signal, C is a scaling factor, P is the microwave power, P1/2 is the power at which half saturation occurs, and ε is the measure of homogeneity of saturation. Accessibility parameters were then calculated as follows:21, 22
| (5) |
where X represents either O2 or NiEDDA paramagnetic species, Π(X) represents the accessibility parameter for the given species, and ΔHpp is the average peak to peak line width over the linear region of the power saturation curve. Depth parameters were then calculated from the following equation:
| (6) |
where Φ is the depth parameter. Errors on each Π and Φ measurement were calculated from the standard errors of P1/2 and ΔHpp values. The depth parameter was measured at least twice for each mutant and three times if the first two measurements differed by more than 0.4 in value. Final values reported are weighted averages and 95% confidence interval (CI) among repeat measurements.
Modeling Docking Geometry
The experimental membrane docking geometry for Syt7 C2A was determined by first modeling the locations of MTSSL spin labels and subsequently fitting to obtain a best-fit docking geometry based on the measured depth parameters for each spin labeled mutant. Allowed configurations of MTSSL sidechains were modeled using the MTSSL Wizard plugin for PyMol (Schrödinger).43 Initial estimated coordinates for each nitroxide nitrogen (on which the free electron resides)44 were determined by averaging the coordinates among all allowed conformations of the MTSSL tag. For the 2–5 positions at which no conformers were found using the “tight” settings of MTSSL Wizard, individual side-chain dihedral angles were defined manually to yield conformations with no structural clashes. These coordinates were then used for fitting depth parameters to a hyperbolic tangent function:
| (7) |
where A and D represent the bulk values of Φ in water and hydrocarbon, C sets the inflection point of the curve, B determines the slope and, dm represents the distance of each MTSSL spin label from the phosphate plane. As in previous studies, fits were constrained such that (D – A) = 4.5. For doxyl lipid standards, dm is the published value,45 and for MTSSL labels, dm is given by:
| (8) |
where (x,y,z) are the starting coordinates of the MTSSL nitrogen for each sidechain. Fitting of depth parameter data to Eqs. (7) and (8) yields an optimized docking geometry of the protein to a lipid bilayer in the xz plane, where y = 0 is the average phosphate position of the proximal leaflet. This optimized docking geometry can be obtained by sequentially (1) rotating the coordinates around the x axis by the best-fit angle θx, (2) rotating the coordinates around the z axis by the best-fit angle θz and (3) translating along the y axis by the best-fit distance ytrans. After a first round of fitting using the average MTSSL coordinates, any residues that were outliers to the hyperbolic tangent fit (more than 2 × 95% CI from the predicted Φ value) were then sequentially adjusted to a defined sidechain conformation with dihedral angles (χ) that were both (1) sterically allowed for the position and (2) low-energy based on a previous study of MTSSL conformations in solution.46 Such adjustment was performed beginning with the farthest outliers and repeated until any further changes provided negligible improvement to the fit. The positions whose rotamer conformations were adjusted during the iterative fitting process were as follows: for Structure A, G169, N195, and L196; for Structure B, F167 and G169; for Structure C, F167 and G169; for NMR state 1, F167, G169, and L196; and for NMR state 2, G169 and S168. The dihedral angles used for each final model are given in Table S1; for the remaining majority of positions, the average coordinates from MTSSL Wizard were used. Five models were created using this method: three based on starting protein structures taken from a molecular dynamics simulation of Ca2+-bound Syt7 C2A in the absence of membrane (snapshots at 6 ns, 8 ns, and 10 ns of a simulation described in the accompanying paper), and two based on starting Ca2+-free structures from the protein data bank (2D8K, states 1 and 2). Each final self-consistent model is constrained by equations 7 and 8, experimental depth parameters, doxyl lipid calibration data, and the corresponding structure of Syt7 C2A.
Reanalysis of published Syt1 C2A EPR data was carried out analogously, starting with states 1–3 of structure 1BYN47 as well as three snapshots of a molecular dynamics simulation described in the companion paper; any manually adjusted dihedral angles are listed in Table S2.
Results
Site selection, protein purification, and MTSSL labeling
The process of protein site directed spin labeling introduces an unpaired electron through the MTSSL nitroxide spin label (Figure 1). The spin label attaches through a disulfide bond to any accessible cysteine; therefore, native cysteine residues must first be removed in order to selectively label cysteine residues at the desired locations of interest. The only native cysteine in our wild-type expression construct was Cys260 near the C-terminus; this residue occurs at the beginning of the flexible C2A-C2B linker region in native human Syt7. A cysless (C260S) variant of Syt7 C2A was thus generated as a template for the creation of single cysteine mutants. The positions selected for site directed spin labeling in Syt7 C2A are analogous to positions used in a previous EPR power saturation study with Syt1 C2A.25 This strategy allows for direct comparisons between Syt7 and Syt1. Spin labeled positions are summarized in Table 1 covering 16 sites on or near the Ca2+ binding loops 1 and 3 of Syt7 C2A, with one negative control (Q148R1) opposite the binding site.
Figure 1.

Spin labeling of Syt7 C2A. A: Solution NMR structure of Syt7 C2A (PDB ID: 2D8K). Yellow spheres indicate residues selected for spin labeling in this study. B: Structure of the MTSSL tag, with dihedral angles χ1 – χ5 indicated.
WT, cysless, and single cysteine mutants were purified through glutathione affinity chromatography of a GST-linked protein followed by cleavage of the GST with thrombin. Nucleic acid contamination was removed to a level deemed acceptable for stopped flow kinetic measurements, and more than sufficient for equilibrium EPR measurements (see Methods). MTSSL spin labels were attached either during or after purification, with a labeling efficiency of ≥ 75% in either case (Figure S1).
Effects of Spin Labeling on Syt7 C2A Docking Function
The methanethiosulfonate R1 spin label is a moderate polarity group that has minimal effect on membrane protein docking structure as shown in previous EPR studies.41, 48 Here, we used an established protein-to-membrane FRET assay to examine the kinetics of membrane binding and dissociation of each spin-labeled mutant, for comparison to the wild type and cysless Syt7 C2A. Spin-labeled mutants that produced association and dissociation rate constants within a factor of 2.7 relative to the C260S (cysless) mutant (equivalent to molar activation energies within the range ± RT) were considered to have negligible effects on docking and were used for EPR studies. Summarized in Table 1 are the off and on rates for wild type, cysless, and each single-cysteine mutant.
The wild-type Syt7 C2A domain produced an observed association rate constant of 27 s−1 and an EDTA-induced dissociation rate constant of 26 s−1, using the liposomes here composed of 75% POPC, 20% POPS, and 5% dansyl-PE. This is a significantly slower association and somewhat faster dissociation than we reported previously for this protein domain and a more complex physiological lipid mixture.37 These differences could arise from additional favorable interactions with other components of the physiological lipid mixture and are currently under investigation. However, we have also observed significant variability even with nominally identical lipid compositions, presumably due to batch differences in lipid stock concentration or homogeneity. The origins of this variability are currently under investigation. For the present study, all comparisons of on rates or off rates are between measurements made using the same preparation of liposomes. Cysless (C260S) exhibited a ~30% slower dissociation and ~2-fold faster association relative to wild-type. Viewed in the context of activation energies, 2-fold differences in rate constants are minor; moreover, C260 resides in a flexible C-terminal tail of the protein construct used for these experiments (and in the C2A-C2B linker of the full-length protein), so the difference in on-rate is unlikely to represent a fundamental change in the C2A domain.
Nine of the mutants agreed within ≤ 2-fold of both the off and on rates for cysless. Four variants (G169R1, L196R1, L224R1, and Q148R1) had either on or off rates that were between 2- and 2.7-fold faster or slower than cysless. Two mutations, Y226R1 and A164R1, slowed association kinetics by > 2.7-fold; the reason for the differences is unknown. F229R1 showed normal association kinetics but dissociated > 2.7-fold faster than cysless, suggesting that this residue on the apex of CBL3 is essential for membrane penetration. One mutant (I235R1) had no observable kinetics, which could be due to the interior location of this residue causing the mutant protein to misfold; we note the purification yields of this mutant were also extremely low. Thus, these four mutations (F229R1, A164R1, Y226R1, and I235R1) were considered perturbing to the normal function of the Syt7 C2A protein and were excluded from further study. R228R1 and R231R1 were observed to have biphasic association profiles; however, in both of these cases the faster component was within 2-fold of wild-type and had a >3-fold greater amplitude than the slow component. The origin of the slow, low-amplitude FRET increase upon binding is unclear but could arise from either (a) a small population that binds more slowly due to alternative folding or nucleic acid contamination, which would not impact EPR measurements significantly due to the high lipid concentrations and much longer measurement timescale (minutes – hours), or (b) slow vesicle aggregation, which would not affect EPR measurements due to the much smaller protein-to-lipid ratio used in EPR samples.
EPR lineshape analysis
As a qualitative measure of changes in the local environment around a spin label during membrane docking, continuous wave EPR spectra were measured for the 13 spin-labeled mutants included in the docking model. Both bound and unbound spectra were measured for each mutant and are shown in Figure 2. As a reference, doxyl lipid EPR spectra are displayed in Figure S2. Bound protein spectra included 3:1 POPC:POPS liposomes with 30 mM total lipid concentration and excess Ca2+, conditions that allow for essentially complete membrane docking of Syt7 C2A. Unbound spectra were measured prior to addition of lipid but were otherwise equivalent to the corresponding bound sample.
Figure 2.
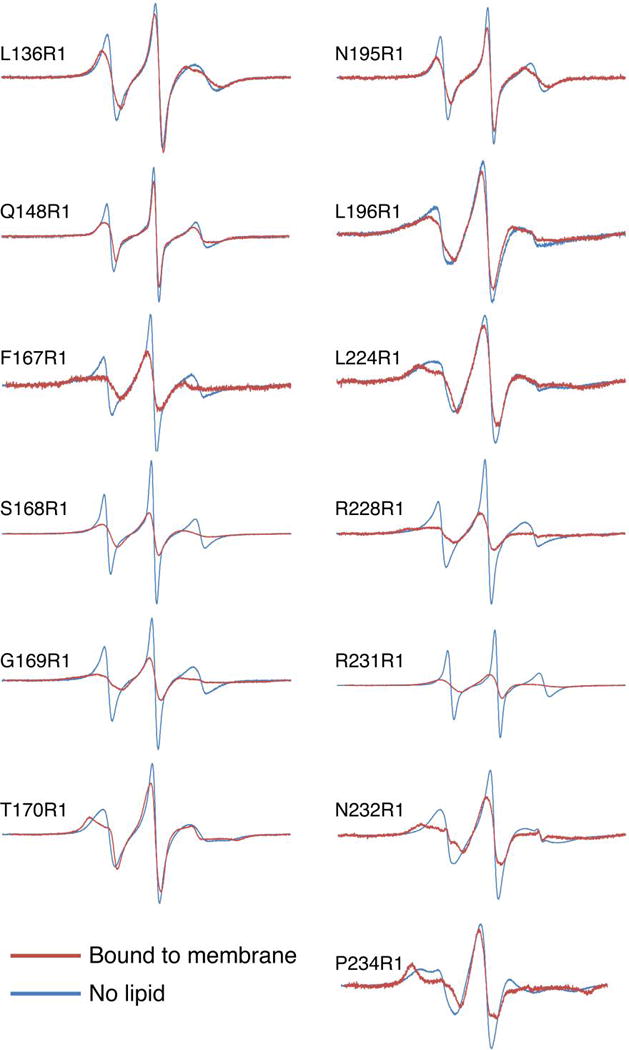
Bound and unbound EPR spectra for each spin-labeled mutant. Bound spectra (red) were measured with 30–150 μM protein and 30 mM (3:1 PC:PS) lipid membrane concentration with 1.5 – 2.0 mM Ca2+. Unbound spectra (blue) were measured with similar protein concentrations but in free solution with identical Ca2+ concentration. Signal broadening is indicative of a less mobile spin label.
The spin-labeled mutants of positions in CBL1 and CBL3 display the greatest degree of signal broadening in the bound state compared to the unbound state: F167R1, S168R1, G169R1, R228R1, and R231R1 (Figure 2). Signal broadening generally indicates decreased mobility of the MTSSL tag, likely due in these cases to contact with lipids as the CBLs penetrate the membrane. The remainder of the spin-labeled mutants showed varying degrees of signal broadening upon lipid addition, indicating lipid contact and/or loss of protein rotational freedom upon docking to the vesicles.
Depth Parameters of Syt7 C2A
EPR power saturation was performed in order to measure the depth parameters for each of the 13 spin labeled positions on Syt7 C2A as well as four doxyl-PC lipids with spin labeled acyl chains at the 5, 7, 10, and 12 carbons. Doxyl-PC lipids have a known depth within the lipid membrane and are useful in calibrating the hyperbolic tangent fit used to translate depth parameters into physical depths.45 Table 2 summarizes the depth parameters along with the O2 and NiEDDA accessibility parameters used to calculate the depth parameters. Positive depth parameters are indicative of more deeply penetrated spin labels, while depth parameters < −1 correspond to positions in the bulk aqueous phase.
Table 2.
Probe accessibility and depth parameters for doxyl lipids and spin-labeled C2A domains
| Sample Type | Π (O2)a | Π (NiEDDA)a | Φb |
|---|---|---|---|
| L136R1 | 1.37 ± 0.10 | 7.39 ± 0.23 | −1.59 ± 0.18 |
| Q148R1 | 2.99 ± 0.24 | 12.66 ± 0.58 | −1.38 ± 0.21 |
| F167R1 | 3.19 ± 0.34 | 2.25 ± 0.31 | 0.27 ± 0.19 |
| S168R1 | 3.32 ± 0.21 | 1.06 ± 0.25 | 1.12 ± 0.30 |
| G169R1 | 2.18 ± 0.16 | 3.49 ± 0.26 | −0.43 ± 0.17 |
| T170R1 | 1.67 ± 0.49 | 12.01 ± 0.91 | −1.85 ± 0.40 |
| N195R1 | 1.86 ± 0.17 | 11.70 ± 0.59 | −1.83 ± 0.20 |
| L196R1 | 2.19 ± 0.31 | 14.55 ± 0.64 | −1.89 ± 0.21 |
| L224R1 | 1.41 ± 0.23 | 7.62 ± 0.42 | −1.54 ± 0.24 |
| R228R1 | 2.42 ± 0.25 | 0.92 ± 0.14 | 0.69 ± 0.24 |
| R231R1 | 1.55 ± 0.33 | 2.50 ± 0.24 | −0.48 ± 0.29 |
| N232R1 | 1.24 ± 0.24 | 3.57 ± 0.35 | −0.94 ± 0.46 |
| P234R1 | 0.96 ± 0.14 | 4.18 ± 0.23 | −1.42 ± 0.23 |
| Doxyl 5 | 4.48 ± 0.17 | 0.74 ± 0.09 | 1.73 ± 0.21 |
| Doxyl 7 | 5.97 ± 0.52 | 0.55 ± 0.15 | 2.42 ± 0.42 |
| Doxyl 10 | 7.53 ± 0.36 | 0.70 ± 0.12 | 2.42 ± 0.24 |
| Doxyl 12 | 9.03 ± 0.62 | 0.38 ± 0.16 | 3.13 ± 0.54 |
Uncertainties reported as weighted averages from 95% confidence intervals derived from fits to power saturation curves as described in Methods (Eq. 4)
Depth parameter uncertainties propagated from the accessibility parameters.
Of the 13 Syt7 C2A mutants, 7 showed depth parameters < −1 (L136R1, Q148R1, T170R1, N195R1, L196R1, L224R1, and P234R1), indicating aqueous exposed locations with little to no membrane contact. Three of the positions (F167R1, S168R1, and R228R1) had positive depth parameters, indicating membrane penetration potentially deeper than the phosphate plane of the lipid membrane. Three positions (G169R1, R231R1, and N232R1) had depth parameters between −1 and 0 suggesting close proximity to the phosphate plane. Measured depth parameters for each doxyl lipid were in good agreement with previous literature values, although these values can vary somewhat among spectrometers.45
Several of the Syt7 C2A depth parameters are considerably deeper than those reported previously for analogous positions in Syt1. For example, F167, G169, R228, and N232 are all positions on CBL1 or CBL3 that have depth parameters in Syt7 C2A > 1.0 more positive than the corresponding positions in Syt1 C2A (Table 3).25 By comparison, depth parameters at non-CBL positions were greater in Syt7 C2A by a smaller magnitude of 0.4 ± 0.2 and doxyl-PC depth parameters were greater in our study by only 0.2 ± 0.2. Together, these data suggest that the CBLs of Syt7 C2A penetrate into membranes more deeply than those of Syt1 C2A, although determination of the docking geometry requires fitting these measured depth parameters onto a structural model.
Table 3.
Average spin label depths from 3 docking models of Ca2+-bound Syt7 C2A, compared to previously published values for Syt1 C2A
| Mutant | Φa | Average spin label depth (Å)b | Equivalent residue in Syt1c | Syt1 C2A Φd |
|---|---|---|---|---|
| L136R1 | −1.59 ± 0.18 | −12.5 ± 9.3 | L142 | −1.9 |
| Q148R1 | −1.38 ± 0.21 | −36.2 ± 2.8 | Q154 | N.D. |
| F167R1 | 0.27 ± 0.19 | 4.0 ± 0.2 | M173 | −1.4 |
| S168R1 | 1.12 ± 0.30 | 6.2 ± 0.7 | G174 | 0.4 |
| G169R1 | −0.43 ± 0.17 | 0.8 ± 1.3 | G175 | −1.8 |
| T170R1 | −1.85 ± 0.40 | −6.4 ± 2.6 | T176 | −1.9 |
| N195R1 | −1.83 ± 0.20 | −8.2 ± 0.7 | T201 | −1.9 |
| L196R1 | −1.89 ± 0.21 | −8.8 ± 3.1 | L202 | −2.4 |
| L224R1 | −1.54 ± 0.24 | −5.4 ± 2.8 | Y229 | −2.0 |
| R228R1 | 0.69 ± 0.24 | 5.2 ± 0.5 | R233 | −1.4 |
| R231R1 | −0.48 ± 0.29 | 1.3 ± 1.0 | K236 | −0.6 |
| N232R1 | −0.94 ± 0.46 | −2.7 ± 1.7 | H237 | −2.0 |
| P234R1 | −1.42 ± 0.23 | −7.3 ± 2.3 | I239 | −2.1 |
| Doxyl 5 | 1.73 ± 0.21 | 8.1e | 1.45e | |
| Doxyl 7 | 2.42 ± 0.42 | 10.5e | 2.05e | |
| Doxyl 10 | 2.42 ± 0.24 | 14.0e | 2.42e | |
| Doxyl 12 | 3.13 ± 0.54 | 16.0e | 2.82e |
From Table 2
Mean ± S.D. of spin label nitrogen depth from three structural models based on simulations of Syt7 C2A bound to 3 Ca2+ ions, created as described in text. Depths from individual structural models are given in Table S3.
Determined from alignment of amino acid sequences for Syt1 – Syt10 using Clustal Omega
From ref. 25
Previously published values for doxyl lipids45
Modeled docking geometry of Syt7 C2A
In order to translate depth parameters into physical distances from the membrane phosphate plane, a hyperbolic tangent model is used to determine a best-fit geometry based on the relationship between depth parameters and structure (Figure 3). The measured depth parameters were used to create a suite of structural models of the Syt7 C2A membrane docking geometry. Earlier EPR docking geometry studies of C2 domains have modeled geometries based on single static protein structures, and single conformations of the MTSSL side chain at each position. Both of these assumptions likely underrepresent the dynamics of membrane binding and produce relatively crude estimates of uncertainty in the final geometric model. In the case of Syt7 C2A, the available structure is an NMR ensemble of states from measurements performed in the absence of Ca2+. Many of these states possess CBL structures that are not relevant to the Ca2+-bound protein structure. Thus, we first performed molecular dynamics simulations of Syt7 C2A bound to 3 Ca2+ ions (in the absence of membrane), details of which are presented in the companion paper. Three representative snapshots from this simulation, which we term Structures A, B, and C, were used as bases for fitting depth parameter data, and the depths reported in Tables 3–4 are averages among these three fits. For comparison, States 1 and 2 from the available Ca2+-free NMR structure (termed NMR1 and NMR2) were also used as bases for fitting; depths from all five fits are reported in Table S3. The results provide five self-consistent docking geometries, each modeled using the same set of depth parameter data but with a different starting protein structure.
Figure 3.
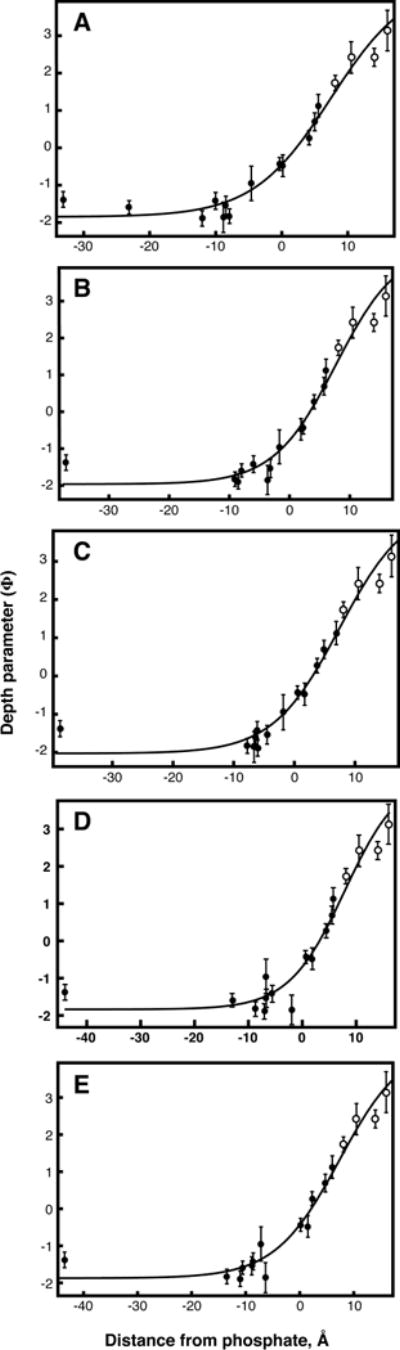
Hyperbolic tangent fits of experimentally determined Syt7 C2A depth parameters. Open circles indicate doxyl lipids, solid black circles indicate single-cysteine mutants. Each fit is based on Equation 7–8. Error bars are 95% CI of depth parameter values measured in duplicate or triplicate, which are listed in Table 2. The same depth parameter data were used for each fit, and applied to (A) Ca2+-bound structure A, (B) Ca2+-bound structure B, (C) Ca2+-bound structure C, (D) NMR structure state 1, or (E) NMR structure state 2. The relevant NMR structure is PDB ID 2D8K.
Table 4.
Comparison of α-carbon depths between Syt7 C2A and Syt1 C2A
| Residue | Syt7 C2A (Å)a | Equivalent residue in Syt1b | Syt1 C2A, reported (Å)a,c | Syt1 C2AB, reported (Å)a,d | Syt1 C2A, reanalysis (Å)a,e | Syt1 C2A, reanalysis (Å)a,f |
|---|---|---|---|---|---|---|
| D166 | 0.0 ± 1.8 | D172 | −1.4 | 4.5 | −2.9 ± 1.0 | −4.4 ± 0.3 |
| F167 | 2.4 ± 2.1 | M173 | 0.8 | 7.0 | −0.3 ± 1.3 | −1.7 ± 0.2 |
| S168 | 1.9 ± 1.7 | G174 | −0.7 | 4.6 | −1.9 ± 0.7 | −2.6 ± 0.4 |
| G169 | −1.6 ± 1.9 | G175 | −4.5 | 1.8 | −5.3 ± 0.8 | −6.3 ± 0.4 |
| D227 | 0.3 ± 0.8 | D232 | 0.3 | 2.8 | −4.1 ± 0.9 | −4.5 ± 0.1 |
| R228 | 2.5 ± 0.4 | R233 | 2.6 | 2.9 | −2.9 ± 0.4 | −3.0 ± 0.4 |
| F229 | 5.5 ± 0.8 | F234 | 5.3 | 6.3 | 0.6 ± 0.4 | 0.5 ± 0.2 |
| S230 | 3.8 ± 1.3 | S235 | 4.0 | 7.3 | 0.4 ± 0.8 | −0.4 ± 0.5 |
| R231 | 0.4 ± 1.2 | K236 | 0.8 | 5.4 | −2.0 ± 0.8 | −3.4 ± 0.6 |
Distance from α-carbon to phosphate plane (positive values deeper). Data are mean ± S.D. from models using three snapshots from molecular dynamics simulations of the Ca2+-loaded domain as starting structures.
Determined from alignment of amino acid sequences for Syt1 – Syt10 using Clustal Omega
From ref. 25
From ref. 27
Mean ± S.D. using 1BYN states 1–3 as starting structures
Mean ± S.D. using simulation snapshots as starting structures
In each case, modeling consisted of three steps as in previous studies: (1) estimation of coordinates for the MTSSL tag at each position relative to the starting protein structure; (2) fitting of depth parameter data to a hyperbolic tangent function to obtain docking geometry parameters; and (3) iterative adjustment of MTSSL sidechain conformation at selected positions in order to improve self-consistent fitting.
While previous studies have estimated initial MTSSL coordinates by assigning a single rotamer conformation at each position, we instead assigned initial coordinates based on the average coordinates among allowed rotamers at each position, using the recently developed MTSSL Wizard plugin for Pymol.43 Exceptions were (a) positions at which the “tight” setting of the MTSSL Wizard yielded no predicted rotamers, and (b) positions which were defined as particular rotamers during the iterative fitting process to improve fitting to the hyperbolic tangent function. In either case, rotamers were chosen which matched previously described energy minima for the MTSSL sidechain and produced no obvious steric clashes.46 For example, T170 is located in a shallow groove that produced no rotamers in Structures 1 and 3 using MTSSL Wizard; however, it was accommodated by χ1 and χ2 angles of −60° (g+, g+). The positions whose rotamer conformations were adjusted during the iterative fitting process are listed in the Methods and the dihedral angles used for these positions are given in Table S1.
As in previous EPR depth studies of Syt1 C2 domains, depth parameter data were fit to a hyperbolic tangent function empirically shown to model depth parameter measurements as a function of insertion depth.25, 26 Depth parameter varies approximately linearly with penetration depth in the membrane interior, but is independent of distance from the membrane surface for positions that are highly aqueous. Doxyl lipid standards with known penetration depth were used to calibrate the slope of the curve in the membrane interior (open circles in Figure 3). The self-consistent best-fit relationship between depth parameter and distance fit to Eq. 7–8 is shown in Figure 3A–E for all five starting structural models. The fit includes three parameters defining the curve shape (A, B, and C in Eq. 7) and three parameters defining the penetration and orientation of the C2A domain with respect to the membrane (ytrans, θx, and θz in Eq. 8). The protein-membrane docking geometry is then achieved by sequentially rotating the starting protein coordinates by the Euler angles θx and θz, and then translating by ytrans. These transformations produce a docked protein structure in which the x-z plane represents the average phosphate position of a planar membrane. The five orientations obtained from this method are shown in Figure 4.
Figure 4.
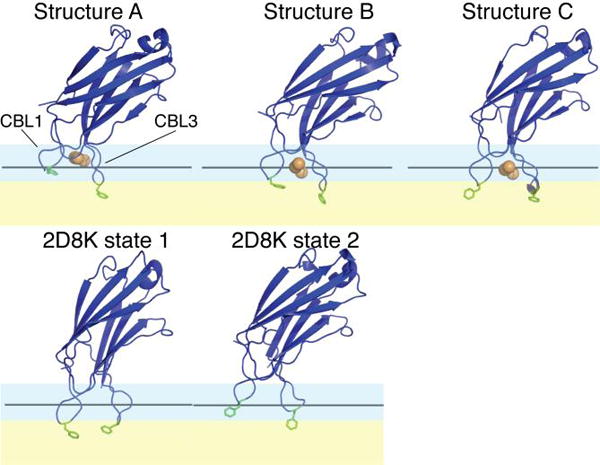
Optimized best-fit docking models for Syt7 C2A based on the indicated starting structure. Black lines represent the lipid phosphate plane, blue shading represents the approximate headgroup region and yellow shading represents the approximate nonpolar acyl chain region. The phenylalanine residues at positions 167 and 229 are shown in green, and bound Ca2+ ions are shown in orange. Protein orientations correspond to successive Euler angle rotations of θx and θz followed a by translation along the y axis of ytrans, as follows: Structure A: θx = 252.8°, θz = −4.4°, ytrans = −18.2 Å; Structure B: θx = 268.6°, θz = 11.1°, ytrans = −16.8 Å; Structure C: θx = 261.8°, θz = 14.7°, ytrans = −17.1 Å; 2D8K State 1: θx = 17.5°, θz = 4.8°, ytrans = −20.6 Å; 2D8K State 2: θx = 23.1°, θz = −6.4°, ytrans = −22.2 Å. Starting coordinates for Structures A, B, and C are available in the Supporting Information.
The use of five starting structures (three containing Ca2+ and two without) offers a glimpse into the uncertainty associated with modeling the docking geometry by this method. Loops and external sidechains on a protein have considerably more flexibility than a single static crystal structure. Ca2+-bound Structure A and NMR State 2 produced the shallowest penetration depths, while Ca2+-bound Structure C and NMR State 1 produced the deepest. The distance of each spin label from the membrane phosphate plane in each model are listed in Table S3, and the averages among the three Ca2+-bound geometries are listed in Table 3. As expected from the hyperbolic curve fit, the more aqueous positions had a larger uncertainty associated with their position. The standard deviations were generally in the 0–3 Å range, comparable to previously estimated uncertainties associated with EPR depth parameter measurements,25, 42 with the exception of L136 which resides on the flexible and solvent-exposed N-terminus of the domain.For a consistent comparison of the Syt7 and Syt1 C2A docking geometries, we also re-analyzed the published Syt1 C2A depth parameters25 using the same methods as our Syt7 C2A analysis. A suite of Syt1 C2A docking geometry models were created including (a) mapping MTSSL sidechain configurations using average positions from MTSSL Wizard, and (b) using six Syt1 C2A structures as bases for fitting: states 1–3 from the published NMR structure of the Ca2+-loaded domain,47 and three snapshots from a molecular dynamics simulation of the Ca2+-loaded domain (described in the companion paper). All six of these models are shallower than the previously reported Syt1 C2A docking geometry (Table 4, Figure S3–S4, and Table S4). The discrepancy can be attributed mainly to differences in the MTSSL sidechain geometries used for fitting, particularly for two positions in CBL3, as discussed further in the legend to Figure S4. Thus, comparing docking geometries using the same modeling approach further indicates that Syt7 C2A inserts deeper than Syt1 C2A.
Table 4 also compares our modeled Syt7 C2A penetration depths to previously published geometries for Syt1 C2A.25 Notably, α-carbons in CBL1 penetrate 1 to 5 Å deeper into the membrane for Syt7 C2A relative to all of the models for the isolated Syt1 C2A domain, consistent with the greater average depth parameter values of Syt7 C2A for positions in this loop. Regardless of which Syt1 C2A model is more accurate, these data are consistent with our earlier prediction that CBL1 of Syt7 C2A penetrates deeper than the corresponding region of Syt1 C2A.37
Discussion
EPR depth parameter measurements are useful for measuring docking geometries of peripheral membrane proteins, with uncertainties previously reported in the 2–3 Å range.25, 42 Here, we note three significant findings from our EPR depth parameter study of Syt7 C2A: (i) the domain penetrates membranes somewhat more deeply than the isolated Syt1 C2A domain, although less deeply than Syt1 C2A in the C2AB tandem; (ii) uncertainty in docking geometry models arise in large part due to inherent uncertainties in mapping sidechain depth parameters onto static protein structures; and (iii) hydrophobic effects appear more critical in CBL3 than CBL1 for Syt7 C2A membrane docking, as the R1 spin label is less perturbing in place of Phe167 than at Phe229.
Comparing Syt7 and Syt1 C2A Docking Models
The extensive body of research detailing the structure and mechanism of Syt1 provides a valuable reference point for studies of other isoforms. The Syt7 C2A domain is known to bind membranes with a much greater Ca2+ sensitivity and with significantly slower dissociation kinetics than its counterpart from Syt1.37, 49 Previously, we proposed a membrane docking mechanism for Syt7 C2A to explain this observation, in which an initial electrostatic association is followed by penetration of Phe residues in both CBL1 and CBL3 into the hydrophobic interior of the lipid membrane.37 The depth measurements presented here are consistent with this hypothesis. Of the five Syt7 C2A docking geometry models shown in Figure 4, three show penetration of both Phe167 and Phe229 into the acyl chain region of the membrane. The model for Ca2+-bound Structure B represents the median depth among the five, and has depths closely similar to the mean of the three Ca2+-bound structures (Table 3, Table S3).
A comparison of previously published EPR docking geometries for Syt1 C2A to our suite of models for Syt7 C2A shows consistent and nearly equal penetration of CBL3 but variable penetration of CBL1.25 Two previous depth parameter studies have been conducted for Syt1 C2A: one with the isolated domain, and one in the C2AB tandem.25, 27 Figures 5 and S3 show side-by-side comparisons of our Structure B docking geometry to these two previously reported docking geometries of Syt1 C2A, and Table 4 lists average α-carbon depths for our Ca2+-bound Syt7 C2A models compared to the four models of Syt1 C2A (two previously reported and two averages based on our re-analysis of the depth parameter data). The α-carbon at the apex of CBL1 (Phe167 of Syt7; Met173 of Syt1) increases in depth from 0.8 Å to 7.0 Å between isolated Syt1 C2A and Syt1 C2AB, and ranges from 0.2 to 4.3 Å in our Ca2+-bound Syt7 C2A models. By contrast, α-carbon depths for the hydrophobic apex of CBL3 (Phe229 of Syt7; Phe234 of Syt1) fall within a relatively narrow range of 4.6 to 6.0 Å in our Ca2+-bound models, comparable to 5.3 Å in isolated Syt1 C2A and 6.3 Å in Syt1 C2AB. Direct comparison of depth parameters along with our re-analysis of the isolated Syt1 C2A data raise the possibility that CBL3 depth may also differ between the two domains (Tables 3–4; Figure S4); thus, this comparison remains uncertain. Overall, our modeling shows a penetration depth of Syt7 C2A in which both CBL1 and CBL3 penetrate similarly or up to a few Å deeper in Syt7 C2A relative to isolated Syt1 C2A.
Figure 5.
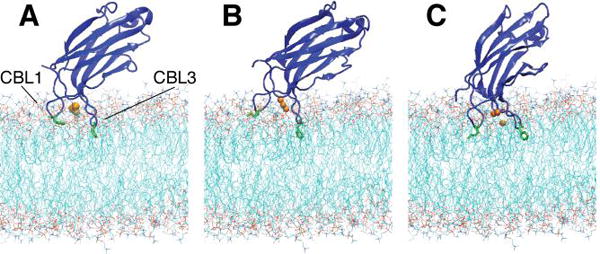
Comparison of (A) the median Syt7 C2A docking geometry determined here (Structure B in Figure 4) with (B) the reported Syt1 C2A docking geometry of the isolated domain25 and (C) the reported Syt1 C2A docking geometry in the C2AB tandem.27 Optimized docking geometries are superimposed on a simulated lipid bilayer containing 25% POPS and 75% POPC. Hydrophobic sidechains on CBL1 and CBL3 are shown in green, and Ca2+ ions are shown in orange. Syt1 C2A geometries are reconstructed based on the transformations reported previously.25, 27
Uncertainty in Docking Geometry Modeling
Because EPR-based models are useful in directly visualizing docking geometries of peripheral membrane proteins, it is important to understand the origins and extent of uncertainty in the modeling process. Prior studies have reported estimated uncertainties on insertion depths, but the contributions from different stages of the measurement and modeling process have not formally been evaluated, to our knowledge. Potential sources of uncertainty include (i) experimental measurements of depth parameters of spin-labeled protein mutants, (ii) prediction of spatial coordinates for each unpaired electron with respect to the protein backbone, and (iii) fits of the measured depth parameters and coordinates to a function that describes its docking geometry. Approaches for (ii) and (iii) have varied since the development of EPR depth measurements in the 1990s, including modern methods that combine fitting with molecular simulation, e.g. via simulated annealing.31, 50 The present study was designed to compare results with a 2003 study of Syt1 C2A, and therefore we have used structure fitting and modeling protocols from that study where possible and adapted those methods when necessary. As a result, we have taken a somewhat novel approach for (ii) which reveals a significant contribution to the uncertainty of the final model. Two novel components of our modeling approach are described below.
First, because the only available structure of Syt7 C2A lacks Ca2+, we simulated the Ca2+-bound protein domain in isolation for use as a reference structure. We used three snapshots from this simulation along with two different states of the available Ca2+-free NMR structure as bases for modeling rather than a single protein structure as in most previous studies. This approach may capture effects of dynamic heterogeneity in backbone structure of the CBLs that are responsible for membrane insertion. The range of docking geometries shown in Figure 4, each generated using the same depth parameter measurements and fitting method but using different sidechain and backbone structures, illustrates the contribution of starting protein structure to the final model. Modeled penetration depths for individual residues in CBL1 varied with standard deviations of ~2 Å, while depths in CBL3 had smaller standard deviations of ~1 Å (Table 4).
Second, we modeled coordinates of each unpaired electron relative to each protein structure largely by averaging coordinates among many possible sidechain rotamers, rather than from a single rotamer at each position as has been the standard practice in previous studies. The MTSSL Wizard tool was previously developed for double electron-electron resonance (DEER) distance measurements, but to our knowledge has not previously been used for membrane depth studies.43 This approach streamlines the modeling process and reflects average sidechain configurations in a protein more accurately than a single rotamer, although it is limited by not scoring free energies of the available configurations. We reverted to the historical method of defining a single rotamer at positions for which sterics of other sidechains limited the coordinate space available for the MTSSL sidechain (for which MTSSL Wizard produced no rotamers using the ‘tight’ definition of allowable contacts).
We also adopted a standard practice of defining and adjusting rotamer conformations for a few positions which did not fit well to the hyperbolic function using the average-position method.21, 41, 42 In particular, we manually adjusted the sidechain configurations of F167R1 and/or G169R1 in each of the structural models, in order to account for the fact that these mutants have approximately equal depth parameters despite different positions in CBL1: Phe167 is at the apex of the loop, whereas Gly169 should be much less deeply inserted. The depth parameter data can be accounted for by defining the sidechain geometries such that F167R1 sidechain is oriented parallel to the membrane surface and/or G169R1 is oriented toward the membrane interior. While these orientations might be preferred by the protein, an alternative explanation is that the adjustments compensate for other sources of error such as minor effects of mutations on penetration depth. For example, the R1 sidechain has a polarity intermediate between Gly and Phe; therefore, the F167R1 mutant has a more polar CBL1 and may penetrate less deeply, while G169R1 and S168R1 have more nonpolar CBL1 sequences and may penetrate more deeply. A similar effect may exist in Syt1 C2A with M173R1 and G174R1, both of whose sidechain positions had to be manually defined to (χ1, χ2) = (g+, g+) in our re-analysis of these docking geometries. The fact that none of these mutations has a dramatic effect on membrane binding kinetics may reflect a secondary importance of CBL1 in membrane docking as discussed below.
Roles of CBL1 and CBL3 in membrane docking of Syt7 C2A
The differences in membrane binding and release kinetics between the F229R1 and F167R1 mutants may provide insight into the respective roles of CBL3 and CBL1 in Syt7 C2A. Phe229 in CBL3 appears to be essential to proper membrane binding, as its mutation to R1 leads to a 4-fold increased off-rate relative to the cysless form of the domain (Table 1). In contrast, kinetics were not significantly impacted by mutation of Phe167 to cysteine and addition of an MTSSL spin label. The different effects of mutating these residues may indicate a more essential role for CBL3 as compared to CBL1 in the membrane-docked structure.
Based on the relative tolerance of CBL1 to mutation and its greater uncertainty in penetration depth, it is tempting to speculate that this binding loop experiences greater structural dynamics in the membrane-bound state. However, the depth parameter is an ensemble average measurement, and does not itself provide information on the dynamics of these loops. Lineshape analysis shows that individual sidechains become more restricted upon membrane binding, but is also not informative regarding overall tilting dynamics of the protein in the membrane. In order to resolve the uncertainty in penetration depth of CBL1 and to gain information on the relative energetics of CBL1 and CBL3 insertion, alternative approaches are necessary. In the companion manuscript, we describe all-atom simulations of Syt7 C2A membrane docking that provide insight into these outstanding questions.
Supplementary Material
Supporting Information. Table S1 of side-chain dihedral angles used in Syt7 C2A modeling, Table S2 of side-chain dihedral angles used in Syt1 C2A reanalysis, Table S3 of final spin-label depths from the 5 Syt7 C2A docking models, Table S4 of final spin-label depths from the 6 Syt1 C2A docking models, Figure S1 showing efficiency of spin labeling, Figure S2 showing EPR spectra of doxyl lipids, Figure S3 showing hyperbolic fits from re-analysis of Syt1 C2A depth parameters, Figure S4 showing docking geometries from Syt1 C2A re-analysis, Figure S5 showing comparison of Syt1 and Syt7 docking geometries using cartoon representations of the membrane, and PDB files of the six snapshots from simulations used as starting points for structural modeling. This material is available free of charge via the Internet at http://pubs.acs.org.
Acknowledgments
We thank Dr. Annette Erbse for expert assistance with EPR and for critical reading of this manuscript, and Drs. Brian Ziemba and Joseph Falke for guidance on docking geometry modeling.
Funding source statement: This work was supported by Multi-Investigator Cottrell College Science Award #22399 from the Research Corporation for Science Advancement to J.D.K. and H.L., and by NIH R15GM102866 to J.D.K. Support for F.A.M. included an undergraduate fellowship through the Building Research Achievement in Neuroscience program [NIH award R25GM097633 to Profs. Diego Restrepo (UCD) and Elba Serrano (NMSU)].
ABBREVIATIONS
- Syt
synaptotagmin
- EPR
Electron paramagnetic resonance
- PIP2
phosphatidylinositol 4,5-bisphosphate
- WT
wild type
- NiEDDA
nickel ethylenediamine diacetic acid
- EDTA
ethylenediamine tetraacetic acid
- POPC
1-palmitoyl-2-oleoyl-sn-glycero-3-phosphocholine
- POPS
1-palmitoyl-2-oleoyl-sn-glycero-3-phospho-L-serine
- SNARE
soluble N-ethylmaleimide-sensitive fusion protein attachment receptor
- FRET
fluorescence resonance energy transfer
- PH
pleckstrin homology
- GRP1
general receptor of phosphoinositides 1
- PKCα
protein kinase Cα
- DMF
dimethylformamide
- cPLA2
cytosolic phospholipase A2
- IPTG
isopropyl β-D-thiogalactopyranoside
- SDS-PAGE
sodium dodecyl sulfate polyacrylamide gel electrophoresis
- HEPES
(4-(2-hydroxyethyl)-1-piperazineethanesulfonic acid
- SUV
small (sonicated) unilamellar vesicle(s)
- PDB
protein data bank
- MTSSL
methanethiosulfonate spin label
References
- 1.Chapman ER. How does synaptotagmin trigger neurotransmitter release? Annu Rev Biochem. 2008;77:615–641. doi: 10.1146/annurev.biochem.77.062005.101135. [DOI] [PubMed] [Google Scholar]
- 2.Martens S, McMahon HT. Mechanisms of membrane fusion: disparate players and common principles. Nat Rev Mol Cell Biol. 2008;9:543–556. doi: 10.1038/nrm2417. [DOI] [PubMed] [Google Scholar]
- 3.Corbalan-Garcia S, Gomez-Fernandez JC. Signaling through C2 domains: more than one lipid target. Biochim Biophys Acta. 2014;1838:1536–1547. doi: 10.1016/j.bbamem.2014.01.008. [DOI] [PubMed] [Google Scholar]
- 4.Gustavsson N, Han W. Calcium-sensing beyond neurotransmitters: functions of synaptotagmins in neuroendocrine and endocrine secretion. Biosci Rep. 2009;29:245–259. doi: 10.1042/BSR20090031. [DOI] [PubMed] [Google Scholar]
- 5.Sugita S, Shin OH, Han W, Lao Y, Sudhof TC. Synaptotagmins form a hierarchy of exocytotic Ca2+ sensors with distinct Ca2+ affinities. EMBO J. 2002;21:270–280. doi: 10.1093/emboj/21.3.270. [DOI] [PMC free article] [PubMed] [Google Scholar]
- 6.Bhalla A, Chicka MC, Chapman ER. Analysis of the synaptotagmin family during reconstituted membrane fusion. Uncovering a class of inhibitory isoforms. J Biol Chem. 2008;283:21799–21807. doi: 10.1074/jbc.M709628200. [DOI] [PMC free article] [PubMed] [Google Scholar]
- 7.Rickman C, Craxton M, Osborne S, Davletov B. Comparative analysis of tandem C2 domains from the mammalian synaptotagmin family. Biochem J. 2004;378:681–686. doi: 10.1042/BJ20031407. [DOI] [PMC free article] [PubMed] [Google Scholar]
- 8.Hurley JH, Misra S. Signaling and subcellular targeting by membrane-binding domains. Annu Rev Biophys Biomol Struct. 2000;29:49–79. doi: 10.1146/annurev.biophys.29.1.49. [DOI] [PMC free article] [PubMed] [Google Scholar]
- 9.Schiavo G, Gu QM, Prestwich GD, Sollner TH, Rothman JE. Calcium-dependent switching of the specificity of phosphoinositide binding to synaptotagmin. Proc Natl Acad Sci U S A. 1996;93:13327–13332. doi: 10.1073/pnas.93.23.13327. [DOI] [PMC free article] [PubMed] [Google Scholar]
- 10.Bai J, Tucker WC, Chapman ER. PIP2 increases the speed of response of synaptotagmin and steers its membrane-penetration activity toward the plasma membrane. Nat Struct Mol Biol. 2004;11:36–44. doi: 10.1038/nsmb709. [DOI] [PubMed] [Google Scholar]
- 11.Damer CK, Creutz CE. Synergistic membrane interactions of the two C2 domains of synaptotagmin. J Biol Chem. 1994;269:31115–31123. [PubMed] [Google Scholar]
- 12.Arac D, Chen X, Khant HA, Ubach J, Ludtke SJ, Kikkawa M, Johnson AE, Chiu W, Sudhof TC, Rizo J. Close membrane-membrane proximity induced by Ca2+-dependent multivalent binding of synaptotagmin-1 to phospholipids. Nat Struct Mol Biol. 2006;13:209–217. doi: 10.1038/nsmb1056. [DOI] [PubMed] [Google Scholar]
- 13.Choi UB, Strop P, Vrljic M, Chu S, Brunger AT, Weninger KR. Single-molecule FRET-derived model of the synaptotagmin 1-SNARE fusion complex. Nat Struct Mol Biol. 2010;17:318–324. doi: 10.1038/nsmb.1763. [DOI] [PMC free article] [PubMed] [Google Scholar]
- 14.Krishnakumar SS, Kummel D, Jones SJ, Radoff DT, Reinisch KM, Rothman JE. Conformational dynamics of calcium-triggered activation of fusion by synaptotagmin. Biophys J. 2013;105:2507–2516. doi: 10.1016/j.bpj.2013.10.029. [DOI] [PMC free article] [PubMed] [Google Scholar]
- 15.Martens S. Role of C2 domain proteins during synaptic vesicle exocytosis. Biochem Soc Trans. 2010;38:213–216. doi: 10.1042/BST0380213. [DOI] [PubMed] [Google Scholar]
- 16.Segovia M, Ales E, Montes MA, Bonifas I, Jemal I, Lindau M, Maximov A, Sudhof TC, Alvarez de Toledo G. Push-and-pull regulation of the fusion pore by synaptotagmin-7. Proc Natl Acad Sci U S A. 2010;107:19032–19037. doi: 10.1073/pnas.1014070107. [DOI] [PMC free article] [PubMed] [Google Scholar]
- 17.Paddock BE, Wang Z, Biela LM, Chen K, Getzy MD, Striegel A, Richmond JE, Chapman ER, Featherstone DE, Reist NE. Membrane penetration by synaptotagmin is required for coupling calcium binding to vesicle fusion in vivo. J Neurosci. 2011;31:2248–2257. doi: 10.1523/JNEUROSCI.3153-09.2011. [DOI] [PMC free article] [PubMed] [Google Scholar]
- 18.Striegel AR, Biela LM, Evans CS, Wang Z, Delehoy JB, Sutton RB, Chapman ER, Reist NE. Calcium binding by synaptotagmin’s C2A domain is an essential element of the electrostatic switch that triggers synchronous synaptic transmission. J Neurosci. 2012;32:1253–1260. doi: 10.1523/JNEUROSCI.4652-11.2012. [DOI] [PMC free article] [PubMed] [Google Scholar]
- 19.Hui E, Johnson CP, Yao J, Dunning FM, Chapman ER. Synaptotagmin-mediated bending of the target membrane is a critical step in Ca2+-regulated fusion. Cell. 2009;138:709–721. doi: 10.1016/j.cell.2009.05.049. [DOI] [PMC free article] [PubMed] [Google Scholar]
- 20.Altenbach C, Flitsch SL, Khorana HG, Hubbell WL. Structural studies on transmembrane proteins. 2. Spin labeling of bacteriorhodopsin mutants at unique cysteines. Biochemistry. 1989;28:7806–7812. doi: 10.1021/bi00445a042. [DOI] [PubMed] [Google Scholar]
- 21.Malmberg NJ, Falke JJ. Use of EPR power saturation to analyze the membrane-docking geometries of peripheral proteins: applications to C2 domains. Annu Rev Biophys Biomol Struct. 2005;34:71–90. doi: 10.1146/annurev.biophys.34.040204.144534. [DOI] [PMC free article] [PubMed] [Google Scholar]
- 22.Altenbach C, Greenhalgh DA, Khorana HG, Hubbell WL. A collision gradient method to determine the immersion depth of nitroxides in lipid bilayers: application to spin-labeled mutants of bacteriorhodopsin. Proc Natl Acad Sci U S A. 1994;91:1667–1671. doi: 10.1073/pnas.91.5.1667. [DOI] [PMC free article] [PubMed] [Google Scholar]
- 23.Almers W. Synapses. How fast can you get? Nature. 1994;367:682–683. doi: 10.1038/367682a0. [DOI] [PubMed] [Google Scholar]
- 24.Sudhof TC. Neurotransmitter release: the last millisecond in the life of a synaptic vesicle. Neuron. 2013;80:675–690. doi: 10.1016/j.neuron.2013.10.022. [DOI] [PMC free article] [PubMed] [Google Scholar]
- 25.Frazier AA, Roller CR, Havelka JJ, Hinderliter A, Cafiso DS. Membrane-bound orientation and position of the synaptotagmin I C2A domain by site-directed spin labeling. Biochemistry. 2003;42:96–105. doi: 10.1021/bi0268145. [DOI] [PubMed] [Google Scholar]
- 26.Rufener E, Frazier AA, Wieser CM, Hinderliter A, Cafiso DS. Membrane-bound orientation and position of the synaptotagmin C2B domain determined by site-directed spin labeling. Biochemistry. 2005;44:18–28. doi: 10.1021/bi048370d. [DOI] [PubMed] [Google Scholar]
- 27.Herrick DZ, Sterbling S, Rasch KA, Hinderliter A, Cafiso DS. Position of synaptotagmin I at the membrane interface: cooperative interactions of tandem C2 domains. Biochemistry. 2006;45:9668–9674. doi: 10.1021/bi060874j. [DOI] [PubMed] [Google Scholar]
- 28.Bai J, Wang P, Chapman ER. C2A activates a cryptic Ca2+-triggered membrane penetration activity within the C2B domain of synaptotagmin I. Proc Natl Acad Sci U S A. 2002;99:1665–1670. doi: 10.1073/pnas.032541099. [DOI] [PMC free article] [PubMed] [Google Scholar]
- 29.Hui E, Bai J, Chapman ER. Ca2+-triggered simultaneous membrane penetration of the tandem C2-domains of synaptotagmin I. Biophys J. 2006;91:1767–1777. doi: 10.1529/biophysj.105.080325. [DOI] [PMC free article] [PubMed] [Google Scholar]
- 30.Lai AL, Tamm LK, Ellena JF, Cafiso DS. Synaptotagmin 1 modulates lipid acyl chain order in lipid bilayers by demixing phosphatidylserine. J Biol Chem. 2011;286:25291–25300. doi: 10.1074/jbc.M111.258848. [DOI] [PMC free article] [PubMed] [Google Scholar]
- 31.Herrick DZ, Kuo W, Huang H, Schwieters CD, Ellena JF, Cafiso DS. Solution and Membrane-Bound Conformations of the Tandem C2A and C2B Domains of Synaptotagmin 1: Evidence for Bilayer Bridging. Journal of Molecular Biology. 2009;390:913–923. doi: 10.1016/j.jmb.2009.06.007. [DOI] [PMC free article] [PubMed] [Google Scholar]
- 32.Zhang X, Rizo J, Sudhof TC. Mechanism of phospholipid binding by the C2A-domain of synaptotagmin I. Biochemistry. 1998;37:12395–12403. doi: 10.1021/bi9807512. [DOI] [PubMed] [Google Scholar]
- 33.Gerber SH, Rizo J, Sudhof TC. Role of electrostatic and hydrophobic interactions in Ca2+-dependent phospholipid binding by the C2A-domain from synaptotagmin I. Diabetes. 2002;51(Suppl 1):S12–18. doi: 10.2337/diabetes.51.2007.s12. [DOI] [PubMed] [Google Scholar]
- 34.Sudhof TC. Synaptotagmins: why so many? J Biol Chem. 2002;277:7629–7632. doi: 10.1074/jbc.R100052200. [DOI] [PubMed] [Google Scholar]
- 35.Gauthier BR, Duhamel DL, Iezzi M, Theander S, Saltel F, Fukuda M, Wehrle-Haller B, Wollheim CB. Synaptotagmin VII splice variants alpha, beta, and delta are expressed in pancreatic beta-cells and regulate insulin exocytosis. FASEB J. 2008;22:194–206. doi: 10.1096/fj.07-8333com. [DOI] [PubMed] [Google Scholar]
- 36.Weir GC, Bonner-Weir S. Five stages of evolving beta-cell dysfunction during progression to diabetes. Diabetes. 2004;53(Suppl 3):S16–21. doi: 10.2337/diabetes.53.suppl_3.s16. [DOI] [PubMed] [Google Scholar]
- 37.Brandt DS, Coffman MD, Falke JJ, Knight JD. Hydrophobic contributions to the membrane docking of synaptotagmin 7 C2A domain: mechanistic contrast between isoforms 1 and 7. Biochemistry. 2012;51:7654–7664. doi: 10.1021/bi3007115. [DOI] [PMC free article] [PubMed] [Google Scholar]
- 38.Nalefski EA, Wisner MA, Chen JZ, Sprang SR, Fukuda M, Mikoshiba K, Falke JJ. C2 domains from different Ca2+ signaling pathways display functional and mechanistic diversity. Biochemistry. 2001;40:3089–3100. doi: 10.1021/bi001968a. [DOI] [PMC free article] [PubMed] [Google Scholar]
- 39.Ubach J, Lao Y, Fernandez I, Arac D, Sudhof TC, Rizo J. The C2B domain of synaptotagmin I is a Ca2+-binding module. Biochemistry. 2001;40:5854–5860. doi: 10.1021/bi010340c. [DOI] [PubMed] [Google Scholar]
- 40.Maximov A, Lao Y, Li H, Chen X, Rizo J, Sørensen JB, Südhof TC. Genetic analysis of synaptotagmin-7 function in synaptic vesicle exocytosis. Proceedings of the National Academy of Sciences. 2008;105:3986–3991. doi: 10.1073/pnas.0712372105. [DOI] [PMC free article] [PubMed] [Google Scholar]
- 41.Landgraf KE, Malmberg NJ, Falke JJ. Effect of PIP2 binding on the membrane docking geometry of PKCalpha C2 domain: An EPR site-directed spin-labeling and relaxation study. Biochemistry. 2008;47:8301–8316. doi: 10.1021/bi800711t. [DOI] [PMC free article] [PubMed] [Google Scholar]
- 42.Chen HC, Ziemba BP, Landgraf KE, Corbin JA, Falke JJ. Membrane docking geometry of GRP1 PH domain bound to a target lipid bilayer: an EPR site-directed spin-labeling and relaxation study. PLoS One. 2012;7:e33640. doi: 10.1371/journal.pone.0033640. [DOI] [PMC free article] [PubMed] [Google Scholar]
- 43.Hagelueken G, Ward R, Naismith JH, Schiemann O. MtsslWizard: In Silico Spin-Labeling and Generation of Distance Distributions in PyMOL. Applied magnetic resonance. 2012;42:377–391. doi: 10.1007/s00723-012-0314-0. [DOI] [PMC free article] [PubMed] [Google Scholar]
- 44.Stone TJ, Buckman T, Nordio PL, McConnell HM. Spin-labeled biomolecules. Proc Natl Acad Sci U S A. 1965;54:1010–1017. doi: 10.1073/pnas.54.4.1010. [DOI] [PMC free article] [PubMed] [Google Scholar]
- 45.Frazier AA, Wisner MA, Malmberg NJ, Victor KG, Fanucci GE, Nalefski EA, Falke JJ, Cafiso DS. Membrane orientation and position of the C2 domain from cPLA2 by site-directed spin labeling. Biochemistry. 2002;41:6282–6292. doi: 10.1021/bi0160821. [DOI] [PubMed] [Google Scholar]
- 46.Tombolato F, Ferrarini A, Freed JH. Dynamics of the nitroxide side chain in spin-labeled proteins. J Phys Chem B. 2006;110:26248–26259. doi: 10.1021/jp0629487. [DOI] [PMC free article] [PubMed] [Google Scholar]
- 47.Shao X, Fernandez I, Sudhof TC, Rizo J. Solution structures of the Ca2+-free and Ca2+-bound C2A domain of synaptotagmin I: does Ca2+ induce a conformational change? Biochemistry. 1998;37:16106–16115. doi: 10.1021/bi981789h. [DOI] [PubMed] [Google Scholar]
- 48.Malmberg NJ, Van Buskirk DR, Falke JJ. Membrane-docking loops of the cPLA2 C2 domain: detailed structural analysis of the protein-membrane interface via site-directed spin-labeling. Biochemistry. 2003;42:13227–13240. doi: 10.1021/bi035119+. [DOI] [PMC free article] [PubMed] [Google Scholar]
- 49.Hui E, Bai J, Wang P, Sugimori M, Llinas RR, Chapman ER. Three distinct kinetic groupings of the synaptotagmin family: candidate sensors for rapid and delayed exocytosis. Proc Natl Acad Sci U S A. 2005;102:5210–5214. doi: 10.1073/pnas.0500941102. [DOI] [PMC free article] [PubMed] [Google Scholar]
- 50.Ellena JF, Lackowicz P, Mongomery H, Cafiso DS. Membrane thickness varies around the circumference of the transmembrane protein BtuB. Biophys J. 2011;100:1280–1287. doi: 10.1016/j.bpj.2011.01.055. [DOI] [PMC free article] [PubMed] [Google Scholar]
Associated Data
This section collects any data citations, data availability statements, or supplementary materials included in this article.
Supplementary Materials
Supporting Information. Table S1 of side-chain dihedral angles used in Syt7 C2A modeling, Table S2 of side-chain dihedral angles used in Syt1 C2A reanalysis, Table S3 of final spin-label depths from the 5 Syt7 C2A docking models, Table S4 of final spin-label depths from the 6 Syt1 C2A docking models, Figure S1 showing efficiency of spin labeling, Figure S2 showing EPR spectra of doxyl lipids, Figure S3 showing hyperbolic fits from re-analysis of Syt1 C2A depth parameters, Figure S4 showing docking geometries from Syt1 C2A re-analysis, Figure S5 showing comparison of Syt1 and Syt7 docking geometries using cartoon representations of the membrane, and PDB files of the six snapshots from simulations used as starting points for structural modeling. This material is available free of charge via the Internet at http://pubs.acs.org.