Abstract
We determined the protein expression of adipogenic transcription factor, peroxisome proliferator-activated receptor gamma (PPARγ) and its co-repressor and co-activator complexes in adipose tissue from the obese offspring of under- and over-nourished dams. Female rats were fed either a high fat (60% kcal) or control (10% kcal) diet prior to mating, and throughout pregnancy and lactation (Mat-OB). Additional dams were 50% food-restricted from pregnancy day 10 to term (intrauterine growth-restricted; IUGR). Adipose tissue protein expression was analyzed in newborn and adult male offspring. Normal birth weight Mat-OB and low birth weight IUGR newborns had upregulated PPARγ with variable changes in co-repressors and co-activators. As obese adults, Mat-OB and IUGR offspring had increased PPARγ with decreased co-repressor and increased co-activator expression. Nutritionally programmed increased PPARγ expression is associated with altered expression of its co-regulators in the newborn and adult offspring. Functional studies of PPARγ co-regulators are necessary to establish their role in PPARγ-mediated programmed obesity.
Keywords: Peroxisome proliferator-activated receptors, co-activator proteins, co-repressor proteins, maternal obesity, maternal under-nutrition
Introduction
The contribution of developmental programming resulting from perturbed maternal nutrition to the obesity epidemic is well recognized. Evidence from epidemiological studies and animal models indicate that maternal overnutrition (e.g. obesity and high fat diet) as well as maternal under-nutrition is associated with increased risk of offspring obesity. Notably in humans, both low and high birth weight lead to increased risk for childhood and adult obesity, suggesting increased risk of obesity at both ends of the birth weight spectrum.1 Animal models have replicated human epidemiologic findings and have identified adipose tissue as one of the principal targets contributing to offspring obesity.2,3
Adipogenesis involves adipocyte differentiation, lipogenesis and lipid accumulation within the adipocytes.4 Adipocyte differentiation is triggered by a set of interacting transcription factors, the peroxisome proliferator-activated receptor gamma (PPARγ) and CCAAT/enhancer binding proteins (C/EBPβ, C/EBPα).5 In particular, C/EBPs activate the principal adipogenic transcription factor, PPARγ, leading to terminal adipocyte differentiation.5 Activated PPARγ induces lipogenic transcription factor sterol regulatory element binding protein (SREBP1)6 and SREBP1, in turn, induces the expression of lipolytic (lipoprotein lipase) and lipogenic (fatty acid synthase) enzymes, which modulate fatty acid uptake and synthesis.7 In addition, the lipolytic enzyme, hormone-sensitive lipase, hydrolyzes intracellular triglycerides and enables fatty acid release from adipocytes.8 The transcriptional activity of PPARγ is modulated by select co-repressors, (SIRT1, sirtuin; NCoR, nuclear receptor co-repressor; SMRT, silencing mediator for retinoid and thyroid hormone receptor)9 and co-activators (p160 family members: SRC1, steroid receptor co-activator 1; TIF2, transcriptional intermediary factor 1).10
Adipogenesis occurs in both the prenatal and postnatal states, though there is now convincing evidence that adipogenesis occurs throughout the lifetime. In rodents, white adipose tissue develops mainly after birth. In humans, white adipose tissue development begins early in the second trimester of gestation and by birth is well developed in both the visceral and subcutaneous depots.11,12
We have established rat models of maternal obesity and maternal food-restriction that result in programmed offspring obesity.13,14 Maternal obesity results in normal birth weight newborns that exhibit early (neonatal) onset of obesity (Mat-OB), hypertriglyceridemia and insulin resistance.13 In contrast, maternal food-restriction results in growth restricted newborns (IUGR) that develop later (adult) obesity as well as hypertriglyceridemia and insulin resistance.14 In the IUGR offspring, we have demonstrated that the obesity is, in part, a result of increased adipogenesis and lipogenesis with increased expression of the adipogenic transcription factor PPARγ that is evident in newborn and adult offspring.15,16 Importantly, we have shown functional changes in lipogenesis of increased adipose tissue de novo synthesis and desaturase activity in IUGR and Mat-OB male newborns.17,18 In addition, using primary cell cultures we have demonstrated increased preadipocyte proliferation, increased adipocyte lipid content and increased adipocyte glucose uptake in IUGR males at ages, 1 day and 3 weeks.19
We hypothesized that programmed Mat-OB offspring obesity was similarly associated with increased expression of PPARγ. In view of the increased adipogenic factors in IUGR offspring, we sought to determine if concomitant alterations in PPARγ co-regulator expression accompanied increased PPARγ expression.
Methods
Animals and Diet
Studies were approved by the Animal Research Committee of the Los Angeles BioMedical Research Institute at Harbor-UCLA (LABioMed), and were in accordance with the American Association for Accreditation of Laboratory Care (AALC), and National Institutes of Health (NIH) guidelines. Both rat models have been previously described.13,14 Briefly, Sprague Dawley rats (Charles River Laboratories, Hollister, California) were housed with a 12 hours day / night cycle with lights on at 6:00 am in a temperature (21±1°C) controlled room. At weaning the rat pups were housed 4 per cage. The animals were separated to two per cage at 125 g and into singular housing when their weight was above 250 g, such that no cage contained more than 500 g of total rat body weight. All rats were housed in polycarbonate cages (Ancar Corp; Bellmore, NY) filled with paperchip bedding (Sherpherd Specialty Papers; Watertown, TN) enriched with red plastic boxes and nylabones for enrichment.
Mat-OB Model
Weanling female rats were fed ad libitum diet with either a normal fat (10% kcal fat, Research Purified Diet 12450B58Y2, New Brunswick, NJ; Control n=6) or a high fat (60% kcal, Purified Diet 1249258Y1, New Brunswick, NJ; Mat-OB; n=6) content. At 11 weeks of age, rats were mated and continued on their respective diets during pregnancy and lactation.
IUGR Model
First time pregnant rats (~11 weeks of age) were fed ad libitum diet of standard laboratory chow (Lab Diet 5001, Brentwood, MO) until gestation day10, at which time they were either continued on ad libitum diet (Control; n=12) or provided 50% food-restricted diet determined by quantification of normal intake in Controls (IUGR; n=6) until term.
In both models, at day 1 after birth, litter size was reduced to 4 males and 4 females to standardize lactation. Individual body weights were recorded. To allow catch-up growth, all IUGR newborns were cross-fostered to Control dams fed ad libitum during pregnancy and lactation, and all Control and Mat-OB pups were cross-fostered to dams of the same diet to normalize the study design. All offspring were weaned to the diet consumed by their respective controls (Mat-OB to normal fat diet 12450B58Y2 and IUGR to standard laboratory chow diet 5001) at 3 weeks of age. Since estrogen is known to affect adiposity and lipid metabolism20, we elected to study male offspring as females would have required estrus assessment.
Body composition
At 9 months of age, 1 male from each of 6 different litters in each group (n=6) were anesthetized using Ketamine (90 mg/kg i.p.) and Xylazine (10 mg/kg, i.p.) and placed in a micro-isolator cage with warm water bottles to avoid hypothermia. Rats underwent a short (1–2 min) non-invasive dual energy X-ray absorptiometry (DEXA) scan (software program for small animals; QDR 4500A; Hologic, Bedford, MA) to obtain an in vivo scan of body composition.
Plasma Analysis
At 9 months of age, one male from each litter was fasted overnight and blood was collected via cardiac puncture in heparinized tubes for analysis. Plasma insulin was measured using rat specific commercial radioimmunoassay kits (insulin RIA kit, LINCO Research Inc., St. Charles, MO). Plasma triglycerides were measured using Raichem Enzymatic Reagents (Cat No. 80008, Raichem, Inc., San Diego, CA) with control serum level 1 (#83082) and control serum level 2 (#83083) and run on an automated Cobas-Mira Chemistry Analyzer (Roche Diagnostic Systems Inc., Sommerville, NJ). Blood glucose determined using Hemocue B-Glucose Analyzer (HemoCue Inc, Mission Viejo, CA).
Adipose Tissue Analysis
At day one after birth, adipose tissue was collected from the pups that were culled to standardize the litter size. Newborns were decapitated and inguinal (subcutaneous) adipose tissue was pooled from 4 males per litter. At 9 months of age, retroperitoneal (visceral) adipose tissue, which is associated with obesity and insulin resistance21,22 was collected and samples frozen in liquid nitrogen and stored at −80°C till protein analysis. To control for litter effects in the adult studies, one male was studied from each of the litters. Thus when n = 6, it represents one male from each of 6 different litters in Control, IUGR and Mat-OB groups.
Protein was extracted in radioimmuno precipitation assay (RIPA) buffer that contained protease inhibitors (HALT cocktail, Pierce). Supernatant protein concentration was determined by BCA solution (PIERCE, Rockford, IL). Protein expression was determined by Western Blotting, as previously described.15 Antibodies were obtained from Santa Cruz, CA unless otherwise specified and the band density was analyzed as indicated: PPARγ (57 kDa; Thermo Scientific, Rockford, IL), C/EBPα (42 kDa), SREBP1c (125 kDa), FAS (270 kDa), hormone sensitive lipase (84 kDa), SIRT1 (120 kDa), NCoR (270 kDa), SMRT (160 kDa), SRC1 (160 kDa), TIF2 (158 kDa) and β-actin (Sigma, A-5441; 40 kDa).
Statistical Analysis
Differences between Mat-OB/IUGR and Control groups were compared using unpaired Student’s T-test. Protein values were normalized to β-actin, which showed no differences between groups at 1 day or 9 months of age. Values are presented as fold change (mean ± SE).
Results
Body Weight, Body Fat and Food Intake
As previously reported,13,14 Mat-OB dams had higher body weights at mating, and throughout pregnancy and lactation as compared to Control dams. Further, the total food intake was similar among the two groups of dams with Mat-OB receiving greater percentage of kilocalories via fat. As intended, food-restricted dams had consistently lower body weight.
At 1 day of age, IUGR pups had reduced body weight (6.8 ± 0.2 vs. 7.2 ± 0.2 g, P <0.01) whereas Mat-OB offspring had similar body weight (7.4 ± 0.2 vs. 7.3 ± 0.1 g) to the Controls. Both Mat-OB and IUGR offspring had increased food intake and corresponding increased weight gain compared with their respective controls, both during lactation and throughout the post-weaning period.13,14 Subsequently, at 9 months of age, both Mat-OB and IUGR male offspring weighed significantly more than did their respective Controls (Mat-OB: 875 ± 27 vs. 660 ± 20 g, P <0.001; IUGR: 742 ± 15 vs. 647 ± 18 g, P <0.001). This was reflected by greater percentage of body fat in both Mat-OB (30.7 ± 2.1 vs. 15.9 ± 1.7 %, P <0.001) and IUGR (20.3 ± 1.6 vs. 12.4 ± 1.5 %, P <0.001) offspring compared with their respective Controls.
Metabolic Profile
At 9 months of age, both Mat-OB and IUGR male offspring had significantly higher levels of blood glucose, plasma insulin and plasma triglycerides as compared to their respective Controls (Table 1).
Table 1.
Metabolic Profile of Adult Males
| Adult | Glucose (mg/dl) | Insulin (ng/ml) | Triglyceride (mg/dl) |
|---|---|---|---|
| Control | 104 ± 2 | 0.62 ± 0.05 | 52 ± 6 |
| IUGR | 115 ± 3** | 0.83 ± 0.08* | 97 ± 8*** |
| Control | 97 ± 3 | 0.69 ± 0.04 | 85 ± 8 |
| Mat-OB | 116 ± 4** | 1.90 ± 0.09** | 126 ± 12*** |
Blood glucose and plasma triglyceride and insulin in overnight fasted 9 month old Control, IUGR and Mat-OB males.
Values are Mean ± SE.
P <0.05;
P < 0.01;
P < 0.001 vs. respective Controls.
Protein Expression of Adipogenic and Lipid Factors
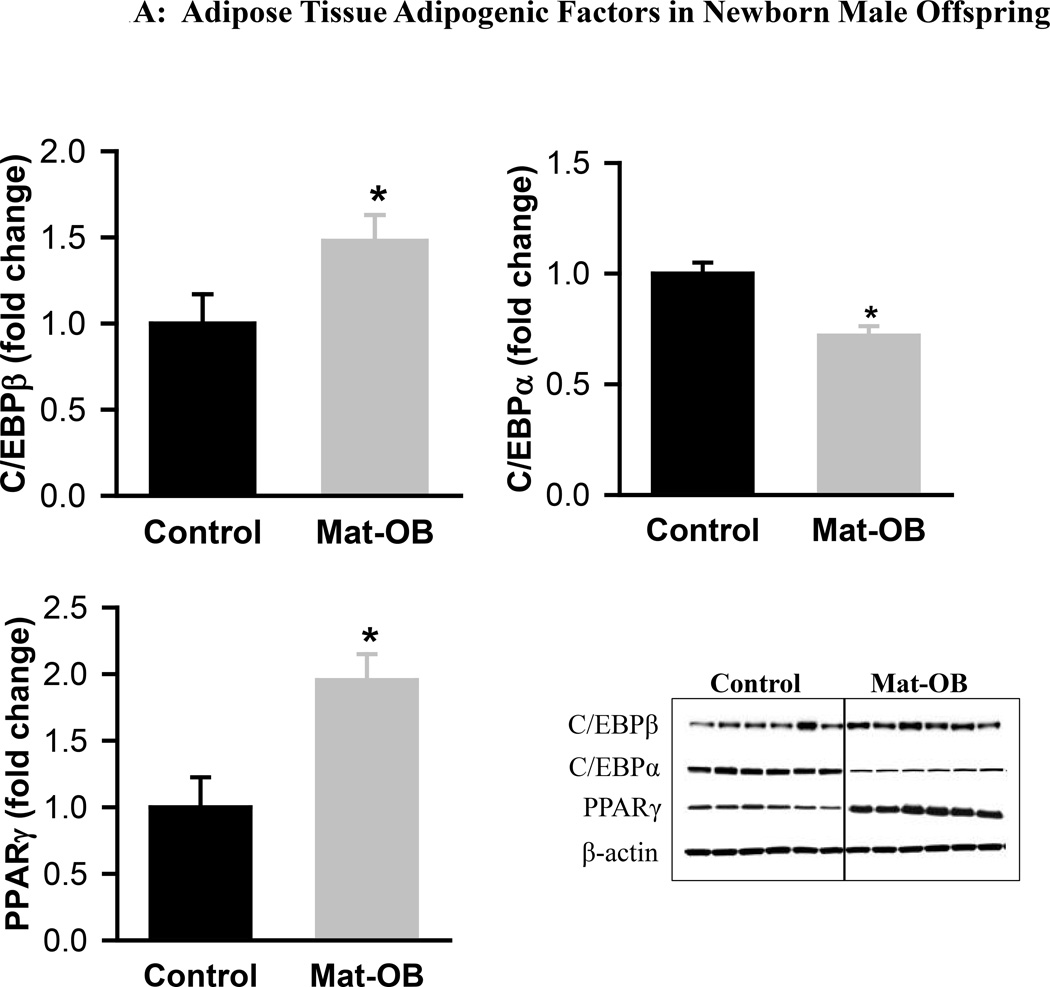
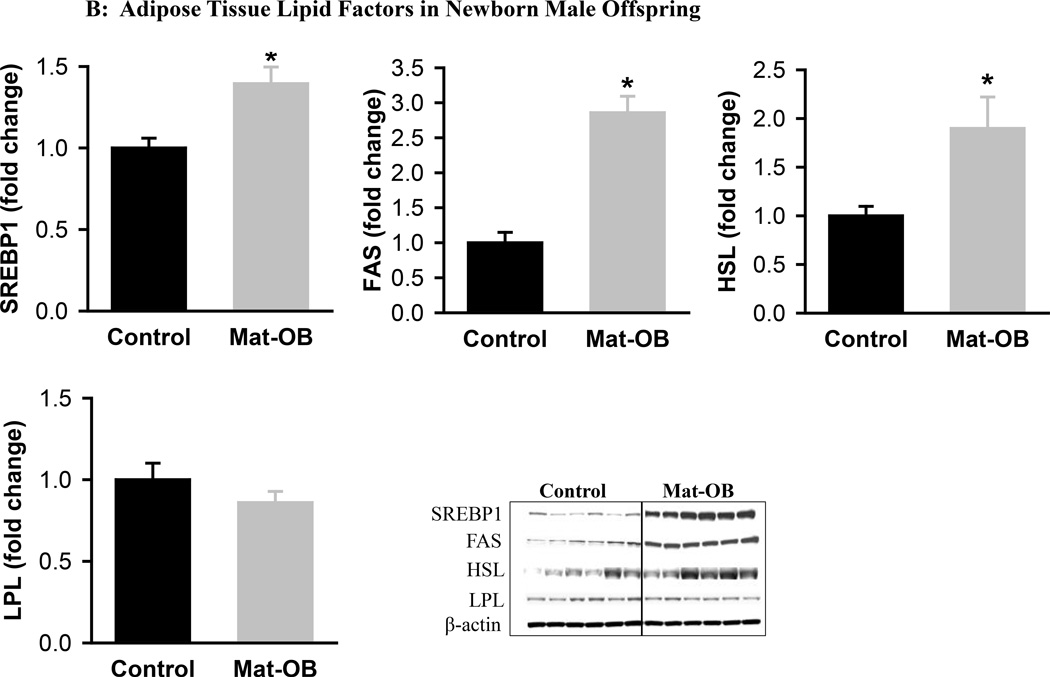
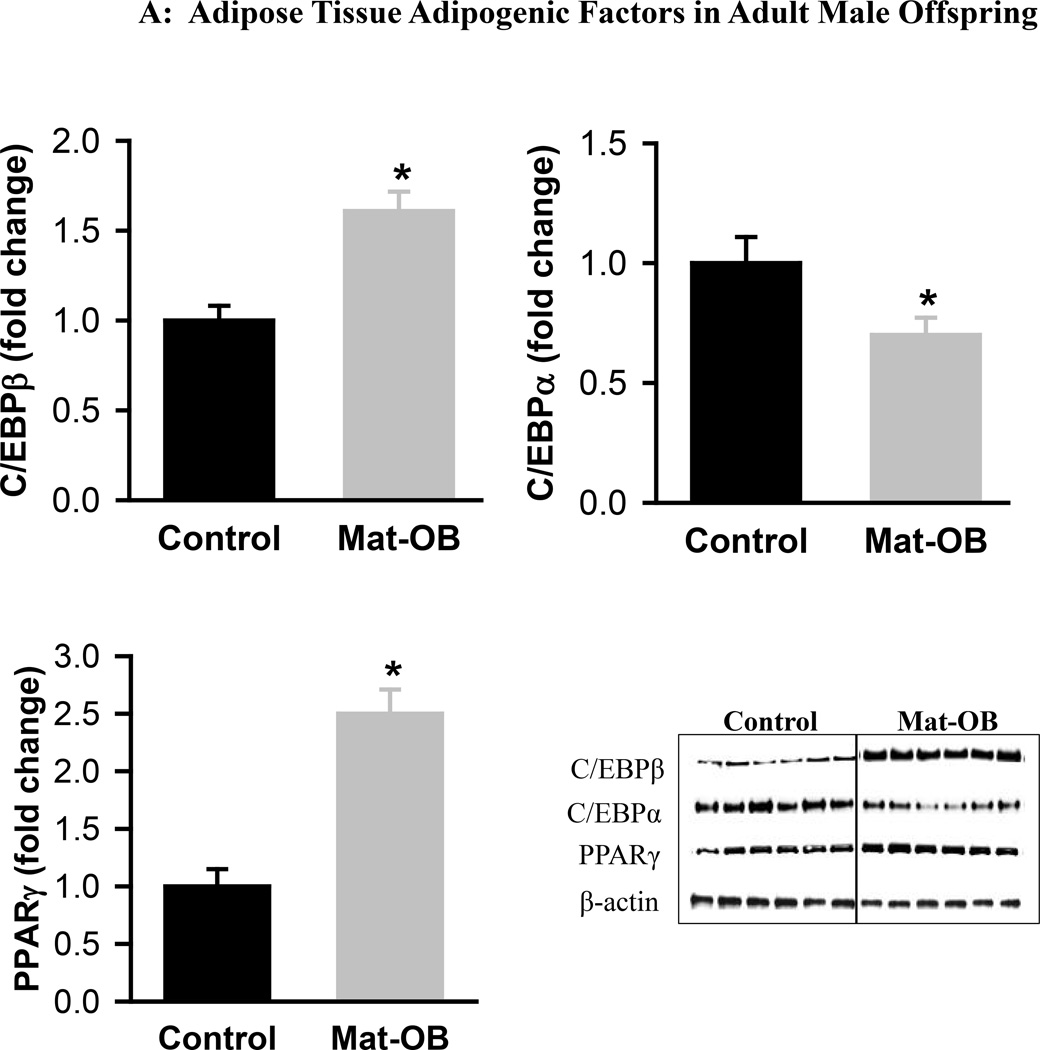
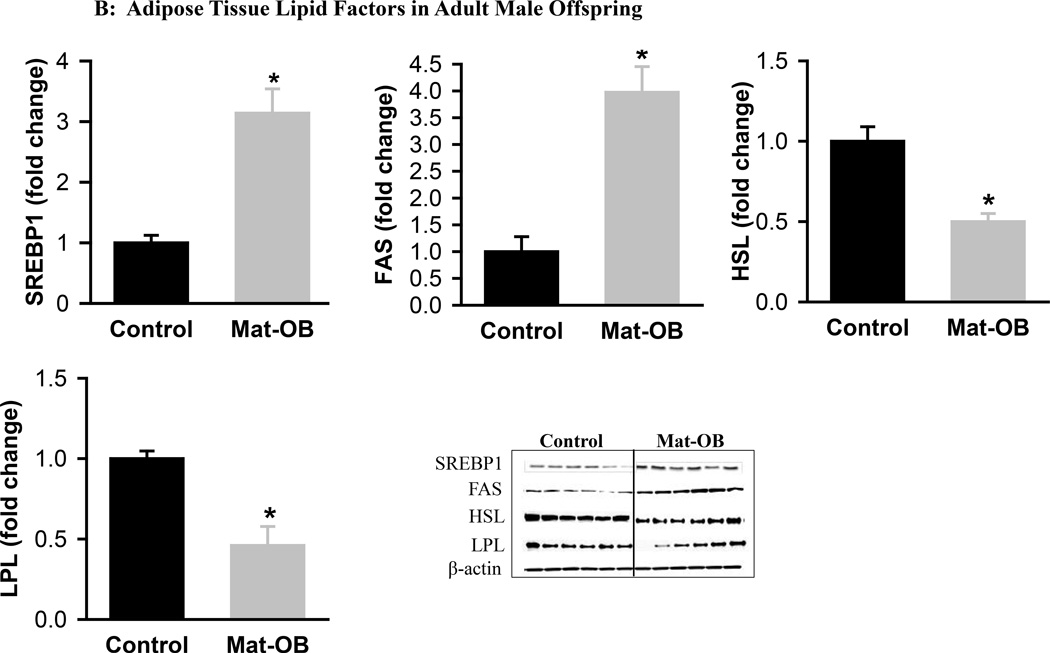
Mat-OB newborns at 1 day of age had increased adipose tissue protein expression of adipogenic transcription factors PPARγ (2-fold) and C/EBPβ (~1.5-fold), whereas C/EBPα was decreased compared with Controls (Figure 1A). In addition, Mat-OB newborns demonstrated increased protein expression of lipogenic factors (SREBP1, 1.5-fold; fatty acid synthase, 3-fold) as well as intracellular lipolytic enzyme (hormone-sensitive lipase, 1.8-fold) though with unchanged lipoprotein lipase compared with Controls (Figure 1B). At 9 months of age, Mat-OB males showed persistent increased expression of PPARγ (2.5-fold), SREBP1 (3-fold) and fatty acid synthase (4-fold) and decreased expression of C/EBPα (0.6-fold) and both lipases (~0.5-fold; Figures 2A and B).
Figure 1. Adipose Tissue Adipogenic and Lipid Factors in Newborn Male Offspring.
Protein expression of (A) peroxisome proliferator-activated receptor (PPARγ) and CCAAT/enhancer binding protein family members (C/EBPβ and C/EBPα) and (B) sterol regulatory element binding protein (SREBP1), fatty acid synthase (FAS), hormone sensitive lipase (HSL) and lipoprotein lipase (LPL) in Control (■) and Mat-OB ( ) newborn males. Data are normalized to β-actin and presented as fold change. Adipose tissue was studied from pooled male samples from each of the 6 litters per group. *P < 0.01 vs. Control offspring.
Figure 2. Adipose Tissue Adipogenic and Lipid Factors in Adult Male Offspring.
Protein expression of (A) peroxisome proliferator-activated receptor (PPARγ) and CCAAT/enhancer binding protein family members (C/EBPβ and C/EBPα) and (B) sterol regulatory element binding protein (SREBP1), fatty acid synthase (FAS), hormone sensitive lipase (HSL) and lipoprotein lipase (LPL) in Control (■) and Mat-OB ( ) adult males. Data are normalized to β-actin and presented as fold change. Number of animals studied was 1 male from each of 6 litters per group. *P < 0.001 vs. Control offspring.
IUGR newborns, as previously reported,14 had increased protein expression of adipogenic transcription factors (PPARγ, 2.3-fold; C/EBPβ, 2.1-fold; C/EBPα,2.3 −fold), however the expression of SREBP1, hormone-sensitive lipase and fatty acid synthase were similar in IUGR and Control newborns.14 At 9 months of age, IUGR males continued to exhibit increased protein expression of PPARγ (1.8-fold) and C/EBPβ (2.1-fold), but not C/EBPα (1.3-fold) compared with Controls, as well as increased expression of SREBP1 (1.7-fold) and lipid enzymes (hormone sensitive lipase, 6.4-fold; fatty acid synthase, 1.8-fold).14
Protein Expression of PPARγ Co-regulators
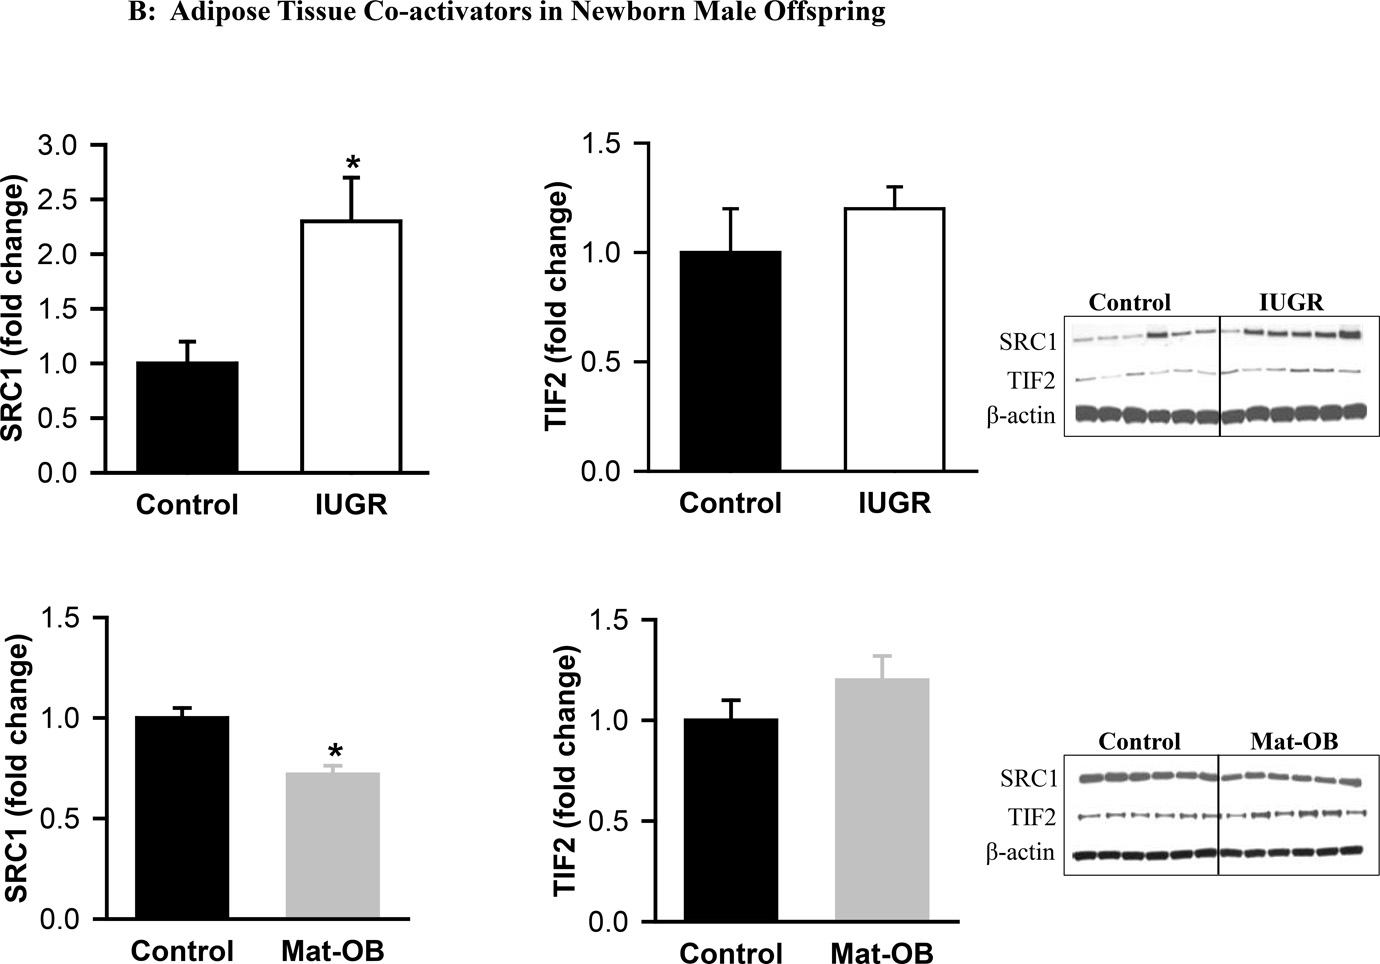
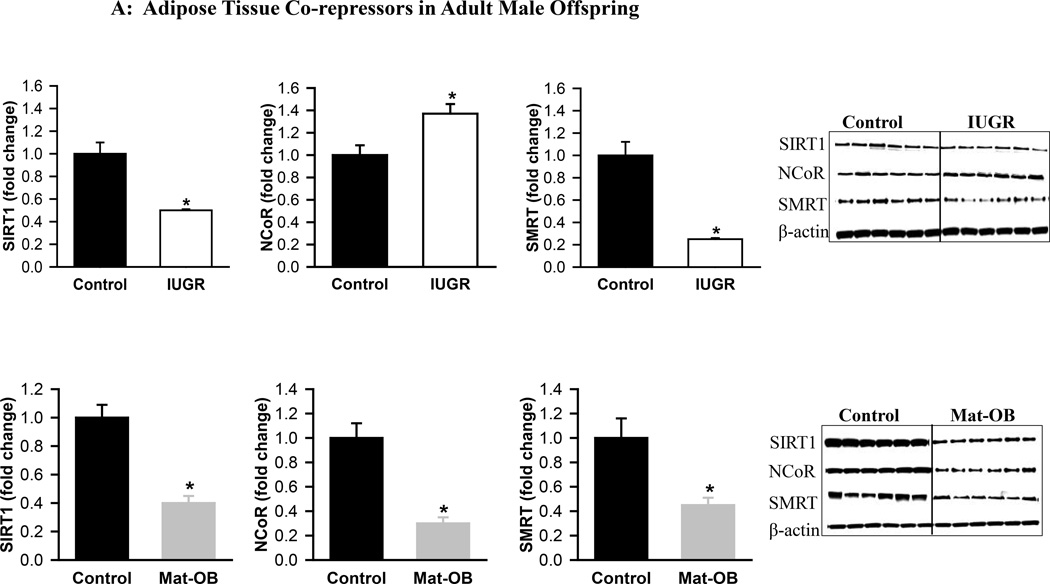
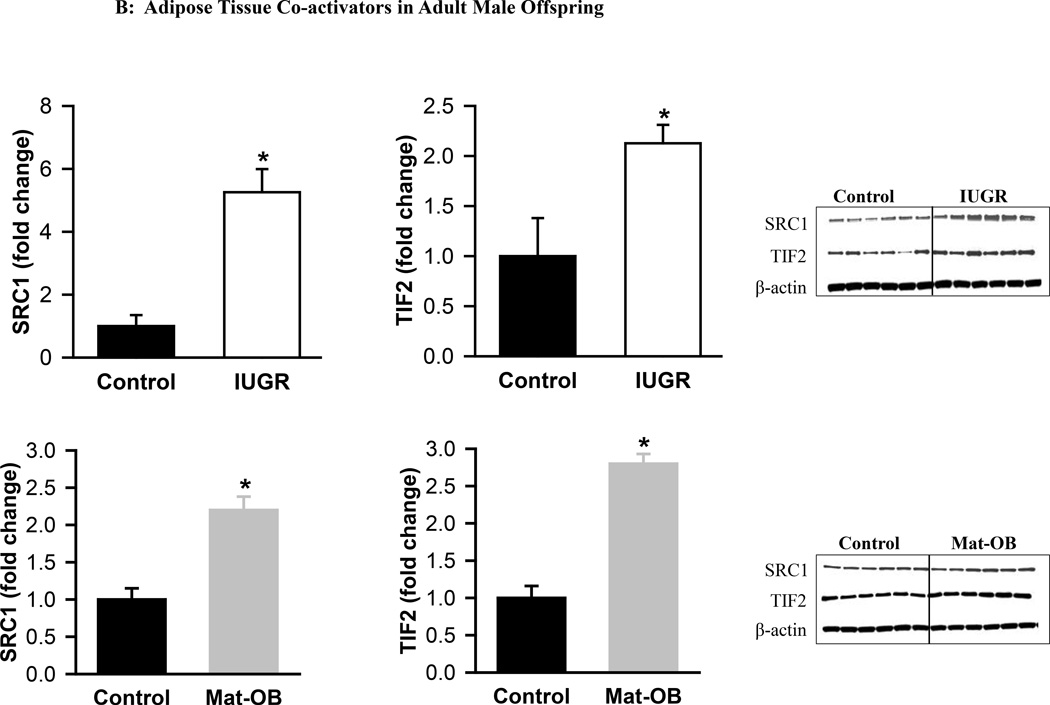
At 1 day of age, Mat-OB newborns had decreased protein expression of all co-repressors (SIRT1, NCoR, SMRT) and the co-activator SRC1 (Figure 3A). TIF2 expression was unchanged (Figure 3B). At 9 months of age, Mat-OB males continued to show reduced levels of co-repressor protein (SIRT1, NCoR, SMRT), though with increased protein expression of co-activators (SRC1, TIF2; Figures 4A and B).
Figure 3. Adipose Tissue Co-repressors and Co-activators in Newborn Male Offspring.
Protein expression of (A) co-repressor proteins Sirtuin (SIRT1), NCoR (nuclear receptor co-repressor) and SMRT (silencing mediator for retinoid and thyroid hormone receptor) and (B) co-activator proteins SRC1 (steroid receptor co-activator 1) and TIF2 (transcriptional intermediary factor 1) in Control (■), IUGR (□) and Mat-OB ( ) newborn males. Data are normalized to β-actin and presented as fold change. Adipose tissue was studied from pooled male samples from each of the 6 litters per group. *P < 0.001 vs. Control offspring.
Figure 4. Adipose Tissue Co-repressors and Co-activators in Adult Male Offspring.
Protein expression of (A) co-repressor proteins Sirtuin (SIRT1), NCoR (nuclear receptor co-repressor) and SMRT (silencing mediator for retinoid and thyroid hormone receptor) and (B) co-activator proteins SRC1 (steroid receptor co-activator 1) and TIF2 (transcriptional intermediary factor 1) in Control (■), IUGR (□) and Mat-OB ( ) adult males. Data are normalized to β-actin and presented as fold change. Number of animals studied was 1 male from each of 6 litters per group. *P < 0.001 vs. Control offspring.
At 1 day of age, IUGR males exhibited increased expression of co-repressors SIRT1 and SMRT though with decreased expression of NCoR (Figure 3A). The co-activator SRC1 was increased, whereas TIF2 expression was unchanged (Figure 3B). At 9 months of age, expression of SIRT1 and SMRT was decreased, but NCoR expression was paradoxically increased in IUGR males (Figure 4A). In addition to increased TIF2, SRC1 expression continued to be increased (Figures 3B and 4B).
Discussion
Despite divergent maternal nutrient exposure and intrauterine growth, offspring exposed to maternal obesity and maternal under-nutrition develop obesity, insulin resistance and hypertriglyceridemia. In the current study, even though the Mat-OB newborns were normal birth weight, they had increased protein expression of the adipogenic transcription factor PPARγ, as well as its upstream regulatory transcriptional factor, C/EBPβ. Concomitant with this, Mat-OB newborns exhibited increased lipogenic potential, as indexed by increased SREBP1 and fatty acid synthase that persisted in adult offspring. However, both lipase enzymes were decreased in Mat-OB adult offspring, suggesting decreased adipocyte uptake and release of fatty acids. Although IUGR newborns had lower birth weight, they too exhibited programmed upregulation of adipogenic signaling cascade. We have previously demonstrated that these changes persist in adult offspring who also show evidence of increased lipogenesis and adipose tissue lipases, indicating enhanced fatty acid uptake, synthesis and release from adipocytes.15
Unlike IUGR offspring, Mat-OB newborns, as well as adult offspring, had significantly decreased C/EBPα expression compared with Controls. Although C/EBPα is known to promote adipocyte differentiation,23 it does so only in the presence of PPARγ, whereas PPARγ can induce adipogenesis in absence of C/EBPα .24 Accordingly, C/EBPα deficient cells are capable of adipocyte differentiation, though these cells are insulin resistant.25 Consistent with these data, although C/EBPα expression was decreased in Mat-OB offspring, they had increased adipocyte differentiation and insulin resistance.13
The protein expression of both hormone-sensitive lipase, which regulates the release of intracellular fatty acids, and lipoprotein lipase, which controls the entry of exogenous fatty acids into adipose tissue, were decreased in the adult Mat-OB offspring, in contrast to increased expression of these lipases that occurred in adult IUGR offspring.14 Hormone-sensitive lipase levels increase under conditions of starvation26 and decrease in obese insulin-resistant state.27 Similarly, increased lipoprotein lipase activity is associated with obesity28 and reduced/deficient levels lead to hypertriglyceridemia with increased up-regulation of de novo fatty acid synthesis.29 Thus, reduced expression of both lipases may contribute to the insulin resistance, hypertriglyceridemia, decreased release of fatty acids from the adipocytes and increased de novo fatty acid synthesis observed in Mat-OB offspring.13,18
Despite the marked difference in nutrient environments and differing birth weights, both Mat-OB and IUGR offspring had enhanced adipogenesis and lipogenesis with upregulated PPARγ expression that was evident at birth. Regardless of the increased PPARγ expression, the co-regulator proteins were differentially expressed. Overall, in Mat-OB newborns the co-regulators were suppressed, whereas in IUGR newborns they were increased. Notably, in both Mat-OB and IUGR adults, there was predominantly decreased expression of co-repressor proteins and increased expression of co-activator proteins, consistent with increased expression of PPARγ and their obese phenotype.
Reduced NCoR is associated with greater insulin sensitivity, as demonstrated by adipocyte specific NCoR knockout mice.30 In IUGR offspring, the changes in NCoR expression are consistent with their glucose/insulin status – newborns with reduced NCoR and increased insulin sensitivity and adults with increased NCoR and an insulin resistant phenotype.14,31 In Mat-OB offspring, changes in NCoR expression are more consistent with their obese phenotype rather than their insulin resistant phenotype.
Consumption of a high-fat diet is associated with increased expression of SRC1 and TIF2 in adipose tissue, as well as an increase in the ratio of TIF2/SRC1 expression, which may contribute to weight gain.32 In the present study, Mat-OB newborns show decreased SRC1 expression, while IUGR newborns had increased SRC1. Accordingly, Mat-OB newborns had an increased ratio of TIF2/SRC1 expression (~2) and we have previously shown that they exhibit accelerated weight gain during the nursing period.13 Notably, SRC1 also regulates the expression and the transcriptional activity of C/EBPα gene,33 and C/EBPα in turn, regulates SIRT1 expression during adipogenesis.34 This is consistent with our findings of decreased expression of SRC1, C/EBPα and SIRT1 in Mat-OB newborns, and increased SRC1, C/EBPα and SIRT1 in IUGR newborns.15
In both IUGR and Mat-OB offspring, the co-activator TIF2 was unchanged in the newborns, whereas it was upregulated in adulthood, suggesting that increased TIF2 expression may not be developmentally programmed, but rather may occur secondary to increased fat storage in obese adult offspring. This is consistent with increased lipid accumulation seen in 3T3-L1 cell line that had overexpressed TIF2, and importantly, this occurred only in the presence of PPARγ.32 Further supporting evidence emerges from TIF2 knockout mice that have lower PPARγ, reduced potential for fat storage and are protected against obesity when fed a high fat diet.32
The regulation of PPARγ transcription is not only dependent upon the presence of co-regulators9,10 but is also modulated by energy status,35 and the availability of PPARγ ligands.36,37 In newborn offspring, the variable effects of nutritional programming on PPARγ co-regulator proteins may be attributed to the availability of PPARγ ligands. In the absence of its ligand, PPARγ enlists co-repressors37 whereas upon ligand binding to PPARγ, the co-repressors are released and co-activators recruited.38,39 Unsaturated fatty acids, including palmitoleate and oleate are natural ligands for PPARγ,40,41 and we have previously shown that the plasma palmitoleate and oleate levels are higher in IUGR newborns17 whereas Mat-OB newborns have lower palmitoleate levels.18 We speculate that changes in the availability of plasma fatty acid ligands may affect the recruitment of PPARγ co-activator and co-repressor proteins that activate gene expression and drive adipogenesis.
Increased PPARγ levels are seen in adipose tissue of obese animals and humans.42–44 Further higher levels are associated with high fat diet and decreased levels occur during fasting.38 Specifically, PPARγ expression is downregulated in obese humans on a low calorie diet45 and obese rodents undergoing exercise.46,47 In addition, SIRT1 which represses PPARγ,9 is also a nutrient sensor that increases in response to under-nutrition with reduction in fat storage and an increase in lipolysis.9,48. The downregulated SIRT1 in Mat-OB offspring born to overnourished dams in the current study is consistent with their exposure to the maternal high-fat diet, and likely contributes to the increased expression of PPARγ in these animals. Although the upregulated SIRT1 in IUGR offspring at birth is also consistent with its role as a nutrient sensor, the mechanism underlying the failure of SIRT1 to suppress PPARγ in these animals is presently unknown. The effect of modulating co-regulators of PPARγ on adipogenesis and lipid storage has been effectively demonstrated using 3T3 cells as stated above, wherein increased expression of co-activators and decreased expression of co-repressors induce fat storage.32,49
In conclusion, our studies show that despite the divergent nutritional environment, Mat-OB offspring demonstrate enhanced adipogenesis akin to IUGR newborns. Mat-OB newborns, unlike IUGR, showed early induction of lipogenic factors likely contributing to early onset of adiposity and associated metabolic abnormalities, which exacerbate with age.13 Thus both under- and over-nutrition programs increased adipogenesis. Although the underpinning contributory factor in both models is attributed to upregulated PPARγ, it may be mediated via different mechanisms. Differential recruitment of co-activators and co-repressors in IUGR and Mat-OB may provide the basis for a transcriptional switch that controls adipocyte differentiation and lipogenesis. However, further functional studies are required to elucidate the relative roles of different co-regulator proteins in the activation of PPARγ in nutritionally programmed obesity.
Acknowledgments
We thank Stacy Behare and Linda Day for animal assistance.
Our work was supported by National Institute of Diabetes and Digestive and Kidney Grants R01DK081756 and National Institute of Child Health and Human Development Grant R01HD054751.
Footnotes
The work was done at the Los Angeles Biomedical Research Institute at Harbor-UCLA Medical Center, Department of Obstetrics and Gynecology, Perinatal Research Laboratories Torrance, CA.
References
- 1.Ross MG, Desai M. Developmental programming of offspring obesity, adipogenesis, and appetite. Clin Obstet Gynecol. 2013;56(3):529–536. doi: 10.1097/GRF.0b013e318299c39d. [DOI] [PMC free article] [PubMed] [Google Scholar]
- 2.Desai M, Ross MG. Fetal programming of adipose tissue: effects of intrauterine growth restriction and maternal obesity/high-fat diet. Semin Reprod Med. 2011;29(3):237–245. doi: 10.1055/s-0031-1275517. [DOI] [PMC free article] [PubMed] [Google Scholar]
- 3.Breton C. The hypothalamus-adipose axis is a key target of developmental programming by maternal nutritional manipulation. J Endocrinol. 2013;216(2):R19–R31. doi: 10.1530/JOE-12-0157. [DOI] [PubMed] [Google Scholar]
- 4.Ailhaud G, Grimaldi P, Négrel R. Cellular and molecular aspects of adipose tissue development. Annu Rev Nutr. 1992;12:207–233. doi: 10.1146/annurev.nu.12.070192.001231. [DOI] [PubMed] [Google Scholar]
- 5.Rosen ED, Walkey CJ, Puigserver P, Spiegelman BM. Transcriptional regulation of adipogenesis. Genes Dev. 2000;14(11):1293–1307. [PubMed] [Google Scholar]
- 6.Fajas L, Schoonjans K, Gelman L, et al. Regulation of peroxisome proliferator-activated receptor gamma expression by adipocyte differentiation and determination factor 1/sterol regulatory element binding protein 1: implications for adipocyte differentiation and metabolism. Mol Cell Biol. 1999;19(8):5495–5503. doi: 10.1128/mcb.19.8.5495. [DOI] [PMC free article] [PubMed] [Google Scholar]
- 7.Kim JB, Spiegelman BM. ADD1/SREBP1 promotes adipocyte differentiation and gene expression linked to fatty acid metabolism. Genes Dev. 1996;10(9):1096–1107. doi: 10.1101/gad.10.9.1096. [DOI] [PubMed] [Google Scholar]
- 8.Holm C, Osterlund T, Laurell H, Contreras JA. Molecular mechanisms regulating hormone-sensitive lipase and lipolysis. Annu Rev Nutr. 2000;20:365–393. doi: 10.1146/annurev.nutr.20.1.365. [DOI] [PubMed] [Google Scholar]
- 9.Picard F, Kurtev M, Chung N, et al. Sirt1 promotes fat mobilization in white adipocytes by repressing PPAR-gamma. Nature. 2004;429(6993):771–776. doi: 10.1038/nature02583. [DOI] [PMC free article] [PubMed] [Google Scholar]
- 10.Feige JN, Auwerx J. Transcriptional coregulators in the control of energy homeostasis. Trends Cell Biol. 2007;17(6):292–301. doi: 10.1016/j.tcb.2007.04.001. [DOI] [PubMed] [Google Scholar]
- 11.Poissonnet CM, Burdi AR, Bookstein FL. Growth and development of human adipose tissue during early gestation. Early Hum Dev. 1983;8(1):1–11. doi: 10.1016/0378-3782(83)90028-2. [DOI] [PubMed] [Google Scholar]
- 12.Desnoyers F. Morphological study of rat perirenal adipose tissue in the formative stage. Annales de Biologie Animale, Biochimie, Biophysique. 1977;17(5):787–798. [Google Scholar]
- 13.Desai M, Jellyman JK, Han G, Beall M, Lane RH, Ross MG. Rat maternal obesity and high-fat diet program offspring metabolic syndrome. Am J Obstet Gynecol. 2014;211(3):237.e1–237.e13. doi: 10.1016/j.ajog.2014.03.025. [DOI] [PMC free article] [PubMed] [Google Scholar]
- 14.Desai M, Gayle D, Babu J, Ross MG. Programmed obesity in intrauterine growth-restricted newborns: modulation by newborn nutrition. Am J Physiol Regul Integr Comp Physiol. 2005;288(1):R91–R96. doi: 10.1152/ajpregu.00340.2004. [DOI] [PubMed] [Google Scholar]
- 15.Desai M, Guang Han, Ferelli M, Kallichanda N, Lane RH. Programmed upregulation of adipogenic transcription factors in intrauterine growth-restricted offspring. Reprod Sci. 2008;15(8):785–796. doi: 10.1177/1933719108318597. [DOI] [PMC free article] [PubMed] [Google Scholar]
- 16.Yee JK, Lee WN, Ross MG, Lane RH, Han G, Vega J, Desai M. Peroxisome proliferator-activated receptor gamma modulation and lipogenic response in adipocytes of small-for-gestational age offspring. Nutr Metab (Lond) 2012;9(1):62. doi: 10.1186/1743-7075-9-62. [DOI] [PMC free article] [PubMed] [Google Scholar]
- 17.Yee JK, Lee WN, Han G, Ross MG, Desai M. Organ-specific alterations in fatty acid de novo synthesis and desaturation in a rat model of programmed obesity. Lipids Health Dis. 2011;10:72. doi: 10.1186/1476-511X-10-72. [DOI] [PMC free article] [PubMed] [Google Scholar]
- 18.Seet EL, Yee JK, Jellyman JK, Han G, Ross MG, Desai M. Maternal High-Fat-Diet Programs Rat Offspring Liver Fatty Acid Metabolism. Lipids. 2015 doi: 10.1007/s11745-015-4018-8. [Epub ahead of print] [DOI] [PMC free article] [PubMed] [Google Scholar]
- 19.Yee JK, Lee WN, Ross MG, et al. Peroxisome proliferator-activated receptor gamma modulation and lipogenic response in adipocytes of small-for-gestational age offspring. Nutr Metab (Lond) 2012;9(1):62. doi: 10.1186/1743-7075-9-62. [DOI] [PMC free article] [PubMed] [Google Scholar]
- 20.Cooke PS, Naaz A. Role of estrogens in adipocyte development and function. Exp Biol Med (Maywood) 2004;229(11):1127–1135. doi: 10.1177/153537020422901107. [DOI] [PubMed] [Google Scholar]
- 21.Gast KB, den Heijer M, Smit JW, Widya RL, Lamb HJ, de Roos A, Jukema JW, Rosendaal FR, de Mutsert R NEO study group. Individual contributions of visceral fat and total body fat to subclinical atherosclerosis: The NEO study. Atherosclerosis. 2015;241(2):547–554. doi: 10.1016/j.atherosclerosis.2015.05.026. [DOI] [PubMed] [Google Scholar]
- 22.Amutha A, Ali MK, Unnikrishnan R, Anjana RM, Ranjani H, Gokulakrishnan K, Mohan V, Narayan KM. Insulin sensitivity and secretion in youth onset type 2 diabetes with and without visceral adiposity. Diabetes Res Clin Pract. 2015;109(1):32–39. doi: 10.1016/j.diabres.2015.05.018. [DOI] [PubMed] [Google Scholar]
- 23.Umek RM, Friedman AD, McKnight SL. CCAAT-enhancer binding protein: a component of a differentiation switch. Science. 1991;251(4991):288–292. doi: 10.1126/science.1987644. [DOI] [PubMed] [Google Scholar]
- 24.Freytag SO, Paielli DL, Gilbert JD. Ectopic expression of the CCAAT/enhancer-binding protein alpha promotes the adipogenic program in a variety of mouse fibroblastic cells. Genes Dev. 1994;8(14):1654–1663. doi: 10.1101/gad.8.14.1654. [DOI] [PubMed] [Google Scholar]
- 25.Wu Z, Rosen ED, Brun R, et al. Cross-regulation of C/EBP alpha and PPAR gamma controls the transcriptional pathway of adipogenesis and insulin sensitivity. Mol Cell. 1999;3(2):151–158. doi: 10.1016/s1097-2765(00)80306-8. [DOI] [PubMed] [Google Scholar]
- 26.Sztalryd C, Kraemer FB. Regulation of hormone-sensitive lipase during fasting. Am J Physiol. 1994;266(2 Pt 1):E179–E185. doi: 10.1152/ajpendo.1994.266.2.E179. [DOI] [PubMed] [Google Scholar]
- 27.Jocken JW, Langin D, Smit E, et al. Adipose triglyceride lipase and hormone-sensitive lipase protein expression is decreased in the obese insulin-resistant state. J Clin Endocrinol Metab. 2007;92(6):2292–2299. doi: 10.1210/jc.2006-1318. [DOI] [PubMed] [Google Scholar]
- 28.Wang H, Eckel RH. Lipoprotein lipase: from gene to obesity. Am J Physiol Endocrinol Metab. 2009;297(2):E271–E288. doi: 10.1152/ajpendo.90920.2008. [DOI] [PubMed] [Google Scholar]
- 29.Weinstock PH, Levak-Frank S, Hudgins LC, et al. Lipoprotein lipase controls fatty acid entry into adipose tissue, but fat mass is preserved by endogenous synthesis in mice deficient in adipose tissue lipoprotein lipase. Proc Natl Acad Sci USA. 1997;94(19):10261–10266. doi: 10.1073/pnas.94.19.10261. [DOI] [PMC free article] [PubMed] [Google Scholar]
- 30.Li P, Fan W, Xu J, et al. Adipocyte NCoR knockout decreases PPARγ phosphorylation and enhances PPARγ activity and insulin sensitivity. Cell. 2011;147(4):815–826. doi: 10.1016/j.cell.2011.09.050. [DOI] [PMC free article] [PubMed] [Google Scholar]
- 31.Desai M, Gayle D, Babu J, Ross MG. The timing of nutrient restriction during rat pregnancy/lactation alters metabolic syndrome phenotype. Am J Obstet Gynecol. 2007;196(6):555.e1–555.e7. doi: 10.1016/j.ajog.2006.11.036. [DOI] [PMC free article] [PubMed] [Google Scholar]
- 32.Picard F, Géhin M, Annicotte J, et al. SRC-1 and TIF2 control energy balance between white and brown adipose tissues. Cell. 2002;111(7):931–941. doi: 10.1016/s0092-8674(02)01169-8. [DOI] [PubMed] [Google Scholar]
- 33.Louet JF, Chopra AR, Sagen JV, et al. The coactivator SRC-1 is an essential coordinator of hepatic glucose production. Cell Metab. 2010;12(6):606–618. doi: 10.1016/j.cmet.2010.11.009. [DOI] [PMC free article] [PubMed] [Google Scholar]
- 34.Jin Q, Zhang F, Yan T, Liu Z, Wang C, Ge X, Zhai Q. C/EBPalpha regulates SIRT1 expression during adipogenesis. Cell Res. 2010;20(4):470–479. doi: 10.1038/cr.2010.24. [DOI] [PubMed] [Google Scholar]
- 35.Larsen TM, Toubro S, Astrup A. PPARgamma agonists in the treatment of type II diabetes: is increased fatness commensurate with long-term efficacy? Int J Obes Relat Metab Disord. 2003;27(2):147–161. doi: 10.1038/sj.ijo.802223. [DOI] [PubMed] [Google Scholar]
- 36.Chui PC, Guan HP, Lehrke M, Lazar MA. PPARgamma regulates adipocyte cholesterol metabolism via oxidized LDL receptor 1. J Clin Invest. 2005;115(8):2244–2256. doi: 10.1172/JCI24130. [DOI] [PMC free article] [PubMed] [Google Scholar]
- 37.Jones PL, Shi YB. N-CoR-HDAC corepressor complexes: roles in transcriptional regulation by nuclear hormone receptors. Curr Top Microbiol Immunol. 2003;274:237–268. doi: 10.1007/978-3-642-55747-7_9. [DOI] [PubMed] [Google Scholar]
- 38.Vidal-Puig A, Jimenez-Liñan M, Lowell BB, et al. Regulation of PPAR gamma gene expression by nutrition and obesity in rodents. J Clin Invest. 1996;97(11):2553–2561. doi: 10.1172/JCI118703. [DOI] [PMC free article] [PubMed] [Google Scholar]
- 39.Hörlein AJ, Näär AM, Heinzel T, et al. Ligand-independent repression by the thyroid hormone receptor mediated by a nuclear receptor co-repressor. Nature. 1995;377(6548):397–404. doi: 10.1038/377397a0. [DOI] [PubMed] [Google Scholar]
- 40.Yokoi H, Mizukami H, Nagatsu A, Tanabe H, Inoue M. Hydroxy monounsaturated fatty acids as agonists for peroxisome proliferator-activated receptors. Biol Pharm Bull. 2010;33(5):854–861. doi: 10.1248/bpb.33.854. [DOI] [PubMed] [Google Scholar]
- 41.Grygiel-Górniak B. Peroxisome proliferator-activated receptors and their ligands: nutritional and clinical implications--a review. Nutr J. 2014;13:17. doi: 10.1186/1475-2891-13-17. [DOI] [PMC free article] [PubMed] [Google Scholar]
- 42.Tontonoz P, Spiegelman BM. Fat and beyond: the diverse biology of PPARgamma. Annu Rev Biochem. 2008;77:289–312. doi: 10.1146/annurev.biochem.77.061307.091829. [DOI] [PubMed] [Google Scholar]
- 43.Joss-Moore LA, Wang Y, Campbell MS, Moore B, Yu X, Callaway CW, McKnight RA, Desai M, Moyer-Mileur LJ, Lane RH. Uteroplacental insufficiency increases visceral adiposity and visceral adipose PPARgamma2 expression in male rat offspring prior to the onset of obesity. Early Hum Dev. 2010;86(3):179–185. doi: 10.1016/j.earlhumdev.2010.02.006. [DOI] [PMC free article] [PubMed] [Google Scholar]
- 44.Janesick A, Blumberg B. Minireview: PPARγ as the target of obesogens. J Steroid Biochem Mol Biol. 2011;127(1–2):4–8. doi: 10.1016/j.jsbmb.2011.01.005. [DOI] [PMC free article] [PubMed] [Google Scholar]
- 45.Vidal-Puig AJ, Considine RV, Jimenez-Liñan M, Werman A, Pories WJ, Caro JF, Flier JS. Peroxisome proliferator-activated receptor gene expression in human tissues. Effects of obesity, weight loss, and regulation by insulin and glucocorticoids. J Clin Invest. 1997;99(10):2416–2422. doi: 10.1172/JCI119424. [DOI] [PMC free article] [PubMed] [Google Scholar]
- 46.Sertie RA, Andreotti S, Proença AR, Campana AB, Lima-Salgado TM, Batista ML, Jr, Seelaender MC, Curi R, Oliveira AC, Lima FB. Cessation of physical exercise changes metabolism and modifies the adipocyte cellularity of the periepididymal white adipose tissue in rats. J Appl Physiol (1985) 2013;115(3):394–402. doi: 10.1152/japplphysiol.01272.2012. [DOI] [PubMed] [Google Scholar]
- 47.Sun C, Zeng R, Cao G, Song Z, Zhang Y, Liu C. Vibration Training Triggers Brown Adipocyte Relative Protein Expression in Rat White Adipose Tissue. Biomed Res Int. 2015;2015:919401. doi: 10.1155/2015/919401. [DOI] [PMC free article] [PubMed] [Google Scholar]
- 48.Schug TT, Li X. Sirtuin 1 in lipid metabolism and obesity. Ann Med. 2011;43(3):198–211. doi: 10.3109/07853890.2010.547211. [DOI] [PMC free article] [PubMed] [Google Scholar]
- 49.Sutanto MM, Ferguson KK, Sakuma H, Ye H, Brady MJ, Cohen RN. The silencing mediator of retinoid and thyroid hormone receptors (SMRT) regulates adipose tissue accumulation and adipocyte insulin sensitivity in vivo. J Biol Chem. 2010;285(24):18485–18495. doi: 10.1074/jbc.M110.107680. [DOI] [PMC free article] [PubMed] [Google Scholar]


