Abstract
The extradiol-cleaving dioxygenase homoprotocatechuate 2,3-dioxygenase (HPCD) binds substrate homoprotocatechuate (HPCA) and O2 sequentially in adjacent ligand sites of the active site FeII. Kinetic and spectroscopic studies of HPCD have elucidated catalytic roles of several active site residues, including the crucial acid base chemistry of His200. In the present study, reaction of the His200Cys (H200C) variant with native substrate HPCA resulted in a decrease in both kcat and the rate constants for the activation steps following O2 binding by > 400 fold. The reaction proceeds to form the correct extradiol product. This slow reaction allowed a long-lived (t1/2 = 1.5 min) intermediate, H200C-HPCAInt1 (Int1), to be trapped. Mössbauer and parallel mode electron paramagnetic resonance (EPR) studies show that Int1 contains an S1 = 5/2 FeIII center coupled to an SR = 1/2 radical to give a ground state with total spin S = 2 (J > 40 cm−1) in . Density functional theory (DFT) property calculations for structural models Int1 is a (HPCA semiquinone•)FeIII(OOH) complex, in which OOH is protonated at the distal O and the substrate hydroxyls are deprotonated. By combining Mössbauer and EPR data of Int1 with DFT calculations, the orientations of the principal axes of the 57Fe electric field gradient and the zero-field splitting (ZFS) tensors (D = 1.6 cm−1, E/D = 0.05) were determined. This information was used to predict hyperfine splittings from bound 17OOH. DFT reactivity analysis suggests that Int1 can evolve from a ferromagnetically coupled FeIII-superoxo precursor by an inner-sphere proton-coupled-electron-transfer process. Our spectroscopic and DFT results suggest that a ferric hydroperoxo species is capable of extradiol catalysis.
INTRODUCTION
The recovery of carbon from stable aromatic compounds by bacteria in the environment under aerobic conditions generally involves ring activation by the introduction of hydroxyl functional groups followed by oxidative ring cleavage.1-4 The latter process is catalyzed by dioxygenase enzymes that utilize an active site mononuclear iron, or in rare cases other metals, to activate O2 and to direct the incorporation of both atoms of oxygen into the substrate, opening the ring. Many examples of aromatic ring cleaving dioxygenases have been reported, but the enzymes that catalyze the cleavage of catechols and catechol derivatives are among the most extensively studied.5-18 These studies have shown that there are two families of catechol dioxygenases, namely, the FeIII-containing intradiol dioxygenases and the FeII-containing extradiol dioxygenases. The extradiol enzymes cleave the catechol ring at a position adjacent to the vicinal hydroxyl groups to yield beta-hydroxy muconic semialdehyde adducts. The mechanism of the extradiol dioxygenases has been most thoroughly studied using the enzyme homoprotocatechuate 2,3-dioxygenase (HPCD).13-15, 19-28
A detailed mechanistic proposal9, 16, 29 has emerged from the structural and spectroscopic observations that the homoprotocatechuate (HPCA) substrate binds to the iron as an asymmetric chelate complex with O2 occupying an adjacent ligand site.15, 26, 30 Asymmetric substrate binding suggests that only one of the two catecholic hydroxyl functional groups is deprotonated upon binding, a finding later confirmed in spectroscopic studies of a related enzyme.31 The central theme of the mechanistic proposal is that electron transfer from the substrate to the adjacent O2 would give both species radical character. Subsequent recombination of the radicals would result in formation of an alkylperoxo intermediate. Criegee rearrangement (or the equivalent stepwise process)32, 33 of the alkylperoxo intermediate would yield a seven-membered lactone ring, which could be hydrolyzed by the second oxygen derived from O2 to give the ring-opened product. In support of this mechanism, the use of active site variants and alternative chromophoric substrates has allowed detection of eight reaction cycle intermediates with spectroscopic and kinetic characteristics consistent with stepwise substrate binding, O2 binding and activation, aromatic ring-opening, and product dissociation.13-15, 20, 22, 24-26 Furthermore, when the reaction using the slow substrate 4-nitrocatechol (4NC) was carried out in a crystal of HPCD, the proposed O2, alkylperoxo, and product complexes were formed and trapped in different active sites within the asymmetric unit allowing their structural characterization.15 The diagnostic radical character in both iron-bound substrate and oxygen was supported by the observation of a slight distortion of the normally planar aromatic ring of the substrate in the oxygen complex.15, 26, 34 If this distortion arises due to single electron oxidation of the ring, then the likely electron acceptor is the iron-bound O2. The active site iron in this complex was proposed to be in the FeII oxidation state based on the observation of relatively long Fe-O2 bonds. Furthermore, the structure shows that O2 binds side-on and is properly aligned to form the alkylperoxo intermediate at the ring carbon bearing the deprotonated hydroxyl group.
The most controversial intermediate in the oxidation phase of the mechanism proposed by us and others 9, 16, 24-26, 29, 34, 35 for the wild-type enzyme is the ferrous biradical species (substrate SQ•)FeII(superoxo•) (SQ = semiquinone). This species might be formed by either direct electron transfer between the substrate and O2 or by a process mediated by the iron; the evidence supporting the latter is summarized in a recent review by Fielding, Lipscomb, and Que.28 It is important to note that no oxidation state other than FeII has ever been detected in Mössbauer studies of native HPCD for any substrate complex or intermediate trapped during single turnover reactions. In this mechanism, HPCD would formally operate without a net change in the iron oxidation state. This concept was tested by replacing the FeII with MnII or CoII, both of which have significantly higher redox potentials. No significant change in steady state parameters was observed, consistent with a mechanism in which the metal is not redox active.21, 23 However, a different result was obtained using active site mutations which introduced changes in the second sphere residues near the iron; many of these involved replacing the histidine residue at position 200 (H200).14, 22, 24 H200 has been proposed to be involved in (i) stabilization of the biradical species by charge and hydrogen bonding interactions, (ii) steric alignment of the two substrates to facilitate rapid radical recombination, and (iii) transfer of the second hydroxyl proton from the substrate to an alkylperoxo oxygen to promote O-O bond cleavage.14 When H200 was replaced by asparagine (H200N), and 4NC was used as the substrate, the proposed electron transfer and radical recombination reactions would appear to have slowed down or been bypassed, so that a new substrate-FeIII-superoxo oxygen intermediate species was trapped.22 This observation engendered several new types of questions regarding the nature of the reactive species and suggested that the transfer of an electron from the substrate to the O2 might occur in a stepwise rather than a concerted process. However, the FeIII-superoxo intermediate did not allow substrate ring cleavage, but rather resulted in slow ring oxidation to yield a 4NC quinone.24 The use of HPCA in place of 4NC in the reaction of the H200N variant led to another type of intermediate in which electrons from both the substrate and the iron were transferred to the oxygen to generate an FeIII-(hydro)peroxo species (H200N-HPCAInt1).24 In contrast to the FeIII-superoxo species, this intermediate did yield a ring-cleaved product, albeit at a very slow rate compared with the native reaction.
The putative (hydro)peroxo intermediate H200N-HPCAInt1 is significant for at least two reasons. First, its formation shows that FeIII states are readily accessible in the oxygen activation phase when H200 is absent. Second, its formation demonstrates the facile electron transfer between substrate and O2 that is at the heart of the proposed extradiol dioxygenase mechanism. However, the slow rate of HPCA ring cleavage exhibited by this variant also shows that either the resulting H200N-HPCAInt1 is not a good model for the reactive species in the wild type (WT) enzyme or that H200 accelerates the reaction such that the intermediate FeIII state is not detectable.
Earlier computational studies by Siegbahn et al.36 and more recent ones by Neese and co-workers37 and by Shaik, Dong and Lai34,38 suggest potential mechanistic pathways for the wild-type HPCD enzyme which involve FeIII intermediates. Neese's work supports a mechanism whereby an FeIII-superoxo intermediate is rapidly formed upon reaction of the ES complex with O2. Subsequently, in a multistep process, H200 forms a hydrogen bond to the proximal oxygen of the superoxide. This species then attacks the C2 carbon of the substrate to generate a peroxo-bridged intermediate; this process involves the transfer of two electrons from the substrate to the Fe-O2 fragment, one to the superoxo and one reducing the iron back to FeII. The mechanism proposed by Shaik and co-workers features a quantum mechanical hybrid state SQ•-FeII-O2•/FeIII-O2• (their species 5A2) that is stabilized by a hydrogen bond between H200 and the superoxo as the reactive intermediate.
The analysis of the experimental data for H200N-HPCAInt1 that might reveal the nature of its reactivity was hampered by its rather short lifetime (t1/2 = 0.4 s at 4 °C).24 Rapid freeze quenching of this species yielded nonuniform samples of low concentration. To improve the sample quality, we describe here the use of the cysteine variant, H200C, of HPCD. This variant yields the correct ring-cleaved product and is found to have an intermediate, H200C-HPCAInt1 (for short Int1) that is spectroscopically similar to H200N-HPCAInt1 but with a 225-fold increase in lifetime (t1/2 = 1.5 min) (H200C-HPCAInt1 is the spin coupled high-spin semiquinone-FeIII-(hydro)peroxo complex of H200C). This remarkable stability allowed the preparation of samples containing a 10-fold higher concentration of the intermediate without the problems of heterogeneity commonly encountered when using rapid freeze quench techniques. Like H200N-HPCAInt1, Int1 is found to have an FeIII site that is antiferromagnetically coupled to a substrate semiquinone radical to yield an S = 2 multiplet. A complete analysis of the Mössbauer and electron paramagnetic resonance (EPR) spectra of this sample is presented along with density functional theory (DFT) computations calibrated by the observed spectra and based on the high resolution X-ray crystal structure of the variant. We discuss in some detail the constraints on 17O magnetic hyperfine studies imposed by the uniaxial properties of the MS = ± 2 non-Kramers doublet. These experimental, structural, and computational results strongly support a structure for Int1 that has previously not been reported for a metalloenzyme. These studies offer new insight into the mechanism of formation and stepwise activation of an FeIII-hydroperoxo species capable of oxidative aromatic ring cleavage.
Experimental and Computational Methods
Sample Preparation
Reagents. Biochemicals and chemicals were purchased from Sigma-Aldrich or Fisher Scientific and 57Fe metal (96.8 % enriched) and 17O2 gas (70% enriched) were obtained from Cambridge Isotopes (MA).
Production of H200C HPCD (H200C) Expression Plasmid
The H200C expression plasmid was produced via site-directed mutagenesis from a plasmid containing the Brevibacterium fuscum 2,3-homoprotocatechuate dioxygenase hpcd gene in pTrc99a as previously described.14,47 The H200C mutation was verified by gene DNA sequence analysis (University of Minnesota Genomics Center) using the oligonucleotide primer 5'-GCACATGCGCTACGACCTGTACTC-3'.
Overexpression and Purification of H200C
H200C was overexpressed in Escherichia coli BL21 (DE3) and purified using methods previously described. 14,47 57Fe H200C was purified from cells grown in media containing 24 g/L casamino acids, 8 g/L yeast extract, 9.4 g∕L K2HPO4, and 2.2 g∕L KH2HPO4, 85 mM NaCl, and 0.5% glycerol, supplemented with 50 mg/L carbenicillin, 1 mM Mg, and 0.1 mM Ca. Iron was added as 57Fe metal (100 mg) dissolved in 3 M sulfuric acid and diluted with water to <0.5 M before stepwise addition into a 10 L culture. HPCD and H200C usually had a small fraction of the active site iron in the FeIII state after purification. The FeIII was reduced to the active FeII state and iron was quantified as previously described.22
Oxygen Generating System
Millimolar concentrations of dissolved oxygen were produced using Dechloromonas aromatica strain RCB chlorite dismutase (Cld) (generous gift of Prof. Jennifer Dubois, Montana State University, Bozeman, MT) and sodium chlorite.48 Cld (30 μM) was added to the H200C solution and sodium chlorite was added to the O2-saturated (4 °C) buffer solution to provide a total of 1.2 equiv of O2 over enzyme.
Preparation of EPR Samples
The intermediate was produced during reaction of preformed 2.3 mM H200C - 2.8 mM HPCA (1.22 equiv), Cld (28 μM) with sodium chlorite (9 mM) in a Reacti-vial with rapid stirring at 4 °C. The buffer was 200 mM MOPS, pH 7.5. An aliquot of the reaction mixture was transferred to an EPR tube, aged to 31 s and frozen in a methanol-dry ice bath.
EPR samples of the intermediate using 17O2, or 16O2 for direct comparison, were produced in a similar manner. Preformed 2.19 mM H200C- 2 mM HPCA was reacted with an equal volume of either 17O2 (70 %, Cambridge Isotope Laboratories, Tewkesbury, MA) or 16O2 saturated (1800 μM) buffer solution in a Reacti-vial with rapid stirring at 4 °C. A reaction aliquot was transferred into an EPR tube, aged and frozen in a methanol-dry ice mix.
Preparation of Mössbauer Samples
The Mössbauer sample of resting H200C (4.18 mM) was made using fully reduced enzyme as described above. The sample of the enzyme-substrate complex, H200C-HPCA was produced by adding 1.2 equiv of HPCA (5.02 mM) anaerobically to the fully reduced enzyme (4.18 mM). Mössbauer samples were prepared in 200 mM MOPS, pH 7.5.
The H200C-HPCAInt1 Mössbauer sample was produced by addition of sodium chlorite (9.5 mM) dissolved in O2-saturated 200 mM MOPS, pH 7.5, 4 °C to H200C (4.2 mM), HPCA (5.57 mM), and Cld (30 μM) in the same buffer. The reaction was performed in a Reacti-vial with rapid stirring at 4 °C. An aliquot was transferred to a Mössbauer cup which was frozen at 34 s in liquid nitrogen.
Steady-State Kinetics
Steady state kinetic parameters were measured by monitoring ring-cleaved product formation at 380 nm (cm−1) during the reaction of H200C HPCD (16 μM) with HPCA (0.019 mM to 4.86 mM) in 50 mM MOPS, pH 7.5 at 4 °C using a stopped-flow spectrophotometer (Applied Photophysics, Leatherhead, U.K.). The experiment was performed under aerobic conditions, using air-saturated buffer (4 °C, ~ 400 μM O2).
Presteady State Kinetics and Spectroscopy
The formation and decay of the intermediate were monitored by mixing preformed anaerobic H200C-HPCA with oxygen-saturated buffer (4 °C, ~ 1.8 mM) using a stopped-flow spectrophotometer using either photodiode array detection or photomultiplier detection at 610 nm in 50 mM MOPS, pH 7.5 at 4 °C. The reaction conditions are described in the figure legends. The time courses were fit using nonlinear regression (Applied Photophysics Pro-Data Viewer version 4.0.17) to a summed exponential expression as previously described.12
EPR Spectroscopy
X-band EPR spectra were recorded on a Bruker ELEXSYS-II E500 spectrometer equipped with an Oxford ESR910 cryostat for low temperature measurements and a bimodal cavity (Bruker ER4116DM) for generation of microwave fields parallel and perpendicular to the static field. All experimental data were collected under nonsaturating microwave conditions. The microwave frequency was calibrated with a frequency counter, and the magnetic field was calibrated with an NMR Gaussmeter. The temperature was calibrated with resistors (CGR-1-1,000) from LakeShore. A modulation frequency of 100 kHz and amplitude 1 mT pp was used for all spectra unless otherwise noted. SpinCount, a Windows software package (available from www.chem.cmu.edu/groups/hendrich/facilities/index.html), was used to analyze and simulate the spectra. Spin quantification was determined from double integration, relative to a CuEDTA standard for which the copper concentration was accurately determined from plasma emission spectroscopy.
Mössbauer Spectroscopy
Mössbauer spectra were recorded using Janis Research Super-Varitemp dewars that allowed studies in applied magnetic fields up to 8.0 T. Mössbauer spectral simulations were performed using the WMOSS software package (SEE Co). Isomer shifts are quoted relative to Fe metal at 298 K.
Computational Methods
The DFT calculations presented in Tables S2-S6 were performed using Gaussian '09 B.01.49 Unless otherwise noted, calculations were performed using Becke's three-parameter hybrid functional (B3LYP) and basis set 6-311G. 57Fe Mössbauer isomer shifts, δ, were calculated from the DFT charge density at the iron nucleus using the calibration from Vrajmasu et al.50
Results and Discussion
Kinetic Profile of H200C
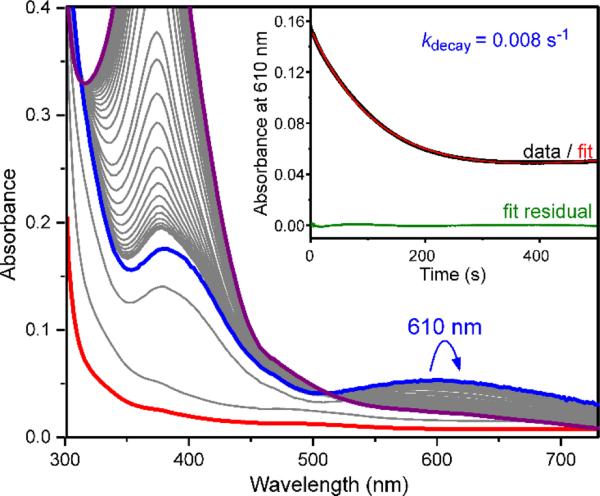
An HPCA substrate titration measuring the initial velocity of the H200C-catalyzed product formation (pH 7.5, 4 °C, 380 nm) provided the following steady-state parameters: kcat = 0.007 ± 0.002 s−1 (WT HPCD kcat = 3.2 s−1) 13 and KM = 18 ± 4 μM (WT HPCD KM = 25 μM, 22 °C).13 Rapid mixing of the preformed H200C-HPCA complex (Figure 1, red curve) with O2 under pseudo-first order conditions, revealed the appearance of an intermediate (Int1) with absorption features at 390 and 610 nm within the dead time of the stopped-flow instrument (0.8 ms) (Figure 1, blue curve). The wavelength maxima and intensity of the optical spectrum suggest that it arises from a quinone or semiquinone radical state of the bound substrate.24 Int1 decayed with an apparent rate constant of 0.008 s−1 at 4° C, showing that this is the slow step in the catalytic cycle leading to the observed steady state value of kcat for the overall reaction. This observation suggests that the rate-limiting step is shifted from product release to oxygen activation in this variant. The exceptionally long lifetime of Int1 allowed it to be trapped in high yield for spectroscopic investigation.
Figure 1.
Long-lived Int1 intermediate formed during the H200C-HPCA reaction with O2 monitored by stopped-flow spectroscopy. H200C-HPCA (440 μM) was mixed with O2 gas-saturated buffer (1.8 mM) in 200 mM MOPS, pH 7.5 at 4 °C. Spectra were recorded between 1.26 ms and 100 s with pathlengths of 2 mm. Spectra in bold are as follows: H200C-HPCA complex, red; Int1, blue; final ring-opened product species, purple. Inset: Reduced H200C HPCD (400 μM)-HPCA (200 μM) was mixed with O2 gas-saturated buffer (1.8 mM) in 200 mM MOPS, pH 7.5 and monitored at 610 nm using a path length of 10 mm at 4 °C. Enzyme without substrate bound does not react with O2.
X-ray Crystal Structure of H200C Variant
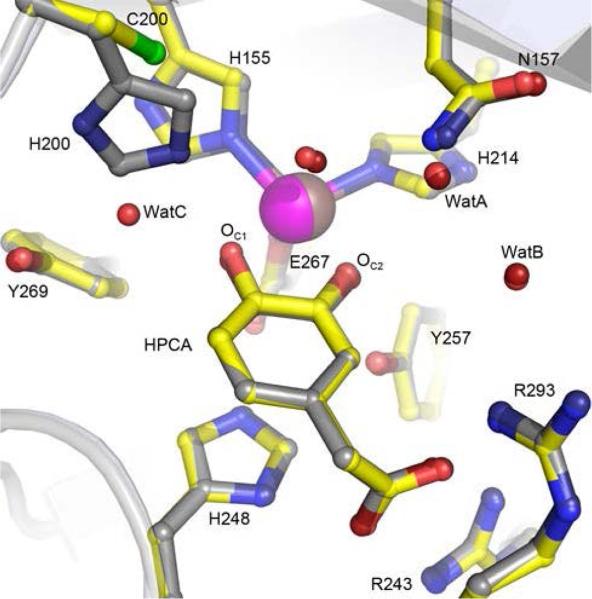
High-resolution X-ray crystal structures of the H200C variant in the resting state and in complex with HPCA were solved at 1.75 Å (PDB 5BWG) and 1.46 Å (PDB 5BWH), respectively (Table S1, Figures 2 and S1A-D). Comparison of the H200C and the WT HPCD structures shows that the H200C substitution does not elicit any change in protein structure globally or locally within the active site (Figure 2). Furthermore, H200C substitution also preserves the same distorted octahedral metal coordination geometry and binding mode of the substrate (Figure 2). Therefore, the observed changes in activity of the H200C variant can be attributed to the chemical and molecular (steric) properties of residue 200, and its effect on the interactions within the active site.
Figure 2.
Comparison of active sites of the WT HPCD and the H200C variant in complex with HPCA. Structure overlay of the WT HPCD (PDB 4GHG) and H200C (PDB 5BWH) structures. Atom color code: gray, carbon (HPCD); yellow, carbon (H200C); dark blue, nitrogen (HPCD); blue, nitrogen (H200C); dark red, oxygen (HPCD); red, oxygen (H200C); green, sulfur (H200C); bronze, iron (HPCD); purple, iron (H200C). Cartoons depict secondary structure elements for the H200C variant (gray) and HPCD (light blue). WatA-C represent crystallographically observed (not metal-coordinated) solvent in the active site.
One distinct feature in the active site of the H200C variant, in comparison to the WT enzyme, is the new solvent molecule (WatC) in the second coordination sphere (Figures 2 and S1), which is a likely consequence of the steric void created by the shorter side chain of Cys at position 200. Similarly positioned solvent was also observed in the H200N variant structures (e.g. Figure S1 D),39 where it is stabilized by hydrogen-bonding interactions with Y269 and the substrate-C1-hydroxyl moiety (Figure S1 C). Other crystallographically observed solvent molecules in the active site (e.g., WatA and WatB, Figure 2), present in all HPCD structures, are located 5 – 8 Å away from the substrate or O2 binding sites and thus appear to play structural rather than mechanistic roles. The steric void may have implications for the productive orientation, conformational mobility, and reactivity of the species in the O2-binding site. The high-resolution structure of the H200C-HPCA complex serves as a starting point for the DFT computations described below.
Mössbauer Characterization of H200C-HPCAInt1
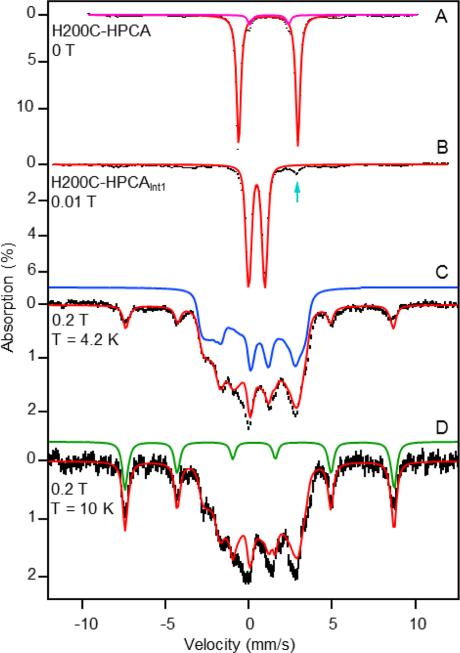
Figure 3A shows a zero-field, 4.2 K Mössbauer spectrum of the enzyme-substrate complex, H200C-HPCA. The spectrum exhibits a well-defined doublet having parameters typical of high-spin FeII, namely, quadrupole splitting ΔEQ = 3.55(2) mm/s and isomer shift δ = 1.14(1) mm/s. The spectrum also reveals a minority FeII species (6% of Fe, magenta line) with ΔEQ = 2.32(3) mm/s and δ = 1.20(2) mm/s. Figure 3B shows a spectrum of an H200C-HPCA sample frozen 34 s after incubation with O2. It should be noted that exposure to O2 leads to the complete disappearance of the ΔEQ = 3.55 mm/s H200C-HPCA complex, as well as the ΔEQ = 2.32 mm/s component, in favor of a new species with ΔEQ = 0.97(1) mm/s and δ = 0.48(1) mm/s (Int1).
Figure 3.
(A) Zero-field, 4.2 K Mössbauer spectrum (black) of H200C-HPCA (simulation, red curve) and the minority species with ΔEQ = 2.32 mm/s and δ = 1.20 mm/s (magenta curve). The spectra shown in panels A and B are raw data. Spectra shown in panels C and D were obtained by removing the high-spin ferric and high-spin ferrous impurities. (B, C) Spectra of the oxygenated intermediate, H200C-HPCAInt1 = Int1, recorded at 4.2 K in parallel applied magnetic fields as indicated. The arrow in (B) points at the high-energy line of a doublet attributed to resting enzyme. (D) B = 0.2 T spectrum recorded at 10 K. The spectra in (C) and (D) contain a 6-line pattern (green curve) associated with the excited MS = ±2 doublet of the S = 2 multiplet. The absorption of this feature increases with increasing temperature, showing that D > 0. The dominant contributions of the central feature, blue in (C), are from the MS = 0 state and MS = ± 1 doublet.
The isomer shift of Int1 is characteristic of high-spin (S1 = 5/2) FeIII, and as this species yields in zero applied magnetic field a quadrupole doublet rather than a spectrum exhibiting paramagnetic hyperfine structure, the FeIII must reside in a complex with integer (or zero) electronic spin.
The oxygen-exposed sample also contains a minority (6% of Fe) high-spin FeII species with parameters essentially the same as those observed for resting H200C, namely ΔEQ = 3.25 mm/s and δ = 1.22 mm/s (we will report elsewhere detailed Mössbauer studies of H200C and H200C-HPCA). It is possible that this minority component is also present, but not resolved, in the H200C-HPCA complex of Figure 3A. If this doublet indeed represents the resting enzyme, it should be present (as it is) in the spectrum of Figure 3B too, because the resting enzyme does not react with oxygen. The sample of Figure 3B also contains, although barely discernible, a monomeric high-spin FeIII contaminant (ca. 8%, broad features near +5 mm/s and −4 mm/s); we can simulate the spectra of this species reasonably well and have subtracted its contribution from the raw data of Figures 3C, D and 4 (see Figures S2, S3 and Figure S4 for simulated spectra of the high-spin ferric contaminant along with parameters listed in the figure caption).
Figure 4.
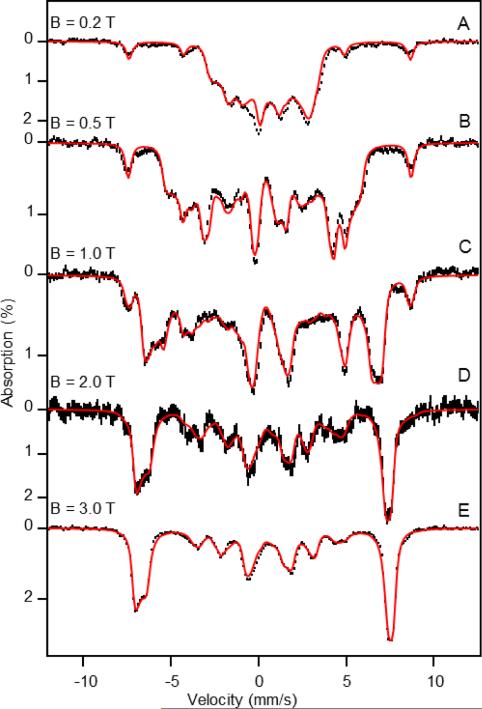
4.2 K Mössbauer spectra of Int1 recorded in variable, parallel applied magnetic fields of (A) 0.2 T, (B) 0.5 T, (C) 1.0 T, (D) 2.0 T, and (E) 3.0 T. The black hash-mark curves are the spectra that result after subtraction of simulations for the minority FeII (6%) and FeIII (8%) contaminants from the raw data. The FeIII contaminant was simulated with parameters given in the caption of Figure S4. Red lines are spin Hamiltonian simulations using the parameters listed in Table 1.
The properties of the applied field spectra of Figures 3 and 4 suggested to us that Int1 should yield a parallel mode X-band EPR signal. Indeed, Int1 exhibits a sharp feature (Figure 5 below) with a peak at g = 8.04 (where g is defined by g = hν/βB). Such a feature typically results from the MS = ±2 doublet of an S = 2 multiplet for which g ≈ 2gzS. These observations suggest that the iron center of Int1 is a system for which the high-spin (S1 = 5/2) FeIII is exchange coupled to a radical (SR = 1/2). We describe the data by the Hamiltonian of eq 1.
| (1) |
where describes the hyperfine interactions of the 57Fe nucleus,
| (2) |
In eq 1, D1 and E1 are the axial and rhombic zero-field splitting (ZFS) parameters of the FeIII ion, and g1 and gR are the g-tensors of the FeIII and the radical, respectively. For the present type of ligand coordination, namely high-spin FeIII with nitrogen and oxygen ligands, |D1| is typically ≈ 1 cm−1 (below we find D1 = +1.2 cm−1). It is reasonable to assume that g1 and gR are isotropic and that g1 ≈ gR ≈ 2.00. The 57Fe magnetic hyperfine tensor of high-spin FeIII, a1, is generally isotropic to within a few percent. The electric quadrupole interaction, the second term in eq 2, is written in the principal axis frame (x′,y′,z′) of the electric field gradient (EFG) tensor. Mössbauer spectroscopists generally choose (x′,y′,z′) such that |Vz′z′| ≥ |Vy′y’| ≥ |Vx′x′|. This choice confines the asymmetry parameter, η = (Vx′x′ – Vy′y′)/Vz′z′, to the range 0 ≤ η ≤ 1. The Euler angles α, β, and γ relate the principal axis frames of the EFG and ZFS tensors; the polar angles α and β position z′ in (x,y,z) and γ rotates the EFG around z′. These angles are called (αβγ)EFG in the WMOSS software.
Figure 5.
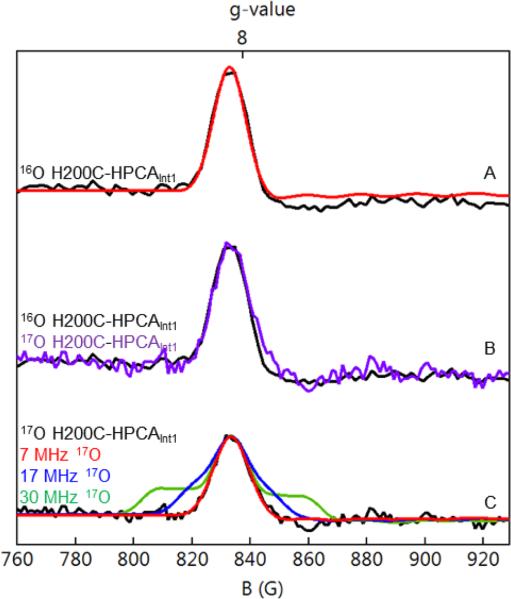
Parallel mode X-band EPR spectra of H200C-HPCAInt1 recorded at 21 K. (A) 16O Int1, black curve. The red curve is an S = 2 SpinCount simulation based on eq 3 using D = +1.6 cm−1, E/D = 0.055, gz = 2.01, σ(E/D) = 0.005 and 0.57 mT packet line width. (B) Comparison of spectra of the 16O sample of (A) (black) with a sample of Int1 enriched with ~ 70% 17O2 (purple curve). The purple curve has been scaled to match the peak amplitude of the g = 8.04 feature of the 16O sample. (C) Experimental spectrum of the 17O2 enriched sample (black) with simulations for Aeff (17O) = 7 MHz (red), 17 MHz (blue), and 30 MHz (green). Conditions: 9.37 GHz frequency, 20 mW nonsaturating microwave power, 1 mT modulation, T = 21 K.
For Int1 we found (see below) that the exchange coupling constant, J, is positive (antiferromagnetic coupling) and large (> 40 cm−1) compared to the ZFS of the ferric ion, J >> D1. Under these conditions it is useful to treat the system as an isolated S = 2 ground multiplet and to describe it in the coupled representation using eq 3.
| (3) |
The quantities of eq 3 are related to those of the uncoupled representation of eq 1 by D = (4/3) D1, (E/D) = (E/D)1, and g = (7/6)g1 - (1/6)gR (throughout this section, we take gx = gy = 2.0; below we find that gz = 2.01). For the hyperfine interactions of the S = 2 multiplet, we can use equation 2 by replacing Ŝ1 · a1 · Î by Ŝ · A1 · Î; the expression A1 = (7/6) a1 relates the a1-tensor of the local FeIII site to the A1-tensor of the coupled system, A1.
The red lines in Figures 3C, D and 4 A-E are spectral simulations based on eqs 1 and 2 using the parameters listed in Table 1. The spectra shown in Figures 3 and 4 are superpositions of five subspectra, one for each sublevel of the S = 2 multiplet. In Supporting Information we describe in detail how all the parameters of Table 1 can be isolated and determined once the origins of individual absorption lines in each spectrum are recognized under conditions of variable field and variable temperature. Of particular interest for the development of the following sections is the sharp 6-line spectrum (green) of Figure 3D, which is associated with the excited MS = ±2 non-Kramers doublet (energy levels shown in Figure S5). This doublet yields the g = 8.04 EPR feature discussed in the next section. The uniaxial properties of this doublet40 imply that only the effective z component (in the ZFS frame) of the 17O magnetic hyperfine interactions is observable in parallel mode EPR at X-band. We elaborate on this point in the EPR and DFT sections.
Table 1.
Spin Hamiltonian Parameters, Equation 1, of FeIII Species in H200C and Intermediates of H200Na
| Intermediate | D1 (cm−1) | (E/D)1 | J (cm−1) | ΔEq (mm/s) | η | a1[x,y,z] (T) | δ (mm/s) | Ref. |
|---|---|---|---|---|---|---|---|---|
| H200C-HPCAInt1 HPCA•-FeIII-OO(H) |
+ 1.2(2) | 0.05(3) | > +40 | −0.97(1)d | 0.55 | −21.0(2) −21.5(2) −21.6(1) |
0.48(1) | This work |
| H200N-HPCAInt1 HPCA•-FeIII-OO(H) |
+ 1.1 | 0.12 | +25(5) | −0.95b | 0b | −21.5 −21.5 −21.5 |
0.48 | 24 |
| H200N-4NCInt2 4NC•-FeIII-OO(H) |
+0.67 | 0.11 | +40(10) | −0.87 | 0.8 | −21.5 −21.5 −21.5 |
0.49 | 22 |
| H200N-4NCInt1 4NC-FeIII-O2• |
−0.59 | 0.20 | +6(2) | −0.33 | −3 | −21.4 −21.4 −21.4 |
0.50 | 22 |
| H200C-HPCAInt1 (S=2 representation) |
+1.6c | 0.05(3) | - | −0.97 | 0 | −24.5 −25.1 −25.2c |
0.48 | This work |
Spectra of the H200N-4NCInt1, the spin coupled high-spin FeIII-superoxo complex of H200N; H200N-4NCInt2, the spin coupled high-spin semiquinone-FeIII-peroxo complex of H200N.
Spectra of the H200N-HPCAInt1 were of much lower quality; η and the quoted angles (α = γ = 0, β = 90°) are rather approximate.
The quantities quoted are D = (4/3)D1, (E/D)= (E/D)1 and A1 = (7/6)a1.
The EFG is rotated by Euler angles α = 58°, β = 70°, γ = 50° relative to the ZFS tensor; see text.
EPR Studies of Int1
Next we turn to the parallel-mode EPR spectra of H200C-HPCAInt1, which reveal a fairly sharp (1.4 mT width) feature at g = 8.04. An expanded view of a spectrum recorded at 21 K is shown in Figure 5A. We have recorded spectra under nonsaturating conditions (20 mW) between 10 and 60 K; a set of nine spectra were collected and wider scans are shown in Figure S6. The g = 8.04 feature originates from the excited MS = ± 2 doublet at energy ε = 4D ≈ 6.4 cm−1 above the MS = 0 ground state. At temperatures above 60 K, the g = 8.04 feature broadened and became difficult to analyze; below 10 K, the signal amplitude declined sharply due to depopulation of the MS = ± 2 doublet.
The red solid line in Figure 5A is a SpinCount simulation generated using the parameters listed in the figure caption. The peak of the resonance is positioned at g = 8.04 rather than g = 8.00. From the resonance condition hν = {(4gzβB)2 + Δ±22}1/2 we infer that the shift of the resonance from g = 8.00 to g = 8.04 is mainly due to gz (= 2.01 in eq 3); Δ±2 = 0.014 cm−1, the splitting of the MS = ±2 doublet for B = 0, shifts the resonance by a mere 0.006. The intensity of the resonance is proportional to (E/D)4 and, since we know the concentration of Int1, we can use this relationship as a sensitive measure of E/D, yielding E/D = 0.055 in good agreement with the 0.03 < E/D < 0.08 obtained from the Mössbauer analysis.41
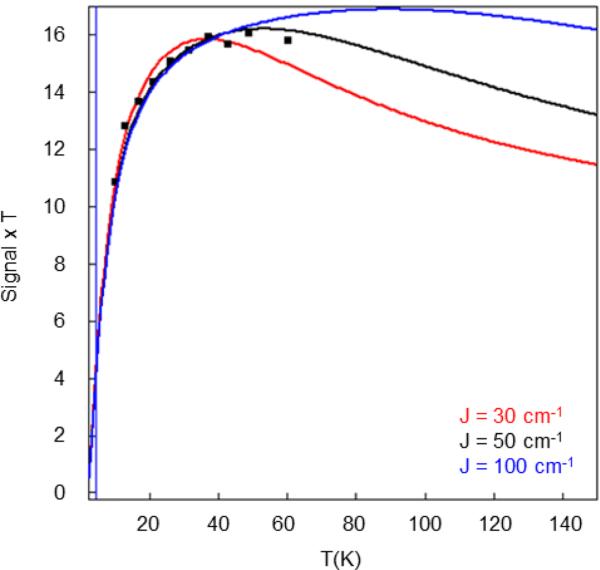
Using the SpinCount software we have analyzed and simulated the set of nine spectra, using eq 1. Figure 6 shows a plot of signal × T versus T for the g = 8.04 resonance, where signal × T is proportional to the population of the MS = ± 2 doublet. The solid lines in Figure 6 are calculations for different values of J; the rise of the curve depends mainly on the zero-field splitting parameter D1 and is well represented by choosing D1 = +1.2 cm−1, in good agreement with the Mössbauer results. The data of Figure 6 indicate that between 15 K and 30 K the calculated population of the MS = ± 2 levels is too large if J = 30 cm−1; we estimate that the exchange coupling constant must be larger than about 40 cm−1.
Figure 6.
(Signal × T) vs T plot of Int1 obtained from analysis of the variable temperature parallel mode EPR signal at g = 8.04 shown in Figure S6.
The g = 8.04 signal of Int1 is three times narrower than the g = 8.20 feature of the (HPCA•)FeIII-OOH complex H200N-HPCAInt1, suggesting that we can probe the state of the dioxygen in Int1 by using 17O enriched O2. The uniaxial magnetic properties of the MS = ± 2 doublet imply that only the effective components along z are observable.40,42 For Int1 there are four oxygens that are potential targets for 17O EPR studies, namely, OC1, OC2 of the coordinated substrate and the two oxygens of the added O2 (via the 17O2 enriched gas used here).
For describing 17O hyperfine interactions we add a term Ŝ · A(17O) · ÎO to eq 3 for each enriched O, where ÎO is the spin operator of the 17O nucleus (IO = 5/2). In the limit βB << D mixing with MS = 0 and ±1 states can be neglected and only terms containing Ŝz are relevant.40 Replacing Ŝz by its expectation value <Ŝz> = ± 2, we obtain for each of the two electronic spin levels a nuclear Hamiltonian:
| (4) |
where the Aiz are elements of the 17O hyperfine tensor in the (x,y,z) frame. Eq 4 yields for the splitting of the MS = +2 and MS = −2 levels43
| (5) |
In an EPR experiment tuned to the g = 8.04 resonance, one measures the quantity Aeff. In S = 2 SpinCount simulations one can pretend that A(17O) is diagonal in (x,y,z) and use . In the DFT section, we give expressions for the 17O hyperfine tensor for the cases where the oxygen is either a diamagnetic ligand of iron (covalent delocalization for a hydroperoxo ligand) or a ligand with radical character (radical contribution plus covalent delocalization as would apply for the oxygens OC1 and OC2 ). Using the A(17O) calculated by DFT in combination with information about the orientation of the unique axis, z, as determined by Mössbauer spectroscopy, we evaluate (in Figure 10, below) the Aeff-value of eq 5.
Figure 10.
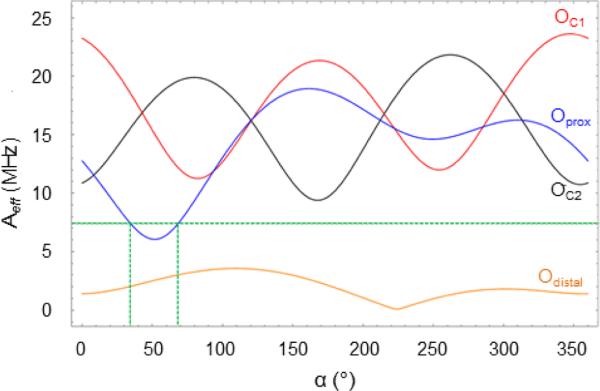
Aeff vs α calculated for OC1 and OC2 of the HPCA substrate, and Oproximal and proton carrying Odistal of the hydroperoxo ligand. The green dashed line indicates the experimentally determined upper limit for Aeff for the hydroperoxo oxygens. The plot was prepared using β = 70°. The DFT-calculated principal components of A(17Oproximal) are [−5.8, −16.2, −21.0] MHz. Angles α and β position z’ of the EFG in the x,y,z frame of the ZFS tensor. Figure S8 shows the direction of the unique axis relative to the DFT structure.
Figure 5B shows parallel mode X-band EPR spectra of Int1 recorded at 21 K for samples prepared using 16O2 (black) and 70% enriched 17O2 (purple). Within the noise, both resonances have the same line width (the shoulder on the high field side of the 17O spectrum is probably noise from the background as there is no corresponding feature on the low field slope of the line). Figure 5C shows the resonance of the 17O enriched sample together with three SpinCount simulations generated using the parameters of Figure 5A and adding the AeffŜzÎz,O term in the S = 2 Hamiltonian of eq 3. The green line assumes an obviously too large Aeff(17O) = 30 MHz (the value observed for the superoxo species of H200N-4NCInt1),22 the blue line assumes an again too large Aeff(17O) = 17 MHz (the value found for H200N-HPCAInt1),24 and the red line shows a simulation for Aeff(17O) = 7 MHz which can be taken as an upper limit for Aeff(17O) of Int1.
The lack of discernible 17O hyperfine broadening seems like a disappointing result. However, as it is shown below, this result is compatible with the combined DFT/Mössbauer analysis of Int1 that indicates the unique axis is closely aligned with the direction in which the orientation-dependent Aeff has a minimum.
Table 1 shows that the spin Hamiltonian parameters of H200C-HPCAInt1 are very similar to those of the HPCA•-FeIII-OOH complex, H200N-HPCAInt1. For the latter we observed Aeff (17O) = 17 MHz for the proximal oxygen of the hydroperoxo ligand. The same 17O splitting was observed when the OC2 was enriched with 17O.24 The finding that Aeff(17O) ≤ 7 MHz in H200C-HPCAInt1 does not rule out Int1 as an HPCA•-FeIII-OOH complex. In fact, such an assignment is suggested by our DFT and 17O hyperfine analysis presented below. This assignment is also consistent with the optical spectrum of Figure 1, which is indicative of a quinone or semiquinone substrate.24 Since the Mössbauer data show that the iron is ferric in Int1, the added dioxygen must be a peroxo.
The reader may wonder whether our result argues against an FeIII-superoxo• complex given that we observed Aeff(17O) = 30 MHz for H200N-4NCInt1 (Mbughuni et al.22 described the data in the uncoupled representation of eq 1, reporting aeff(17O) = 180 MHz). Since 17O magnetic hyperfine interactions of superoxo species are highly anisotropic, our 17O result does not rule out an FeIII-superoxo• complex because the unique axis of the ZFS tensor could be along a small component of A(17O). We address this point in sections 4.3 and 4.7 of Supporting Information. The DFT calculations presented below suggest that a (HPCA)-FeIII-(superoxo) complex would exhibit strong ferromagnetic coupling, contrary to the S = 2 state found for H200N-4NCInt1.
DFT Analysis of Int1
The spectroscopic analyses of Int1 have provided 57Fe fine structure and hyperfine structure parameters, a lower bound for J (antiferromagnetic, J > 40 cm−1), and an upper bound for Aeff(17O). Guided by the above experimental results and the X-ray structure of the H200C-HPCA enzyme–substrate complex, DFT calculations were performed to assign Int1 as one of the plausible structural candidates shown in Figure 7, which vary in terms of axial ligation, protonation, and hydrogen bonding.
Figure 7.
Structural candidates for FeIII complex Int1.
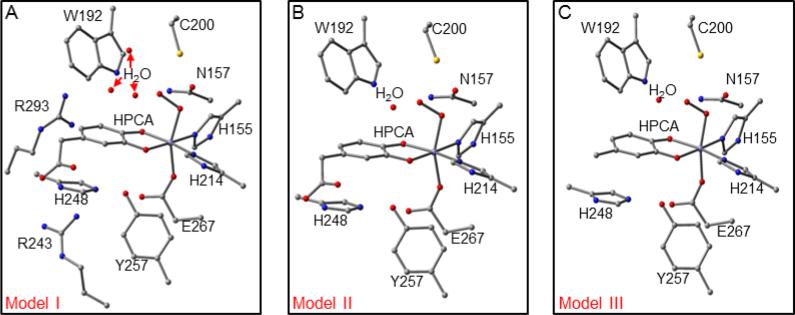
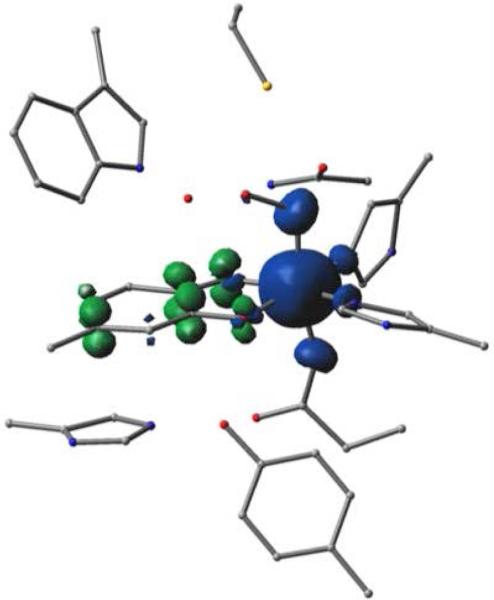
We have considered the spin states S = 2 and 3 for three models of varying size (Figure 8), obtaining an FeIII-radical solution in each case. The models differ in the number of remote second-sphere residues included in the calculations and in modifications of the acetic acid side chain of the substrate, as described in the figure caption. Model III was designed to prevent migration of the radical to Arg243 (as it occurred in Model I calculations) or to the oxygens of the carboxylate tail (as it occurred in Model II). These migrations presumably occur because other protein residues that interact with these moieties were not included due to constraints on the size of the model that can be examined computationally. Model III prevents migration by replacing the acetic acid tail group of HPCA by a methyl group. A detailed analysis is presented in section 4 of the Supporting Information, and only the principal results are listed here: (i) the iron is high-spin FeIII and coordinated to a hydroperoxo ligand, (ii) the hydroperoxo proton is attached to the oxygen distal to Fe, (iii) the substrate is in a radical state with its SR = 1/2 spin antiferromagnetically coupled to the S1 = 5/2 spin of the FeIII, (iv) both the coordinating oxygen atoms, OC1 and OC2, of the substrate are deprotonated, (v) while the conformation with dihedral angle ∠HOOFe = 140° (rightmost conformation in Figure 7, labeled OOH, spin density plot shown in Figure 9) emerges from the analysis as the most likely conformation for Int1, the other two conformations for a peroxo adduct shown in Figure 7, cannot be ruled out, and (vi) O2 binding to the enzyme substrate complex yields an FeIII-superoxo complex.
Figure 8.
DFT models for Int1. Panel (A) shows Model I, and includes second- and third-sphere residues Y257, H248, N157, C200, W192, R243, R293, and three crystallographic waters (WatA-C) adjacent to the active site (PDB 5BWH). Panel (B) shows Model II for Int1; the residues R243, R293, and two of the crystallographic waters (WatA and WatB) have been removed. Panel (C) shows Model III in which the substrate acetic acid side chain has been truncated and is replaced by a methyl group. Hydrogen atoms have been omitted for clarity.
Figure 9.
Spin density plot for the OOH conformation (Figure 7, right) of Model III. Regions of blue correspond to spin-up density, and regions of green correspond to spin-down density. Note that OC1 and OC2 (in the foreground) display both spin-up and spin-down densities. Hydrogens are not shown for clarity.
The calculated J, ΔEQ and η values allowed us to narrow the choice for a viable model for Int1, namely the conformer OOH (proton on the distal O) listed in row 3 of Tables S3 and S4. The experimental data exclude ferromagnetic coupling and thus rule out models for which OC1 is protonated (see Table S3). The high energy and the calculated δ values argue against a hydroperoxo species in which the proximal O is protonated (Table S5). Table S4 lists the quadrupole splitting parameters (ΔEQ, η) as quoted in the “proper” frame for which |Vx′x′| ≤ |Vy′y′| ≤ |Vz′z′| such that 0 ≤ η ≤ 1. It is noteworthy that all calculated EFG tensors have a large negative component along the OE267-Fe-Oproximal direction. In the deprotonated variant of Model III (ΔEQ < 0, see Table S4) this direction is aligned with the largest principal component of the EFG, eQVz′z′. For the selected OOH conformers of the three models Aeff(17O) was obtained from DFT for the two hydroperoxo oxygens, which were 17O enriched in the experiment of Figure 5, using the treatment of section 4.7 of Supporting Information. For future studies the calculated Aeff(17O) values for the coordinating OC1 and OC2 of the substrate radical have been evaluated as well. (In an exchange coupled system with the radical on the substrate, the coupling of the 17O nuclei of OC1 and OC2 to the electronic radical spin SR gives for the coupled S = 2 system spin a projection factor of −1/6 that differs from the factor +7/6 for the 17O coupling of the oxygens of the hydroperoxo ligand to the iron spin S1. To describe the general situation we have used an expression for Aeff that includes terms for the couplings of the 17O nuclei with the electronic spins of both the metal and the radical (cf. section 4.7 of the Supporting Information).
The A(17O) tensors from DFT, ADFT(17O), were expressed in the principal axis frame (x′y′z′) of the EFG tensor for Models I, II and III using row 3 of Table S4. Using the relation between the principal axes frames of the EFG and ZFS tensors obtained from Mössbauer (α = 58°, β = 70° in footnote c of Table 1), the Cartesian components of ADFT(17O) were first expressed in the ZFS frame (xyz) frame and then used to determine the splitting constant Aeff with eq 5. It proved to be quite instructive to fix β at 70° and plot the calculated Aeff along the azimuth α.
Figure 10 shows plots of Aeff(17O) vs α for Oproximal and Odistal of the hydroperoxo ligand and for OC1 and OC2 of the HPCA ligand as obtained for the OOH conformation of Model III. There is a narrow range of α values, namely α ≈ 35° - 65°, for which Aeff of Oproximal assumes values that are compatible with our experimental data, namely Aeff ≤ 7 MHz, and interestingly the Mössbauer result α ≈ 58° falls into this range. The calculated Aeff vs α plots for OC1 and OC2 are quite similar, apart from a displacement of Δα ≈ 90° due to the OC1-Fe-OC2 angle of about 90°. Figure 10 shows that for α ≈ 120° the |Aeff| values for both Oproximal and OC1 are equal to ~17 MHz, values observed for these sites in H200N-HPCAInt1.24 Aeff < 4 MHz for Odistal would be too small to cause measurable broadening of the g = 8.04 resonance for any α. The magnitudes of Aeff for Models I and II are quite similar to that obtained for Model III, except that the minima for Oproximal occur near α = 20° (see Figure S7). Interestingly, for Models I and II the Aeff values of OC1 and OC2 are comparable to those of Model I, indicating that the major contribution to Aeff comes from covalent delocalization described by the Ŝ1 · a1 · ÎO term; see comments in section 4.7 of Supporting Information.
Mechanistic Considerations
The HPCA substrate binds the FeII center of H200C as a dianion that is protonated at OC1 and deprotonated at OC2 and the carboxylate. Our DFT calculations presented in section 4.6 of Supporting Information suggest that the enzyme substrate (ES) complex is converted to an FeIII–superoxo complex upon binding molecular oxygen. The putative superoxo complex, apparently too short-lived to be detected on the millisecond time scale, would be the precursor to Int1, which is proposed here to be a hydroperoxo species in which the HPCA is coordinated to the iron in the fully deprotonated radical form. Making the reasonable assumption that the substrate retains the OC1-proton in the formation of the superoxo species, the transformation from the superoxo species to Int1 can be described as the transfer of a proton and an electron from the substrate to the superoxo ligand (proton-coupled electron transfer, PCET).
Although it cannot be ruled out that the deprotonation of the substrate and protonation of the superoxo ligand involve different protons, the present analysis will focus on the PCET process between the substrate and superoxo moiety. We limit the present discussion to a model in which the second sphere residues Asn157 and Trp192 have been removed from Model III. The results of the DFT calculations are summarized in Figure 11.
Figure 11.
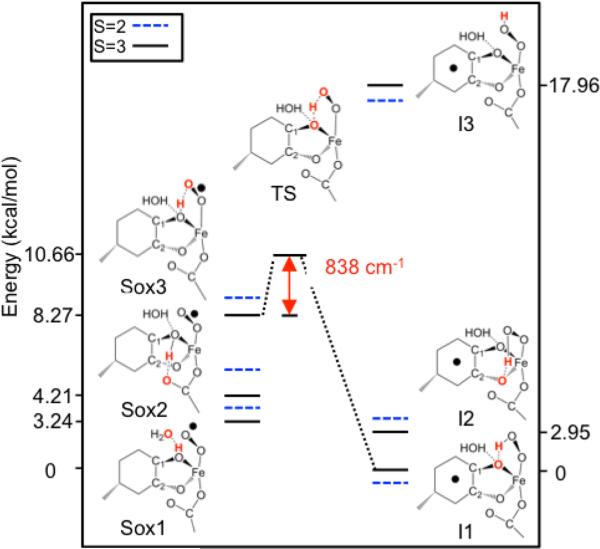
Diagram depicting the DFT-calculated transformation from a superoxo species to Int1 as described by transfer of a proton and an electron from the substrate to the superoxo ligand (proton-coupled electron transfer, PCET). The water molecule indicated is crystallographic WatC. Solid and dashed lines indicate the lowest spin septet and quintet states, respectively, for each conformation. Atoms highlighted in red are involved in hydrogen bonding interactions that affect the transfer. Energies on the left and right frame refer to the energies of the S = 3 states.
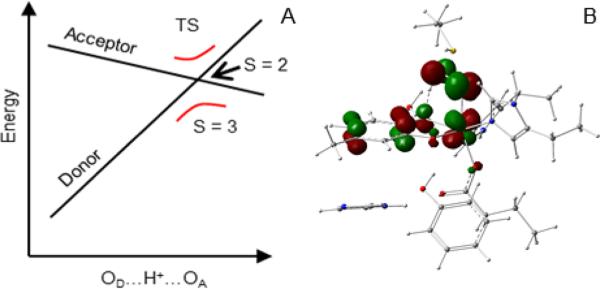
The figure shows the energies (solid lines) for the S = 3 state (ferromagnetically coupled iron–radical states) of the (H-Substrate)–FeIII–O2• complex (left) and the Substrate•–FeIII–OOH complex, in particular the OOH···O(1) conformer of Int1 (right). The process goes through a transition state (TS) that is located at an accessible energy of about 7.7 kcal/mol above the lowest superoxo conformation, Sox1. Also shown are energies (dashed) for the antiferromagnetic states (S = 2) obtained for the J values determined from broken-symmetry calculations. Just as for Int1, the superoxo species has three conformations distinguished by different hydrogen-bonding (HB) patterns. The OC1-H donates a HB to WatC in the ground conformation Sox1, and to the distal O of E267 in the next conformation Sox2 (distance H···OE267 is 1.7 Å; N.B. this HB does not disrupt the HB of OE267 to H248 in the computation. Steric constraints would be likely to prevent a HB between OC1-H and E267 in the actual enzyme active site) and to the distal O of superoxo in the highest energy conformation Sox3 (see Figure 11). Sox3 is of special interest as it places the OC1-proton in an ideal position for making the transfer to the superoxo and is highest in energy probably due to the elastic strain associated with the deformations required to bring the proton donor (OC1) and acceptor (distal O of superoxo) atoms together to form the hydrogen bond; we will refer to the atoms as OD and OA, where the subscripts D and A refer to donor and acceptor, respectively. A brief discussion of both the ET and PT aspects of the PCET process as well as their relationship follows. The TS for S = 3 was determined to be about 800 cm−1 (2.3 kcal/mol) above the initial state of the transfer (i.e., the Sox3 conformation) and has a structure in which OD-H > H-OA (see Table 2). In moving from OD to OA, the proton raises the energy of the redox active π-type donor orbital on the substrate and lowers the out-of-plane π*out acceptor orbital on the superoxo (see Figure 12A). This alteration leads to a level crossing and results in the transfer of an electron. In linear approximation, the proton coordinate at the crossing depends on the initial energy difference and on the difference in the slopes. The path of the transferring proton places it into the lobe of the donor π orbital and in the nodal plane of the π*out acceptor orbital, creating a configuration that favors coupling of the proton to an electron in the π lobe of the donor orbital.
Table 2.
Spin Population Analysis, Isomer Shift, and Distances for PCET between Substrate and Superoxo Ligands.
| State | Configuration | Substrate | Fe | O2 | Rest | Sum | δ (mm/s) | OD-Ha | H-OAa |
|---|---|---|---|---|---|---|---|---|---|
| Initial | H-Substrate FeIII O2• | 0.38 | 4.22 | 1.15 | 0.29 | 6 | 0.56 | 1.037 | 1.507 |
| TS | 0.61 | 4.18 | 0.96 | 0.26 | 6 | 0.58b | 1.273 | 1.163 | |
| Final | Substrate• FeIII OOH | 1.17 | 4.22 | 0.35 | 0.25 | 6 | 0.53 | 1.930 | 0.989 |
| β HOMO – 1 at TS | –0.59 | –0.22 | –0.12 | –0.07 | –1 | – | |||
In Å.
δ = 0.59 mm/s at cross 2 in Figure S9C.
Figure 12.
(A) Schematic depicting the crossing of the donor and acceptor levels. (B) Contour plot of the orbital of the transferring spin-down electron at the level crossing where the populations of this orbital at the donor and acceptor are equal.
A number of observations can be made from the Mulliken spin densities (SD) listed in Table 2. (1) The Mulliken spin population of iron at the TS is nearly equal to those of iron at the initial and final states of the process. The electron transfer process is thus best described as a direct transfer between the donor and acceptor that does not proceed sequentially as in the step-wise process donor → Fe → acceptor. (2) The 57Fe isomer shift (see Table 2) calculated at the TS is only marginally higher than at the terminal points (see Table 2), confirming that the iron remains in the ferric state during the transfer. (3) The transfer involves a net population of 1.15 – 0.35 ≈ 1.17 – 0.38 ≈ 0.8 electrons; the complementary 0.2 electrons remain on the iron throughout the process. (4) At the TS, 1.15 – 0.96 ≈ 0.61 – 0.38 ≈ 0.2 electrons have been transferred, with the major part of the charge, 0.8 – 0.2 = 0.6, still to go, showing that the electron transfer lags the proton transfer. (5) The same conclusion can be drawn from the distribution of the orbital containing the transferring β electron at the TS (spin-down-HOMO – 1, illustrated in Figure 12B) over the substrate donor, the iron intermediary, and the O2 acceptor (see also last row of Table 2). In general, the transition states of the ET and PT parts of a PCET process do not coincide. In the present case, the crossing of the donor and acceptor levels (Figure 12A), where the populations of these orbitals are about equal, occurs after the TS of the overall process, suggesting that the TS (level crossing) of the ET is located after the TS of the PT on the internal reaction coordinate (IRC). A detailed analysis of the correlation between the proton and electron transfer processes is given in Figure S9 of section 4.8 in Supporting Information. The contour plot of the transfer orbital at the TS of the ET (shown in Figure 12B) reveals a linear combination of the πz donor orbital of the substrate, the dxz iron orbital, and the π*x acceptor orbital of the superoxo. The plot nicely illustrates the role of the iron orbital in connecting the orthogonally oriented, and therefore poorly interacting, ligand components of the πz donor and π*x acceptor orbitals by forming bonding combinations with both these redox active ligand orbitals. The transfer process involving the mentioned spin-down orbital may be viewed as a wave packet for which the initial amplitude on the substrate declines with a concomitant amplitude increase at the superoxo, and a nearly constant amplitude at the iron.
An important factor in the electron-transfer process is the system spin. In the S = 3 state the donor and acceptor orbitals of the transferring spin-down electron delocalize into the vacant down-spin 3d orbitals of the FeIII ion such that these orbitals effectively overlap, resulting in a strong electronic coupling between the donor and acceptor orbitals and leading to an avoided crossing, as illustrated in Figure 12A. In the S = 2 state, however, where the transfer essentially involves a spin-up electron, the delocalization onto the metal is forbidden because the spin-up 3d orbitals are occupied, leading to a weaker electronic coupling (Figure 12A). The stronger coupling for S = 3 leads to a lower TS energy for the ET and a larger transmission coefficient than in the S = 2 case, both factors favoring a more efficient ET for S = 3. The spin-state effect described here stems from the spin dependence of the electronic matrix element connecting donor and acceptor. This differs from the proposed spin effects on the hydrogen atom abstraction by FeIV=O species, which originate from energy differences between the spin terms of the electron-accepting metal ion.44 Although the ferromagnetic coupling prevailing in the superoxo intermediates yields the ground state with the most reactive spin (S = 3), the spin state energetics play only a minor role in the PCET reaction considered here (Figure 11).
The studies described here allow us to draw several conclusions regarding the mechanism of the H200C variant. H200C-HPCA is active, yielding the correct ring-cleaved product, albeit with a kcat that is 400 times slower than that of WT-HPCD. Int1 is best described as a HPCA•-FeIII-(OOH)distal species, adding a new member to the growing family of FeIII intermediates in HPCD variants. The nearly complete accumulation and subsequent decay of Int1 toward product shows that this intermediate lies on the H200C catalytic pathway and is consumed in the rate-limiting step, perhaps by the distal-to-proximal proton transfer of Scheme 1, a step that would have to proceed unsupported by His200 (cf. below).
Scheme 1.

Proposed Oxygen Activation Pathway for the H200C-HPCD Variant That Involves Conversion of a Ferric Superoxo Intermediate to a Distal-Protonated Hydroperoxo, Semiquinone Radical Intermediate via Inner-Sphere PCET. a In the ES complex and superoxo intermediate the substrate is protonated at OC1 (red superscript H).
Our DFT calculations suggest that Int1 is formed from an S = 3 FeIII-superoxo intermediate by an inner-sphere PCET process. Although the precursor of Int1 has not been observed experimentally, FeIII-superoxo species fitting the description have been established for H200N-4NCInt122 and in the S = 3 synthetic complex [(O2)Fe(BDPP)]0 (BDPP=(2,6-bis(((S-2-(diphenylhydroxymethyl)-1-pyrrolidinyl)-methyl)pyridine)).45
The oxygen activation phase of H200C, depicted in Scheme 1, invokes a proximal-hydroperoxo species, HPCA•-FeIII-(OOH)prox, to attack the substrate radical at C2, and to ultimately form the consensus alkylperoxo intermediate. Reaction mechanisms for the WT enzyme can make use of the proton shuttling abilities of H200. Thus, the DFT studies of Neese37 and Shaik34 (see also Dong and Lai38) suggest PCET attacks on the substrate by FeIII-superoxo species. The studies of Lipscomb and co-workers16 consider fast temporary storage of the OC1 proton on the vicinal H200 which would generate an HPCA•-FeII-superoxo radical that rapidly recombines to form the alkylperoxo species, kinetically preventing formation of a hydroperoxo species.
Conclusion
The current study suggests that a distally protonated FeIII-hydroperoxo species can form in the active site of HPCD and that extradiol ring cleavage of HPCA occurs from this intermediate or one of its successors during the reaction cycle of H200C. This reaction occurs much more slowly than that of the oxy intermediate formed during the reaction of WT enzyme with HPCA, suggesting that H200 plays an important role in either catalyzing a reaction like that of H200C or promoting a different reaction that also leads to the alkylperoxo intermediate and results in ring cleavage. Slow extradiol cleavage chemistry or a reaction that yields a nonring cleaved product are characteristic of all of the intermediates we have identified using HPCD variants.14,22,24-26,46 These include the substrate quinone-FeII-(H)peroxo ring-cleaving intermediate formed by the Y257F variant25,26 and 4NC•-FeIII-superoxo intermediate of the H200N variant.22 The observation and characterization of these intermediates demonstrate the deep diversity of complexes that can be stabilized at nonheme iron centers in biology. However, it also demonstrates the exquisite control that the protein environment can exercise in directing and accelerating the specific chemistry required by the organism even when using a single type of metal center ligation.
Supplementary Material
ACKNOWLEDGMENTS
This work is supported by National Institutes of Health Grant GM024689 (to J.D.L.), by the National Science Foundation Grant CHE-1305111 (to E.M.), and by the Biological Sciences Research Council BB/H001905/1 (to E.G.K). We acknowledge support from the National Science Foundation via EPR instrumentation grant (NSF CHE-1126268) to Dr. Michael P. Hendrich. We acknowledge Soleil Synchrotron (beamline Proxima I, St Aubin, France) and Diamond Light Source (beamline I-03, Didcot, UK) for access to synchrotron radiation facilities.
Footnotes
The authors declare no competing financial interest.
Supporting Information. Figures S1-S9, Tables S1-S6; crystallographic information; Mössbauer spectra with simulations of the high-spin ferric contaminant; additional details regarding the analysis of Mössbauer spectra; 17O EPR analysis, variable temperature EPR data for T = 10 K to T = 60 K (Figure S6); additional details regarding DFT analysis of various models for Int1 (Tables S2-S6); Aeff angular dependence plots for Models I and II (Figure S7). This material is available free of charge via the Internet at http://pubs.acs.org.
Accession Codes
The coordinates and structure factor files have been deposited in the Protein Data Bank (PDB) [www.rcsb.org/pdb] with accession numbers: 5BWG and 5BWH.
REFERENCES
- 1.Dagley S. In: The Bacteria. Sokatch JR, Ornston LN, editors. Vol. 10. Academic Press; Orlando, FL: 1986. pp. 527–555. Chapter 10. [Google Scholar]
- 2.Gibson DT, Parales RE. Curr. Opin. Biotechnol. 2000;11:236–243. doi: 10.1016/s0958-1669(00)00090-2. [DOI] [PubMed] [Google Scholar]
- 3.Gibson DT. Microbial Degradation of Organic Compounds. Marcel Dekker; New York, NY: 1984. [Google Scholar]
- 4.Díaz E, Jiménez JI, Nogales J. Curr. Opin. Biotechnol. 2013;24:431–442. doi: 10.1016/j.copbio.2012.10.010. [DOI] [PubMed] [Google Scholar]
- 5.Kojima Y, Itada N, Hayaishi OJ. Biol. Chem. 1961;236:2223–2228. [PubMed] [Google Scholar]
- 6.Que L, Jr., Lipscomb JD, Münck E, Wood JM. Biochim. Biophys. Acta. 1977;485:60–74. doi: 10.1016/0005-2744(77)90193-0. [DOI] [PubMed] [Google Scholar]
- 7.Arciero DM, Lipscomb JD, Huynh BH, Kent TA, Münck E. J. Biol. Chem. 1983;258:14981–14991. [PubMed] [Google Scholar]
- 8.Whittaker JW, Lipscomb JD. J. Biol. Chem. 1984;259:4487–4495. [PubMed] [Google Scholar]
- 9.Lipscomb JD, Orville AM. Met. Ions Biol. Syst. 1992;28:243–298. [Google Scholar]
- 10.Han S, Eltis LD, Timmis KN, Muchmore SW, Bolin JT. Science. 1995;270:976–980. doi: 10.1126/science.270.5238.976. [DOI] [PubMed] [Google Scholar]
- 11.Que L, Jr., Ho RYN. Chem. Rev. 1996;96:2607–2624. doi: 10.1021/cr960039f. [DOI] [PubMed] [Google Scholar]
- 12.Vaillancourt FH, Bolin JT, Eltis LD. Crit. Rev. Biochem. Mol. Biol. 2006;41:241–267. doi: 10.1080/10409230600817422. [DOI] [PubMed] [Google Scholar]
- 13.Groce SL, Miller-Rodeberg MA, Lipscomb JD. Biochemistry. 2004;43:15141–15153. doi: 10.1021/bi048690x. [DOI] [PubMed] [Google Scholar]
- 14.Groce SL, Lipscomb JD. Biochemistry. 2005;44:7175–7188. doi: 10.1021/bi050180v. [DOI] [PubMed] [Google Scholar]
- 15.Kovaleva EG, Lipscomb JD. Science. 2007;316:453–457. doi: 10.1126/science.1134697. [DOI] [PMC free article] [PubMed] [Google Scholar]
- 16.Lipscomb JD. Curr. Opin. Struct. Biol. 2008;18:644–649. doi: 10.1016/j.sbi.2008.11.001. [DOI] [PMC free article] [PubMed] [Google Scholar]
- 17.Bugg TDH. Tetrahedron. 2003;59:7075–7101. [Google Scholar]
- 18.Knoot CJ, Purpero VM, Lipscomb JD. Proc. Natl. Acad. Sci. U. S. A. 2015;112:388–393. doi: 10.1073/pnas.1419118112. [DOI] [PMC free article] [PubMed] [Google Scholar]
- 19.Miller MA, Lipscomb JD. J. Biol. Chem. 1996;271:5524–5535. doi: 10.1074/jbc.271.10.5524. [DOI] [PubMed] [Google Scholar]
- 20.Kovaleva EG, Lipscomb JD. Biochemistry. 2008;47:11168–11170. doi: 10.1021/bi801459q. [DOI] [PMC free article] [PubMed] [Google Scholar]
- 21.Emerson JP, Kovaleva EG, Farquhar ER, Lipscomb JD, Que L., Jr. Proc. Natl. Acad. Sci. USA. 2008;105:7347–7352. doi: 10.1073/pnas.0711179105. [DOI] [PMC free article] [PubMed] [Google Scholar]
- 22.Mbughuni MM, Chakrabarti M, Hayden JA, Bominaar EL, Hendrich MP, Münck E, Lipscomb JD. Proc. Natl. Acad. Sci. U. S. A. 2010;107:16788–16793. doi: 10.1073/pnas.1010015107. [DOI] [PMC free article] [PubMed] [Google Scholar]
- 23.Fielding AJ, Kovaleva EG, Farquhar ER, Lipscomb JD, Que L., Jr. JBIC, J. Biol. Inorg. Chem. 2011;16:341–355. doi: 10.1007/s00775-010-0732-0. [DOI] [PMC free article] [PubMed] [Google Scholar]
- 24.Mbughuni MM, Chakrabarti M, Hayden JA, Meier KK, Dalluge JJ, Hendrich MP, Münck E, Lipscomb JD. Biochemistry. 2011;50:10262–10274. doi: 10.1021/bi201436n. [DOI] [PMC free article] [PubMed] [Google Scholar]
- 25.Mbughuni MM, Meier KK, Münck E, Lipscomb JD. Biochemistry. 2012;51:8743–8754. doi: 10.1021/bi301114x. [DOI] [PMC free article] [PubMed] [Google Scholar]
- 26.Kovaleva EG, Lipscomb JD. Biochemistry. 2012;51:8755–8763. doi: 10.1021/bi301115c. [DOI] [PMC free article] [PubMed] [Google Scholar]
- 27.Fielding AJ, Lipscomb JD, Que L., Jr. J. Am. Chem. Soc. 2012;134:796–799. doi: 10.1021/ja2095365. [DOI] [PMC free article] [PubMed] [Google Scholar]
- 28.Fielding AJ, Lipscomb JD, Que LJ. JBIC, J. Biol. Inorg. Chem. 2014;19:491–504. doi: 10.1007/s00775-014-1122-9. [DOI] [PMC free article] [PubMed] [Google Scholar]
- 29.Arciero DM, Lipscomb JD. JBIC, J. Biol. Chem. 1986;261:2170–2178. [PubMed] [Google Scholar]
- 30.Vetting MW, Wackett LP, Que L, Jr., Lipscomb JD, Ohlendorf DH. J. Bacteriol. 2004;186:1945–1958. doi: 10.1128/JB.186.7.1945-1958.2004. [DOI] [PMC free article] [PubMed] [Google Scholar]
- 31.Vaillancourt FH, Barbosa CJ, Spiro TG, Bolin JT, Blades MW, Turner RFB, Eltis LD. J. Am. Chem. Soc. 2002;124:2485–2496. doi: 10.1021/ja0174682. [DOI] [PubMed] [Google Scholar]
- 32.Deeth RJ, Bugg TDH. JBIC, J. Biol. Inorg. Chem. 2003;8:409–418. doi: 10.1007/s00775-002-0430-7. [DOI] [PubMed] [Google Scholar]
- 33.Borowski T, Georgiev V, Siegbahn PEM. J. Am. Chem. Soc. 2005;127:17303–17314. doi: 10.1021/ja054433j. [DOI] [PubMed] [Google Scholar]
- 34.Dong G, Shaik S, Lai W. Chem. Sci. 2013;4:3624–3635. [Google Scholar]
- 35.Spence EL, Langley GJ, Bugg TDH. J. Am. Chem. Soc. 1996;118:8336–8343. [Google Scholar]
- 36.Siegbahn PE, Haeffner F. J. Am. Chem. Soc. 2004;126:8919–8932. doi: 10.1021/ja0493805. [DOI] [PubMed] [Google Scholar]
- 37.Christian GJ, Ye S, Neese F. Chem. Sci. 2012;3:1600–1611. [Google Scholar]
- 38.Dong G, Lai W. J. Phys. Chem. B. 2014;118:1791–1798. doi: 10.1021/jp411812m. [DOI] [PubMed] [Google Scholar]
- 39.Kovaleva EG, Rogers MS, Lipscomb JD. Biochemistry. 2015;54:5329–5339. doi: 10.1021/acs.biochem.5b00709. [DOI] [PMC free article] [PubMed] [Google Scholar]
- 40.Griffith JS. Phys. Rev. 1963;132:316–319. [Google Scholar]
- 41.Münck E, Surerus K, Hendrich M. Methods Enzymol. 1993;227:463–479. doi: 10.1016/0076-6879(93)27019-d. [DOI] [PubMed] [Google Scholar]
- 42.Hoffman BM. J. Phys. Chem. 1994;98:11657–11665. [Google Scholar]
- 43.Abragam A, Bleaney B. Electron Paramagnetic Resonance of Transition Ions. Clarendon Press; Oxford: 1970. [Google Scholar]
- 44.Shaik S, Chen H, Janardanan D. Nat. Chem. 2011;3:19–27. doi: 10.1038/nchem.943. [DOI] [PubMed] [Google Scholar]
- 45.Chiang C-W, Kleespies ST, Stout HD, Meier KK, Li P-Y, Bominaar EL, Que L, Jr., Münck, Lee W-Z. J. Am. Chem. Soc. 2014;136:10846–10849. doi: 10.1021/ja504410s. [DOI] [PMC free article] [PubMed] [Google Scholar]
- 46.Groce SL, Lipscomb JD. J. Am. Chem. Soc. 2003;125:11780–11781. doi: 10.1021/ja0368103. [DOI] [PubMed] [Google Scholar]
- 47.Wang YZ, Lipscomb JD. Protein Expr Purif. 1997;10:1–9. doi: 10.1006/prep.1996.0703. [DOI] [PubMed] [Google Scholar]
- 48.Krebs C, Dassama LM, Matthews ML, Jiang W, Price JC, Korboukh V, Li N, Bollinger JM., Jr. Coord. Chem. Rev. 2013;257:234–243. doi: 10.1016/j.ccr.2012.06.020. [DOI] [PMC free article] [PubMed] [Google Scholar]
- 49.Frisch MJ, et al. Gaussian, Inc.; Wallingford, CT: 2009. [Google Scholar]
- 50.Vrajmasu V, Münck E, Bominaar EL. Inorg. Chem. 2003;42:5974–5988. doi: 10.1021/ic0301371. [DOI] [PubMed] [Google Scholar]
Associated Data
This section collects any data citations, data availability statements, or supplementary materials included in this article.


