

Abstract
Shotgun proteomics generates valuable information from large-scale and target protein characterizations, including protein expression, protein quantification, protein post-translational modifications (PTMs), protein localization, and protein-protein interactions. Typically, peptides derived from proteolytic digestion, rather than intact proteins, are analyzed by mass spectrometers because peptides are more readily separated, ionized and fragmented. The amino acid sequences of peptides can be interpreted by matching the observed tandem mass spectra to theoretical spectra derived from a protein sequence database. Identified peptides serve as surrogates for their proteins and are often used to establish what proteins were present in the original mixture and to quantify protein abundance. Two major issues exist for assigning peptides to their originating protein. The first issue is maintaining a desired false discovery rate (FDR) when comparing or combining multiple large datasets generated by shotgun analysis and the second issue is properly assigning peptides to proteins when homologous proteins are present in the database. Herein we demonstrate a new computational tool, ProteinInferencer, which can be used for protein inference with both small- or large-scale data sets to produce a well-controlled protein FDR. In addition, ProteinInferencer introduces confidence scoring for individual proteins, which makes protein identifications evaluable.
Keywords: Proteomics, Mass Spectrometry, Database Search, Protein Inference, False Discovery Rate (FDR), Peptide-Spectrum match (PSM)
Introduction
Mass spectrometry-based proteomics has been widely employed as a high-throughput and robust tool in biological research. Proteomics characterizes a variety of features of proteins in large-scale, and significant progress has been made in studies involving protein profiling, protein PTMs, protein complexes, and protein turnover.[1]
Mass spectrometry-based proteomics can be classified into two main categories: bottom-up (shotgun) [2] and top-down[3]. The top-down strategy analyzes intact proteins, whereas the bottom-up strategy measures peptides derived from digested proteins. Although top-down methods provide a direct measurement of proteins, the general and robust fragmentation of intact proteins is challenging. The bottom-up shotgun approach is based on the analysis of peptides, for which methods of separation, fragmentation and interpretation are more well developed. The shotgun strategy has enabled the most comprehensive proteome analysis, and is a widely used method in proteomics. The recent mapping of the human proteome used a large-scale shotgun approach.[4, 5]
In a typical shotgun experiment, a protein mixture is digested by a specific enzyme (e.g. trypsin) to produce a complex peptide mixture. The peptides are then subjected to peptide fractionation and separation in either one or multiple dimensions. Peptides eluted from the chromatographic column are ionized, and their m/z values are measured by the mass spectrometer. Certain peptides (e.g. those with the highest ion intensities) are chosen for fragmentation. The fragment ions from one precursor peptide produce a fragment ion spectrum, which is compared to theoretical spectra generated from a protein database using automated algorithms such as SEQUEST [6, 7], ProLuCID[8], or MASCOT [9]. A scoring evaluation (e.g. Xcorr and deltaCN in SEQUEST, Z-score in ProLuCID) is usually applied to describe the degree of matching between observed and in silico generated spectra. The peptide-spectrum matches (PSMs) passing a quality score cut-off are mapped to proteins by using algorithms such as DTASelect[10] and Search Engine Processor[11]. Due to the redundancy of protein sequence databases and protein isoforms derived from the same gene, not all peptides can be uniquely assigned to a single entry and are instead assigned to multiple entries or protein isoforms in the database. Therefore, a protein inference method is required to decide the best match among the possible identified proteins. Improper or inconsistent protein inference will lead to either over- or under- counting of proteins identified.
PSM scores can be filtered (e.g. through the use of XCorr), influencing protein identifications, and corresponding false discovery rate (FDR), which is a widely used measurement to assess overall proteomic data quality. The FDR is usually estimated by using a target-decoy database strategy, [12] and can be measured at three different levels: PSM, peptide, and protein. The FDR for PSMs can be easily calculated and controlled by filtering the PSM quality score because each PSM is an independent event and the numbers of the forward and decoy PSMs are fixed for a given cut-off value. However, the peptide and protein numbers are not only determined by PSMs, but also by the data set itself (e.g. a large data set tends to have more PSMs and peptides assigned to each protein). Therefore with the same PSM FDR, larger datasets will have higher protein level FDR than smaller datasets. Another limitation of global protein FDR is that one cannot easily assess the confidence of individual proteins based on it. Obviously the confidence score for individual proteins should vary and should be of great importance to evaluate individual protein matches. To solve this problem, tools, such as ProteinProphet,[13] PANORAMICS,[14] Scaffold,[15] have been developed. These algorithms compute both peptide probabilities and protein probabilities.
Several algorithms have been developed to statistically assess peptide identification results from database search programs. A complication of bottom-up proteomics is the need to assign peptide identifications back to their respective proteins, which becomes complicated when redundant entries or protein isoforms exist. The rules used to infer a protein and control the protein FDR vary between programs, making it difficult to compare the results derived from different protein inference methods. (e.g. for those proteins with only shared peptides, to report only one representative protein or all possible proteins as a group is still an unresolved issue). An earlier practice for reporting protein identifications was to only include those proteins with two or more peptide identifications. This “rule” for protein identifications has changed with the widespread use of high mass accuracy mass spectrometers and now one high quality peptide identification is quite frequently used.[16, 17] Some representative protein inference tools include ProteinProphet,[18] IDPicker,[19] IsoformResolver[20], ProValt,[21] Combyne,[22] Fido,[23] and Scaffold [15] etc. PeptideProphet [24] first computes peptide identification probabilities, which are further used to estimate the protein identification probabilities by ProteinProphet using a statistical model.[18] MAYU software can be applied additionally to control the protein identification FDR. [25] IDPicker builds a peptide-protein bipartite graph using the principle of parsimony, and controls data quality using a specific peptide identification FDR.[19, 26] The updated IDPicker version combines multiple scores produced by search engines to increase the protein identification confidence.[26] IsoformResolver uses a peptide-centric strategy,[20] in which proteins are grouped according to both in silico digestion and observed PSMs.
We developed a new tool, ProteinInferencer, to calculate protein FDR for both individual experiments and large-scale proteomics projects that combine multiple sample fractions or experiments. PSMs, together with their key quality scoring parameters, XCorr and Z-score, are inferred into proteins. ProteinInferencer re-evaluates the confidence for both peptide and protein identifications. The PSM score, peptide occurrence and spectral count determine peptide confidence and this information is, in turn, used to calculate protein confidence. The protein confidence score is calculated with a protein local FDR using the peptide confidence score, protein occurrence, protein sequence coverage, and protein length. With ProteinInferencer, we are able to identify significantly more peptides compared to DTASelect at a given global protein FDR control. Therefore it is a valuable tool for large-scale proteomics.
Materials and Methods
Sample preparation
Thirty micrograms of protein extract from MCF-10 cell lysate were precipitated with 5x volume of cold acetone. The protein pellets were obtained by centrifuging at 14,000g for 10 min at 4 °C, and then solubilized and reduced with 100 mM Tris-HCl/8 M urea/5 mM DTT pH 8.5. Cysteines were alkylated with 10 mM iodoacetamide. The solution was diluted 1:4 with 100 mM Tris pH 8.5 and digested with 1 μg of trypsin at 37 °C overnight. Adding formic acid to 2% terminated the digestion. Nineteen biological replicates were analyzed.
Mass spectrometry
Mass spectrometry and data analysis were performed as previously described previously.[27] Briefly, the protein digest was analyzed using an 11-step MudPIT.[2] In each salt step, peptides were eluted from the C18 microcapillary column over a 2 hr chromatographic gradient, and electrosprayed directly into an LTQ Velos Orbitrap mass spectrometer (ThermoFisher, San Jose, CA) with the application of a distal 2.5-kV spray voltage. A cycle of one full-scan mass spectrum (400–1800 m/z) at a resolution of 60,000 followed by 20 data dependent CID MS/MS spectra at a 35% normalized collision energy was repeated continuously throughout each step of the multidimensional separation.
PSM identification and DTASelect
PSM identification was performed with the Integrated Proteomics Pipeline - IP2 (Integrated Proteomics Applications, Inc., San Diego, CA. http://www.integratedproteomics.com/) using ProLuCID [28]. The tandem mass spectra were searched against an EBI IPI human (version 3.87, 91 464 sequences) protein database. A target-decoy database containing the reversed sequences of all the proteins appended to the target database was employed in the database search. Cysteine carbamidomethyl was set as a stable modification. Four data sets of different sizes, which consist of 1, 5, 10, and 19 MudPIT runs, respectively were used in the analysis. Each data set, containing unfiltered PSMs, was subjected to DTASelect2 [29] with varied global protein FDR cut-off thresholds, ranging from 0% to 10%. The DTASelect controls global protein FDRs by ranking PSM scores, assembling proteins, counting target/decoy hits. (Figure 2A) The PSMs were pre-filtered at a FDR of 1% for each MudPIT experiment, and the resulting PSMs were used as input in ProteinInferencer.
Figure 2.

Comparison of DTASelect and ProteinInferencer. (A) Work flow showing the data processing pipelines for DTASelect and ProteinInferencer. DTASelect controls global protein FDR through PSM scores, whereas ProteinInferencer controls global protein FDR through individual protein confidence. (B) Filtering diagram contrasting DTASelect and ProteinInferencer. DTASelect filters at the PSM level, whereas ProteinInferencer filters at the protein level.
Protein inference and Confidence score
Peptides identified in all the experiments are used collectively to infer the protein identification and calculate a confidence score for each protein group. Proteins identified with the same set of peptides were put into a protein group (Figure 1) in a similar manner as described by others.[30]
Figure 1.

Protein inference from peptide identification. Several possible protein group types are shown. Protein entries can be identified by unique or shared peptides. A protein identification can include unique peptides only, shared peptides only or both unique and shared peptides.
The first step of protein identification is to assemble PSMs to protein entries based on their amino acid sequences in the protein database. It is not unusual for a peptide sequence to be shared by multiple protein identifiers in a database. While there is not a standard for how to report protein identifications, two methods are frequently used. The first method reports a single representative protein rather than all possible proteins; the second method reports protein groups. A general rule of the protein grouping method is that proteins are placed into one group if all the identified peptides can be shared among proteins. ProteinInferencer uses the group strategy.
There are at least four possible scenarios for protein groupings as shown in Figure 1. In the first case, a protein entry (Protein A) is exclusively identified by unique peptides in the database, thus the single protein can itself be a protein group (protein group A′). Second, the same peptides can be mapped to multiple protein entries (Protein C and D), and these entries are then classified as one protein group (protein group C′). The third type of protein group can inferred from both unique and ambiguous peptide matches (protein group D′ and F′). The last protein group contains only peptides that have been simultaneously matched to other protein groups (protein group B′ and E′) that also possess additional unique peptide evidence or a higher protein confidence score.
After the first step of protein grouping, a parsimonious protein group can be obtained by removing those protein groups without any unique identifying peptides. For example, the protein group E′ contains two peptide identifications, (Figure 1) however it is not mandatory to include E′ to explain the existing peptides. Protein group E′ can be subsumed by other protein groups. Similarly, protein group B′ is a subset of protein group C′ that should be eliminated by protein parsimony. Notably, elimination of these protein groups affects the protein number, but it can still be advantageous to report these proteins because they may be present in the sample.
A confidence score is calculated for each of the protein groups using local FDR. Assume that we are given a list P of protein groups and a list F of features associated with each protein group in P. P is comprised of both decoy protein groups (decoy hits) and forward protein groups (forward hits) and our goal is to calculate a confidence score for each protein group in P using the features present in the list F. By default, F contains 2 features, the sum of peptide confidence scores and average of the peptide confidence scores for each protein groups. In this note, we describe a method to calculate such a score.
a. There are m protein groups in P and n features in F. Protein groups are indexed by i, features by j.
b. The local FDR will ultimately be based on calculating the decoy hits ratio in the local neighborhood. Let K be a nonnegative integer parameter used to define the number of elements in the local neighborhood. For each feature j, protein group list P is sorted in descending order based on feature j. For protein group i and feature j, use K to define the local neighborhood of i w.r.t. j. let DijK be the number of decoy hits in the local neighborhood and LijK be the number of protein groups in the local neighborhood. Define the local FDR for i and j as sij = 2XDijK / LijK and the confidence score for protein group i on feature j as cij = 1 - sij,
C. Finally the confidence score of protein group i the local FDR calculated based on the sum of cij over all features j as described in b.
Results and Discussions
ProteinInferencer provides solutions for protein inference, protein global FDR control/computation, and individual protein confidence assessment. ProteinInferencer uses identified PSMs from a target-decoy database search as input. The PSM FDR can be estimated by measuring the ratio between decoy and target spectral counts. Currently, the PSMs must be obtained from the search engine SEQUEST [7] or ProLuCID [28], as the scoring features from these search engines are implemented in the subsequent calculation.
When combining individual data sets to form larger ones, the previously determined peptide and protein FDRs will change because each peptide can have multiple PSMs and each protein can be assembled by many peptides. This is because when data sets are merged, true and false protein matches accumulate differentially. PSMs corresponding to true positives tend to concentrate into the same proteins, which are usually a subset of a total protein database. Matches to the reverse sequences are falsely identified and accumulate among proteins in a whole reverse database randomly. Consequently, a forward protein match is usually supported by many peptide identifications and PSMs whereas a reverse protein hit typically has a very limited number of peptide identifications and PSMs. When protein inference is carried out across large data sets, true proteins will be identified by repeated assignment of PSMs, quickly leading to protein identification saturation (all proteins in the sample above the detection limit as determined by experimental set-up). Reverse hits/false proteins are saturated (i.e. complete reverse database) much more slowly, since each protein hit in the reverse database is random and inferred with few PSMs. Therefore, a well-controlled FDR for PSMs does not ensure an acceptable FDR for proteins especially for a large-scale data set. [31, 32]
Protein FDR
By using the target-decoy database search strategy, the inferred protein groups, identified peptides, and fragment ion spectra from both target and decoy hits can be obtained, and the corresponding FDRs can be calculated. Of these FDRs, protein FDR is not readily available but of great importance. There are typically two approaches to control the protein FDR. First, the protein FDR can be controlled by applying a stringent score filter on PSMs (e.g. DTASelect) (Figure 2). [10] Protein identifications are initially based on PSMs, therefore PSM quality influences protein confidence. Protein level FDR is set by the stringency of the PSM cutoff. Alternatively, the protein FDR can be controlled by filtering based on protein probabilities, which is the approach used by ProteinInferencer. [18] In this case, the proteins, rather than PSMs, are treated as individual identities (Figure 2). Decoy protein hits usually contain a limited number of PSMs and therefore will be scored lower at the protein level. As demonstrated previously,[33] (Figure 2) to exclude the false proteins Y and Z with DTASelect, extremely stringent criteria are required which may also deplete many true PSMs and peptides. With ProteinInferencer, the proteins Y and Z are discarded because of their low protein scores. As a result, the protein FDR can be controlled by ProteinInferencer but with more peptide evidence (sequence coverage).
Protein identification FDR is a useful estimate for overall data confidence, and the corresponding protein and peptide numbers represent the robustness of the method being employed. We compared two different protein inference approaches: DTASelect alone versus ProteinInferencer following PSM pre-filtering. Their ability to identify proteins/peptides from data sets of various sizes as a function of protein FDR was investigated. The four data sets consisted of 1, 5, 10, or 19 shotgun experiments respectively, and each experiment consisted of ~11 LC-MS/MS runs (or 11, 55, 110, 209 LC/MS/MS runs, respectively). Notably, a peptide here is not the same as a PSM. A unique amino acid sequence is counted as one peptide. The same sequence identified from different charge states, for example +2 and +3 charge states, are counted separately.
As described previously, target protein matches get saturated more quickly than decoy hits because decoy hits are random matches whereas target matches map to a subset of the entire database. Therefore, if the same threshold is applied during PSM filtering on data sets of varied sizes, the resulting protein FDRs can differ significantly. For DTASelect, a PSM FDR of 0.01% (which is extremely stringent) could result in a protein FDR of 0.26% for a single MudPIT run and a protein FDR of 1% for a large data set consisting of 19 MudPIT runs (Figure 3). If the PSM FDR is loosened to 0.04%, the single MudPIT data set returns a protein FDR of 0.94%, but the large 19 MudPIT data set generates a protein FDR of 5.9%. For both DTASelect and ProteinInferencer, to obtain a given protein FDR, the larger data set requires a more stringent PSM cut-off than the small data set. For instance, to obtain a protein FDR of 1%, the large data set required a PSM FDR of 0.012% while the small data set required a PSM FDR of 0.043% (Figure 3 B). Notably, the increased stringency required to discriminate forward and reverse hits within data sets of increasing size was not as great for ProteinInferencer, indicating that it is better at controlling protein FDR. For a single MudPIT, ProteinInferencer and DTASelect generated comparable FDR values (blue curves in Figure 3). However, as more experiments are included in the data set, DTASelect required a much more stringent PSM cut-off. ProteinInferencer also used a higher PSM cutoff for larger data sets, but it was not as great as that used by DTASelect. Consequently, for a large data set at a given protein confidence level, many more PSMs are included in the final protein list when using ProteinInferencer.
Figure 3.

Correlation between protein FDR and PSM FDR. The influence of data set size on protein FDR is much larger using (A) the DTASelect method compared to (B) the ProteinInferencer method at the same PSM FDR.
The use of mass spectrometry-based proteomics allows the characterization of thousands of proteins in one experiment, and the global protein FDR is used to evaluate the global protein confidence. A protein FDR of 1% is a well-accepted standard for large-scale proteomic data. However, the number of identified proteins and protein FDR are two interdependent conflicting factors in proteomic data. An optimal balance has to be achieved, at which the inclusion of false proteins is minimized and the inclusion of confident proteins is maximized. To determine this balance, we investigated the correlation between protein FDRs and their corresponding protein and peptide numbers.
The protein numbers were first plotted against protein FDRs for both DTASelect and ProteinInferencer (Figure 4A–D). The difference between DTASelect and ProteinInferencer was not significant when a small data set (1 MudPIT run) was used (Figure 4A). ProteinInferencer worked slightly better than DTASelect (at a protein FDR of 1%, ProteinInferencer returned 6280 target protein hits while DTASelect had 6068 hits). With a larger data set, ProteinInferencer always generated more target proteins than DTASelect at the same protein FDR. This difference was especially pronounced for very high confidence protein matches. Taking data set consisting of 10 MudPIT runs as an example, ProteinInferencer produced 6518 proteins at protein FDR of 0%, whereas the DTASelect produced 5083 proteins at protein FDR of 0.04% (Figure 4C). This trend was observed in larger data sets (5 or 19 MudPIT runs), where ProteinInferencer always identified more proteins at the same FDR (Figure 4B,D).
Figure 4.

Identified protein and peptide numbers from DTASelect and ProteinInferencer. (A–D) The correlation between protein FDRs and the corresponding protein number is shown. ProteinInferencer consistently generated more protein identifications compared to DTASelect at the same protein FDR. (E–H) The correlation between protein FDRs and the corresponding peptide number is shown. Using ProteinInferencer resulted in many more peptide identifications compared to DTASelect at the same protein FDR.
Peptide numbers were also investigated at different protein FDRs. In all the comparisons made between DTASelect and ProteinInferencer, ProteinInferencer showed significantly higher peptide numbers than DTASelect (Figure 4E–H). For example, in the 19-run data set, at a protein FDR of 1%, DTASelect identified 86,638 peptides whereas ProteinInferencer identified 157,221 peptides (Figure 4H).
Protein confidence
ProteinInferencer is designed in a way that new features can be easily added. However, with the current implementation, we use the sum and average of the peptide confidence scores for each protein groups to calculate confidence of this protein group. Unlike PSM-based filtering algorithms, ProteinInferencer first control FDR at peptide level. PSMs in all experiments match to the same peptide are grouped into a PeptideItem. The number of PSMs in each experiments are stored as spectral count for this PeptideItem. The same peptide hit with different charge states are considered as different PeptideItems. Different PTM decorations on the same peptide sequence are also considered as different PeptideItems. PeptideItems are sorted based on the highest ProLuCID Z score [8, 34] value of all the PSMs match to this PeptideItem in a descending order. A confidence score of each PeptideItem is calculated as the local FDR based on a window of 200 neighboring PeptideItems. Only PeptideItems satisfy the user specified peptide false positive rate are accepted (the default value is 0.05). Local and global FDRs can be used to determine the confidence of protein identification at different levels: local FDR assesses the confidence of a given individual protein, whereas global FDR is used to evaluate the overall quality of a population of proteins.
Protein confidence is assessed by a local false discovery rate, which is determined using a score combining the sum and average of peptide scores (Figure 5A). As shown in the ROC curves the combined score showed the greatest power of discrimination compared to either sum or average of Z scores. By looking at the distribution curves for forward and reverse hits, the combined scores also demonstrated great ability to distinguish forward and reverse proteins. Based on this score, nearly 80% of the forward hits have a confidence score of approximately 1, while only a few reverse hits have a protein confidence score greater than 0.5 (Figure 5B). Notably, ProteinInferencer performs the pruning of subset and subsumable proteins precede confidence estimation to cut down on duplicate information.
Figure 5.
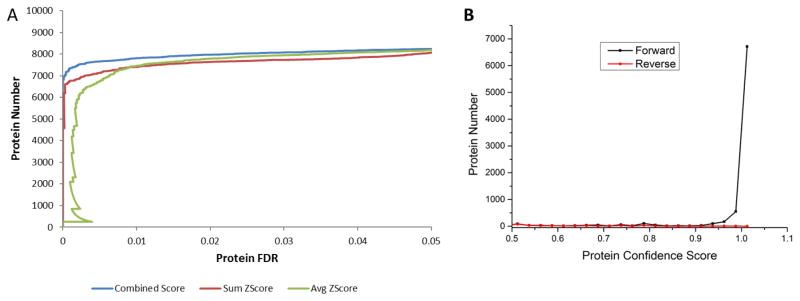
Distribution of peptide and protein confidence. (A) Receiver operating characteristic (ROC) curves testing three scores (sum, average or combined) are graphed. The combined score showed the best discrimination power. (B) The distributions of protein confidence scores of forward and reverse proteins are shown. The proteins were divided into bins according to their protein scores. The majority of forward protein hits have a confidence score of approximately 1, while the majority of reverse hits have a protein confidence score less than 0.4.
A number of factors contribute to protein confidence determination in large-scale data sets. We investigated the influences of protein occurrence, identified peptide number, protein length, and the percentage of identified tryptic peptides out of the total in silico tryptic peptides expected (reflecting the sequence coverage). The data set being used is the largest, containing 19-shotgun experiments.
Protein occurrence represents the frequency a protein is identified in multiple experiments/replicates. Obviously, a higher occurrence number implies a higher probability of a true match. For proteins with only a single occurrence, there were more reverse matches compared to forward matches (2328 and 1745, respectively). In contrast, 99.8% of proteins with an occurrence number equal to or greater than 8 were forward matches (Figure 6A). The fraction of forward matches (orange curves in Figure 6) increases with the occurrence number, indicating a reverse match was not as repeatedly identified as forward hits. If a protein FDR of 1% was applied in protein confidence filtering, most of the false protein matches with low occurrence numbers could be removed.
Figure 6.

Protein confidence determined by protein occurrence (A), identified peptide number (B), protein length (amino acid number) (C), and sequence coverage (% identified tryptic peptides) (D). Protein occurrence, identified peptide number, and sequence coverage positively contribute to the protein confidence score, whereas the protein length has less influence.
Next, we investigated the influence of identified peptides per protein on protein identification confidence (Figure 6B). Similar to the protein occurrence number, more peptide identifications suggested a higher probability of true protein identification. The majority of reverse hits (2526 of 2888) were concentrated in the category where proteins are only identified by one peptide. The fraction of forward hits increased rapidly with the identified peptide number. Over 99% of proteins with more than 7 peptides were forward protein hits.
The correlation between the size of the protein as measured by the number of amino acids for identified proteins and their corresponding confidence score was also studied. The ratios between forward and reverse hits were mostly consistent across varied protein lengths. Notably, for extremely large or small proteins, there is a slightly increased chance of a reverse match (Figure 6C). It may be that for small proteins, both forward and reverse hits are identified by a limited number of peptides, therefore their scores did not discriminate well. For large proteins, reverse protein sequences generated a large number of in silico false peptide candidates, increasing the probability of false matches.
The fraction of identified tryptic peptide number versus theoretical tryptic peptide number was plotted in Figure 6D. This number reflected the protein sequence coverage by identified peptides. As expected, higher sequence coverage resulted in a higher protein confidence. As demonstrated, almost all the reverse hits had fractions lower than 5%.
Conclusions
Large-scale experiments can encompass tens to hundreds of experiments when different conditions and replicate measurements are involved. Assessing and controlling data quality is particularly important for these types of experiments so confident conclusions can be drawn from the results and decisions about future experiments can be made. Furthermore, proper assignment of peptides to proteins, or protein inference, is important so as to not over-estimate the number of proteins identified. ProteinInferencer was developed to infer proteins, compare multiple experiments, and assess confidence at both global and individual protein levels. ProteinInferencer utilizes the scoring features from SEQUEST and ProLuCID after obtaining confident peptide lists from these programs and then uses all the peptides identified to calculate protein level confidence. ProteinInferencer allows researchers to obtain more comprehensive protein and peptide coverage. The well-controlled protein FDR becomes more useful when pursuing large-scale data analysis.
Supplementary Material
Biological Significance.
The manuscript describes an approach to assess the analysis of large-scale proteomic projects by creating a consistent protein FDR across all experiments. A confidence score is calculated for each of identified proteins. ProteinInferencer provides a proper way to compare protein and peptides identification among large number of mass spectrometry experiments.
Acknowledgments
Funding has been provided by National Institutes of Health grants P41 GM103533, R01 MH067880, UCLA/NHLBI Proteomics Centers HHSN268201000035C.
Footnotes
Conflict of interest
The authors declares no conflict of interest.
The ProteinInferencer software can be downloaded at http://fields.scripps.edu/downloads.php.
Publisher's Disclaimer: This is a PDF file of an unedited manuscript that has been accepted for publication. As a service to our customers we are providing this early version of the manuscript. The manuscript will undergo copyediting, typesetting, and review of the resulting proof before it is published in its final citable form. Please note that during the production process errors may be discovered which could affect the content, and all legal disclaimers that apply to the journal pertain.
Contributor Information
Yaoyang Zhang, Email: zhangyy@scripps.edu.
Tao Xu, Email: txu2@dow.com.
Bing Shan, Email: bingshan@scripps.edu.
Jonathan Hart, Email: jhart@scripps.edu.
Aaron Aslanian, Email: aslanian@scripps.edu.
Xuemei Han, Email: xmhan@scripps.edu.
Nobel Zong, Email: zchghno1@gmail.com.
Haomin Li, Email: haomin_li@yahoo.com.
Howard Choi, Email: cjh9595@ucla.edu.
Dong Wang, Email: DWang7@mdanderson.org.
Lipi Acharya, Email: lacharya@dow.com.
Lisa Du, Email: lisa13du@yahoo.com.
Peter K. Vogt, Email: pkvogt@scripps.edu.
Peipei Ping, Email: pping@mednet.ucla.edu.
References
- 1.Zhang Y, Fonslow BR, Shan B, Baek MC, Yates JR., 3rd Protein analysis by shotgun/bottom-up proteomics. Chemical reviews. 2013;113:2343–94. doi: 10.1021/cr3003533. [DOI] [PMC free article] [PubMed] [Google Scholar]
- 2.Washburn MP, Wolters D, Yates JR., 3rd Large-scale analysis of the yeast proteome by multidimensional protein identification technology. Nat Biotechnol. 2001;19:242–7. doi: 10.1038/85686. [DOI] [PubMed] [Google Scholar]
- 3.Yates JR, 3rd, Kelleher NL. Top down proteomics. Anal Chem. 2013;85:6151. doi: 10.1021/ac401484r. [DOI] [PMC free article] [PubMed] [Google Scholar]
- 4.Wilhelm M, Schlegl J, Hahne H, Moghaddas Gholami A, Lieberenz M, Savitski MM, et al. Mass-spectrometry-based draft of the human proteome. Nature. 2014;509:582–7. doi: 10.1038/nature13319. [DOI] [PubMed] [Google Scholar]
- 5.Kim MS, Pinto SM, Getnet D, Nirujogi RS, Manda SS, Chaerkady R, et al. A draft map of the human proteome. Nature. 2014;509:575–81. doi: 10.1038/nature13302. [DOI] [PMC free article] [PubMed] [Google Scholar]
- 6.Yates JR, 3rd, Eng JK, McCormack AL, Schieltz D. Method to correlate tandem mass spectra of modified peptides to amino acid sequences in the protein database. Anal Chem. 1995;67:1426–36. doi: 10.1021/ac00104a020. [DOI] [PubMed] [Google Scholar]
- 7.Eng JK, Mccormack AL, Yates JR. An Approach to Correlate Tandem Mass-Spectral Data of Peptides with Amino-Acid-Sequences in a Protein Database. J Am Soc Mass Spectr. 1994;5:976–89. doi: 10.1016/1044-0305(94)80016-2. [DOI] [PubMed] [Google Scholar]
- 8.Xu T, Venable JD, Park SK, Cociorva D, Lu B, Liao L, et al. ProLuCID, a fast and sensitive tandem mass spectra-based protein identification program. Mol Cell Proteomics. 2006:5. [Google Scholar]
- 9.Perkins DN, Pappin DJ, Creasy DM, Cottrell JS. Probability-based protein identification by searching sequence databases using mass spectrometry data. Electrophoresis. 1999;20:3551–67. doi: 10.1002/(SICI)1522-2683(19991201)20:18<3551::AID-ELPS3551>3.0.CO;2-2. [DOI] [PubMed] [Google Scholar]
- 10.Tabb DL, McDonald WH, Yates JR., 3rd DTASelect and Contrast: tools for assembling and comparing protein identifications from shotgun proteomics. J Proteome Res. 2002;1:21–6. doi: 10.1021/pr015504q. [DOI] [PMC free article] [PubMed] [Google Scholar]
- 11.Carvalho PC, Fischer JS, Xu T, Cociorva D, Balbuena TS, Valente RH, et al. Search engine processor: Filtering and organizing peptide spectrum matches. Proteomics. 2012;12:944–9. doi: 10.1002/pmic.201100529. [DOI] [PMC free article] [PubMed] [Google Scholar]
- 12.Elias JE, Gygi SP. Target-decoy search strategy for increased confidence in large-scale protein identifications by mass spectrometry. Nature methods. 2007;4:207–14. doi: 10.1038/nmeth1019. [DOI] [PubMed] [Google Scholar]
- 13.Nesvizhskii AI, Keller A, Kolker E, Aebersold R. A statistical model for identifying proteins by tandem mass spectrometry. Anal Chem. 2003;75:4646–58. doi: 10.1021/ac0341261. [DOI] [PubMed] [Google Scholar]
- 14.Feng J, Naiman DQ, Cooper B. Probability model for assessing proteins assembled from peptide sequences inferred from tandem mass spectrometry data. Anal Chem. 2007;79:3901–11. doi: 10.1021/ac070202e. [DOI] [PubMed] [Google Scholar]
- 15.Searle BC. Scaffold: a bioinformatic tool for validating MS/MS-based proteomic studies. Proteomics. 2010;10:1265–9. doi: 10.1002/pmic.200900437. [DOI] [PubMed] [Google Scholar]
- 16.Claassen M, Reiter L, Hengartner MO, Buhmann JM, Aebersold R. Generic Comparison of Protein Inference Engines. Mol Cell Proteomics. 2012:11. doi: 10.1074/mcp.O110.007088. [DOI] [PMC free article] [PubMed] [Google Scholar]
- 17.Gupta N, Pevzner PA. False Discovery Rates of Protein Identifications: A Strike against the Two-Peptide Rule. J Proteome Res. 2009;8:4173–81. doi: 10.1021/pr9004794. [DOI] [PMC free article] [PubMed] [Google Scholar]
- 18.Nesvizhskii AI, Keller A, Kolker E, Aebersold R. A statistical model for identifying proteins by tandem mass spectrometry. Anal Chem. 2003;75:4646–58. doi: 10.1021/ac0341261. [DOI] [PubMed] [Google Scholar]
- 19.Zhang B, Chambers MC, Tabb DL. Proteomic parsimony through bipartite graph analysis improves accuracy and transparency. J Proteome Res. 2007;6:3549–57. doi: 10.1021/pr070230d. [DOI] [PMC free article] [PubMed] [Google Scholar]
- 20.Meyer-Arendt K, Old WM, Houel S, Renganathan K, Eichelberger B, Resing KA, et al. IsoformResolver: A Peptide-Centric Algorithm for Protein Inference. J Proteome Res. 2011;10:3060–75. doi: 10.1021/pr200039p. [DOI] [PMC free article] [PubMed] [Google Scholar]
- 21.Weatherly DB, Atwood JA, 3rd, Minning TA, Cavola C, Tarleton RL, Orlando R. A Heuristic method for assigning a false-discovery rate for protein identifications from Mascot database search results. Mol Cell Proteomics. 2005;4:762–72. doi: 10.1074/mcp.M400215-MCP200. [DOI] [PubMed] [Google Scholar]
- 22.Bern M, Goldberg D. Improved ranking functions for protein and modification-site identifications. J Comput Biol. 2008;15:705–19. doi: 10.1089/cmb.2007.0119. [DOI] [PubMed] [Google Scholar]
- 23.Serang O, MacCoss MJ, Noble WS. Efficient marginalization to compute protein posterior probabilities from shotgun mass spectrometry data. J Proteome Res. 2010;9:5346–57. doi: 10.1021/pr100594k. [DOI] [PMC free article] [PubMed] [Google Scholar]
- 24.Keller A, Nesvizhskii AI, Kolker E, Aebersold R. Empirical statistical model to estimate the accuracy of peptide identifications made by MS/MS and database search. Anal Chem. 2002;74:5383–92. doi: 10.1021/ac025747h. [DOI] [PubMed] [Google Scholar]
- 25.Reiter L, Claassen M, Schrimpf SP, Jovanovic M, Schmidt A, Buhmann JM, et al. Protein Identification False Discovery Rates for Very Large Proteomics Data Sets Generated by Tandem Mass Spectrometry. Mol Cell Proteomics. 2009;8:2405–17. doi: 10.1074/mcp.M900317-MCP200. [DOI] [PMC free article] [PubMed] [Google Scholar]
- 26.Ma ZQ, Dasari S, Chambers MC, Litton MD, Sobecki SM, Zimmerman LJ, et al. IDPicker 2.0: Improved Protein Assembly with High Discrimination Peptide Identification Filtering. J Proteome Res. 2009;8:3872–81. doi: 10.1021/pr900360j. [DOI] [PMC free article] [PubMed] [Google Scholar]
- 27.McClatchy DB, Liao LJ, Lee JH, Park SK, Yates JR. Dynamics of Subcellular Proteomes During Brain Development. J Proteome Res. 2012;11:2467–79. doi: 10.1021/pr201176v. [DOI] [PMC free article] [PubMed] [Google Scholar]
- 28.TX, DVJ, DC, BL, LL, JW, et al. ProLuCID, a fast and sensitive tandem mass spectra-based protein identification program. Mol Cell Proteomics. 2006:5. [Google Scholar]
- 29.Tabb DL, McDonald WH, Yates JR., 3rd DTASelect and Contrast: tools for assembling and comparing protein identifications from shotgun proteomics. J Proteome Res. 2002;1:21–6. doi: 10.1021/pr015504q. [DOI] [PMC free article] [PubMed] [Google Scholar]
- 30.Nesvizhskii AI, Aebersold R. Interpretation of shotgun proteomic data: the protein inference problem. Mol Cell Proteomics. 2005;4:1419–40. doi: 10.1074/mcp.R500012-MCP200. [DOI] [PubMed] [Google Scholar]
- 31.Reiter L, Claassen M, Schrimpf SP, Jovanovic M, Schmidt A, Buhmann JM, et al. Protein identification false discovery rates for very large proteomics data sets generated by tandem mass spectrometry. Mol Cell Proteomics. 2009;8:2405–17. doi: 10.1074/mcp.M900317-MCP200. [DOI] [PMC free article] [PubMed] [Google Scholar]
- 32.Denny P, Hagen FK, Hardt M, Liao L, Yan W, Arellanno M, et al. The proteomes of human parotid and submandibular/sublingual gland salivas collected as the ductal secretions. J Proteome Res. 2008;7:1994–2006. doi: 10.1021/pr700764j. [DOI] [PMC free article] [PubMed] [Google Scholar]
- 33.Bern MW, Kil YJ. Two-dimensional target decoy strategy for shotgun proteomics. J Proteome Res. 2011;10:5296–301. doi: 10.1021/pr200780j. [DOI] [PMC free article] [PubMed] [Google Scholar]
- 34.Lu B, Xu T, Park SK, Yates JR., 3rd Shotgun protein identification and quantification by mass spectrometry. Methods in molecular biology. 2009;564:261–88. doi: 10.1007/978-1-60761-157-8_15. [DOI] [PubMed] [Google Scholar]
Associated Data
This section collects any data citations, data availability statements, or supplementary materials included in this article.