

Abstract
The migration of T-cell subsets within peripheral tissues is characteristic of inflammation and immunoregulation. In general, the lymphocyte migratory response is assumed directional and guided by local gradients of chemoattractants and/or chemorepellents. However, little is known about how cells explore their tissue environment, and whether lymphocyte activation may influence speed and exploratory patterns of migration. To probe migration patterns by T-cells we designed a microfluidic maze device that replicates critical features of a tissue-like microenvironment. We quantified the migration patterns of unstimulated and mitogen-activated human T-cells at single cell resolution and found significant differences in exploration within microfluidic mazes. While unstimulated lymphocytes migrated in a directed manner, activated T-cells migrated through large areas of the mazes in an exploratory pattern in response to the chemoattractants RANTES (CCL5) and IP-10 (CXCL10). The analysis of migration enabled by the microfluidic devices help develop new methods for determining how human circulating T-cells function in vivo to seek out antigens in health and disease states.
Graphical Abstract

Introduction
T-cells characteristically infiltrate peripheral tissues in the course of chronic inflammatory disease states 1, 2. In this manner, they orchestrate and contribute to the pathology of the underlying disease. CD4+ T-lymphocytes are a heterogeneous group of cells, consisting of naïve unactivated cells, as well as antigen-activated and previously activated subsets of cells. Some previously antigen-activated CD4+ T cell subsets differentiate into a memory phenotype. All of these subsets have differing phenotypes that include a wide variety in chemokine receptor expression 3–5. Two chemokines, named CCL5/RANTES and CXCL10/IP-10 are well established to be expressed in rejecting human cardiac 6 and renal 7, 8 allografts. In addition, CXCL10/IP-10 is now considered to be a reliable biomarker of evolving human allograft rejection 9. Receptors for these chemokines are also reported to be highly expressed on graft infiltrating T-lymphocytes 6 and thus it is suggested that these chemokines play an important role in orchestrating inflammatory responses, including T cell infiltration into allografts undergoing rejection 8–15. Despite the potential dynamic patterns of T cell migration and tissue infiltration, most inflammatory diseases are diagnosed by tissue biopsy and histological analysis. Histology, however only offers a single, static snapshot of the state of inflammation without accounting for the complex dynamics of leukocyte infiltration of tissues, e.g. chemoattraction and chemorepulsion migration as a component of pro-inflammation or pro-resolution processes 16, 17. Such dynamics are critical for the understanding of the evolution vs. the resolution of chronic inflammatory diseases including chronic transplant rejection following solid organ transplantation 17–19.
Current paradigms for T-cell recruitment into tissues focus exclusively on chemoattraction as the major mechanism for directing T-cell migration 7, 10, 20, 21. However, it increasingly appears that our understanding of the patterns of T-cell migration is incomplete. Furthermore, the biological basis for exploratory patterns of T cell migration as is seen in vivo 22 is relatively underexplored. Nevertheless, recent studies by our laboratory have revealed unique, unexpected characteristics of T-cell migration, including patterns that include frequent directional changes, chemoinhibition, chemorepulsion and low persistence migration 16. These collective and more complex migration patterns ultimately determine whether and how T-cells localize within a tissue.
New techniques including videomicroscopy of T-cell migration within lymph nodes 23 and other tissues 24 have confirmed the limitations of classical in vitro static assays and have begun to uncover the concept of exploratory lymphocyte migration patterns within tissues. However, in vivo assays are difficult to perform and have significant limitations in terms of resolution and feasibility. Early studies using microfluidics have attempted to characterize cellular migration in the presence of stable gradients, but were hampered by the presence of flow and the effect of shear stress 25. Nevertheless, the migration of T-cells within microscale channels can be measured in more detail and under controlled conditions that simulate the presence of chemical gradients and mechanical confinement conditions in tissues 16, 24. Several recently developed microfluidic tools to study cell chemotaxis have been applied to the study of T-cells migration. These have revealed that T cells have a complex migratory phenotype, which is challenging to quantify 16, 26–28. For example, T-cells were found to have a low persistence migration pattern in response to several chemokines, and we observed their ability to continuously change migratory direction both with 16 and without mechanical confinement 27. To study the frequent change in migratory direction, maze models have showed to be promising. For example, our group has developed microfluidic mazes that allow for the study of directional decision making 29 while others developed 3D maze models that focus on turning frequencies of cells 30. However, to enable more relevant measurements and more precise control of the microenvironment conditions during cell migration new microfluidic tools are needed that allow for a more straightforward analysis of more complex exploratory migration patterns of T-cells.
Here, we developed a microfluidic maze device with orthogonal arrays of channels and chemoattractant reservoirs to quantify the migration patterns of T-cells and elucidate the changes in exploratory and chemotactic migration patterns after mitogenic activation. Our studies identify novel but distinct exploratory patterns of migration among unstimulated and mitogen-activated populations of T-cells in response to the classical T cell chemoattractants RANTES (CCL5) and IP-10 (CXCL10).
Results
Device Validation, Chemokine Gradients, and Cell Tracking
We designed a microfluidic device that consist of orthogonal arrays of small channels, so that individual cells have equal potential to migrate in the x axis in a straightforward movement pattern and/or along the y axis in an exploratory pattern in response to an established chemoattractant. The majority of previous studies evaluating T cell migration ignored the concept that T cells may migrate in y plane and only evaluate directed movement towards a chemokine. This concept is important as current models suggest that after leaving the bloodstream, leukocytes simply enter the parenchyma and migrate through tissues in response to a gradient. Nevertheless, in vivo, it is characteristic that cells migrate diffusely throughout an inflamed tissue and thus the concept of exploratory patterns of migration has great physiological importance. Our maze design is a first step that allows for this analysis. To validate our maze device (Fig 1B), we first probed the formation of chemical gradients. Fluorescent red TRITC-Dextran (5μm, 10kDa, Sigma Chemical, St. Louis, MO) was loaded in the chemoattractant reservoir and the formation and maintenance of chemoattractant gradients were recorded by time-lapse microscopy (Fig. 1C). The molecular weight of TRITC-Dextran was comparable to that of the chemoattractants used in the study (CCL5/RANTES, MW 8kDa and CXCL10/IP-10, MW 10 kDa). The analysis of the profiles of fluorescent intensity across the maze confirmed the maintenance of chemoattractant gradients through the nodes of the mazes over the time course of 15 hours (Fig 1C). Along the x-plane there is a gradual increase of the chemokine concentration (Fig 1D) and the chemokine concentration along the y-plane represents a hyperbolic curve, with the highest concentrations in the centre (Fig 1E).
Figure 1. Lymphocyte migration in tissues and devices to quantify lymphocyte migration in vitro.

(A) T-cells often migrate through the parenchyma, confined by the extracellular spaces, toward areas of inflammation in tissues. Hypothetical trajectories of migration are represented by yellow lines. (B) A microfluidic device simulates the extracellular space in tissues as an orthogonal maze of channels with 50 μm pitch. A reservoir of chemoattractant and a cell loading chamber serve as source and sink, respectively, to create a chemical gradient across the maze. Several mazes were employed simultaneously in one device. (C) Enhanced microscopy image of the maze in the presence of a TRITC-Dextran gradient through the maze, at one hour after gradient formation between a reservoir to the right and the cell loading chamber to the left. Fluorescent activity of the TRITC dextran gradient is shown along the x (D) and y (E) plane of the maze. (F) To quantify the migration of lymphocytes through the maze, we manually tracked the cells locations. From these, cell tracks were automatically generated (i.e. dashed and dotted lines). We assigned different colours to different nodes in the maze depending on the number of cells passing through each node. Yellow colour denotes nodes that were traversed only once; red colour denotes heavily trafficked nodes, with multiple cells passing through; black colour denotes nodes in which cell migration was arrested.
To analyse the T-cell exploration of nodes within the maze, we manually tracked individual cells and formulated image processing codes and methods for quantitative analysis and comparison of the results. We assigned the location of each cell in each image to the nearest node in the maze. From the total number of cells visiting each node, we generated heat maps of node T-cells exploration. We assigned relative values to each node, between 0 and 1, in order to normalize all heat maps. We then employed a colour heat legend for comparisons between the different experimental conditions. We assigned a value of 0 and coloured blue the least traversed nodes. We assigned a value of 1 and coloured red the nodes traversed across all experimental conditions (Fig. 1F).
Migration Patterns of T-cells towards the chemoattractants CXCL10/IP-10 and CCL5/RANTES
We recorded and analyzed the trajectories of T-cells through the mazes using manual tracking of individual cells along with both qualitative and quantitative image analysis of node exploration (Fig. 2,3). Unstimulated T-cells (TUS) often migrated in longitudinal patterns across the maze towards the chemoattractant reservoirs containing either CXCL10/IP-10 (Fig. 2A) or CCL5/RANTES (Fig. 3A, Supplementary movie S1). After entrance from main channels of the devices into the mazes, these cells migrated most often straight towards chemoattractant reservoirs. In contrast, mitogen-activated T-cells (TMA) exhibited multi-directional exploratory patterns of migration after exposure to chemoattractant gradient conditions. These cells often migrated in directions orthogonal to the direction of the steepest chemoattractant gradient (Fig. 2B,3B, Supplementary movie S2, S3) We tracked a total of N=2460 T-cells in 520 mazes. We found that TMA cells visit the largest number of nodes in the presence of a CXCL10/IP-10 gradient (Fig. 2B). This was far greater than TUS cells that rarely migrated through the maze (Fig. 2A). In addition, we observed that the total number of cells entering the mazes was lower in devices where the concentration of CXCL10/IP-10 was uniform vs. devices presenting a gradient (489 versus 649 cells). There was also notable higher node coverage of TMA cells in response to uniform CXCL10/IP-10 (Fig. 2D) compared to TUS cells (Fig. 2C).
Figure 2. T-cell migration patterns inside the mazes in the presence of chemoattractant CXCL10/IP-10.

(A) Heat map compilation of the locations of unstimulated T-cells inside the maze in the presence of a gradient of chemoattractant IP-10. Colors range from blue (unvisited nodes of the maze, relative value 0) to red (most traversed nodes for all conditions, relative value 1 – see legend to the right). (B) Mitogen-activated T-cells in an CXCL10/IP-10 gradient move robustly through the mazes and the majority of nodes are visited repeatedly. (C) Unstimulated T-cells rarely enter the maze in uniform CXCL10/IP-10. (D) Mitogen-activated T-cells enter the mazes but most frequently traverse the nodes close to the entrance when a uniform CXCL10/IP-10 gradient is present. Locations in the mazes are represented in microns (X,Y coordinates on the side of the maze drawing), with the entrance to the maze at (0,0) and the chemoattractant reservoir at (0,800).
Figure 3. T-cell migration patterns inside the mazes in the presence of chemoattractant CCL5/RANTES.

(A) Unstimulated T-cells show robust migration through the maze in the presence of gradients of chemoattractant CCL5/RANTES. (B) Mitogen activated T-cells also migrate robustly in gradient CCL5/RANTES. (C) Unstimulated T-cells are dispersed through the maze in uniform concentrations of CCL5/RANTES. (D) Mitogen activated T-cells traverse most of the nodes of the maze in uniform concentrations of CCL5/RANTES. Colors code the relative number of cell visits for each node and range from blue (unvisited nodes of the maze, relative value 0) to red (most traversed nodes for all conditions, relative value 1 – see legend to the right). Locations in the maze are represented in microns (X,Y coordinates on the side of the maze drawing), with the entrance to the maze at (0,0) and the chemoattractant reservoir at (0,800).
In the presence of CCL5/RANTES gradients, again, there was quantitatively more maze nodal trafficking with TMA cells versus TUS cells (Fig. 3A,B) but overall this difference was less striking than that observed in response to CXCL10/IP-10. Nevertheless, similar to CXCL10/IP-10, these exploratory migration patterns were more pronounced for gradients of CCL5/RANTES than for uniform concentrations, for both unstimulated and mitogen-activated cells (Fig. 3C, D). Additionally, the total number of cells entering mazes primed with CCL5/RANTES was less in response to uniform concentrations of chemoattractant versus the gradient-based condition (333 versus 450 cells).
We compared the heat maps for CXCL10/IP10 and CCL5/RANTES and found consistent differences between chemoattractant gradient versus uniform chemoattractant conditions for both chemoattractants. The number of cells entering the mazes was higher in the presence of chemoattractant gradients than in uniform chemoattractant conditions, and maze exploration was higher for TMA compared to TUS cells, for both CCL5/RANTES and CXCL10/IP10. These differences are visible by the greater extent of blue coloration (no exploration) of the mazes in uniform chemoattractant conditions, as opposed to the yellow to red colours in the gradient based conditions (increased exploration).
In control experiments, lymphocytes migrated spontaneously in media alone, in the absence of a chemoattractant gradient. Under these conditions, we observed no difference between maze coverage consolidated images for TUS cells versus TMA cells. However, only a small numbers of cells entered devices (a total of 81 cells entered 52 mazes) in media alone. Collectively, these findings suggest that both chemoattractant gradients and mitogen-activation are necessary to enhance the migration of T-cells, and the two conditions have a cumulative effect on the T-cell exploration migration patterns.
Characteristics of Exploratory T-cell Migration
Quantitative analysis confirmed that TMA cells exhibited the highest area of maze coverage during migration in CXCL10/IP-10 gradients (Fig. 4A, p<0.05). This area of maze covered by migrating T-cells was higher in the gradient compared to uniform CXCL10/IP-10, and was higher for mitogen-activated compared to unstimulated cells. CCL5/RANTES gradient conditions demonstrated only a slight increase of maze node exploration by TMA cells versus TUS cells, a difference that was not significant (p>0.05). These results confirmed the qualitative patterns that were exhibited by their respective heat maps. Interestingly, when we normalized the results by the number of T-cells entering the mazes, the TUS cells in CXCL10/IP-10 gradients displayed the largest area of maze explored per individual cell (Fig. 4B). The area of coverage in chemoattractant-free, control experiments was minimal.
Figure 4. Quantification of T-cells migrating through the mazes in the presence of chemoattractants.
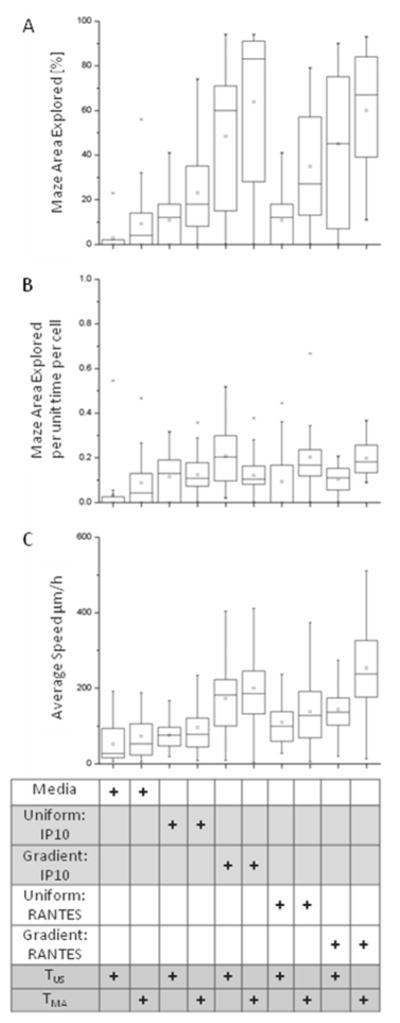
(A) The area of the maze explored by the moving T-cells increases with cell stimulation and the presence of guiding gradients of chemoattractant. Mitogen activated T-cells in CXCL10/IP-10 gradients exhibited the most exploratory behavior in comparison to unstimulated T-cells in CXCL10/IP-10 gradient. We measured no significant difference with respect to area of coverage between unstimulated and mitogen-activated T-cells in CCL5/RANTES. (B) The area of the maze explored, normalized by the number of cells and time, reveals that T-cells are most exploratory in the presence of CXCL10/IP-10 gradients. (C) The migration speed of the T-cells was the highest in mitogen-activated T-cells in gradients of CCL5/RANTES.
Analysis of cell migration speed through the mazes revealed that the fastest cells were the TMA cells in the presence of CCL5/RANTES gradients, up to 500 μm/hr (average ~250 μm/hr, Fig. 4C). This result was consistent with the larger area of maze explored by individual TMA compared to TUS cells in the presence of CCL5/RANTES gradients (Fig. 4B). We found comparable migration speed of TUS and TMA cells in all other conditions, including the uniform concentrations of CCL5/RANTES and uniform and gradient concentrations of IP-10 (Fig. 4B). The migration speed of both TMA and TUS cells was slower in uniform concentrations compared to gradients, for both IP-10 and CCL5/RANTES. In the absence of a chemoattractant, we found that both TMA and TUS cells migrated the slowest, at speeds below 100 μm/hr.
Discussion
We designed a microfluidic maze device to study how chemoattractants and the state of T-cell activation modulate their patterns of migration. A key feature of the maze device is the mechanical restriction of T-cell migration inside orthogonal arrays of small channels, with paths that run both along and perpendicular to the direction of gradients. This geometric maze design was intended to simulate some of the physiologic conditions that T-cells encounter in vivo when traversing peripheral tissues and entering areas of inflammation. The maze enables the analysis of exploratory patterns of lymphocyte migration including the quantification of the patterns of T-cell migration, the persistence of migration in response to the chemoattractant gradients, and the speed by which T-cells explore the maze. The maze is an artificial microenvironment, with tightly controlled geometrical and chemical features, designed to enable precise measurements of T-cell migration in conditions that are easy to replicate. The cross section of the channels is larger than the spacing in interstitial tissues 31, such that it allows the easy passage of T-cells. Previous work of our group showed that confinement of leukocytes does not alter their migration signatures, however it does increase the migratory persistence of cells and increases their migratory speed 16. Therefore we expect that the confinement used in our model allowed for faster exploration of the maze, but not in significant differences of the migratory patterns.
Our observations of migration patterns of T-cells raise the possibility that the exploration of tissues by moving lymphocytes is far more responsive to systemic and local cues than had been previously thought 12. Both CCL5/RANTES and CXCL10/IP-10 are well-established chemoattractants 9–11, 21, 32 and our data confirms that the presence of gradients causes the T-cells to explore larger areas of the maze than uniform concentration. We report here that activation generally increases the exploration, and has a larger impact in the presence of gradients of chemoattractants. These results are comparable with previous observations of migration patterns of T-cells in vivo 33. New findings include the increased exploration migration inside the mazes by activated T-cells and chemoattractant gradients. As compared to unstimulated T-cells, mitogen-activation generally leads to exploratory migration patterns, whereas the presence of gradients increases individual cell migration speed. Moreover, whereas the CCL5/RANTES appears to promote migration of activated T-cells to a greater extent than unstimulated T-cells, IP-10 has similar effects on both cell populations and even induces higher exploration behaviour in individual unstimulated vs. mitogen-activated T-cells.
It is possible that activated lymphocytes express multiple chemoattractant receptors and display complex responses relevant not only to migration towards tissues but also for microenvironment exploration. Since CXCL10/IP-10 and CCL5/RANTES are characteristically expressed in association with human allograft rejection 9, we speculate that the general physiological relevance of these exploring patterns is that alloantigen-activated cells that are typically recruited into an allograft, encounter chemokine(s) and start to explore the tissue. Additional activation as a consequence of interaction with antigen presenting cells within the foreign tissue further activates and/or sustains activation responses that in turn stimulate the cells to migrate throughout the inflamed and chemokine containing tissue. Under ‘normal’ physiological conditions this response is selected to destroy a foreign antigen such as an infectious agent, and the exploratory migratory pattern will allow T cells to seek out antigen in the course of a cell mediated local inflammatory response. It is also very likely that cells in vivo respond to sequential chemokine gradients that further enhance exploration. Additional studies need to be performed to further characterize this response as it is possible that dysfunctional ‘exploratory migratory patterns’ may lead to continued disease. Also we speculate that exploratory patterns may be a factor in the development of chronic inflammation. Our data in these experiments suggest that for a functional assay of the activation status of lymphocytes, it is not sufficient to index disease progression but rather that measurements of the exploratory patterning of T-cells can further indicate their biological effects in the course of a disease entity. If for instance, activated effector T-cells fail to traffic in typical patterns, then they are unlikely to promote disease. Furthermore, extensive exploratory patterning of activated immunoregulatory T-cells may provide a means to suppress inflammation in peripheral tissues 34. Such patterns cannot be captured using the traditional transwell assay, where only the final position of the cells is available. Such patterns could also not be captured for cells on flat surfaces (micropipette, most microfluidic experiments, etc) because their migration is significantly more random25. Even when the T-cells are confined in small channels35, which for example have been shown to rectify the migration of neutrophils towards chemoattractants, they display low persistence and frequent directional changes16. While the responses of unstimulated T-cells to uniform concentrations and gradients of chemoattractants CXCL10/IP10 and CCL5/RANTES are similar, the responses become distinct and higher for CXCL10/IP10 after mitogen-activation of T-cells.
Experimental
Microfluidic devices to analyze T-cell exploration patterns
We designed a microfluidic device to study T-cell migration patterns at the single cell level, toward soluble chemoattractants, through orthogonal arrays of small channels. Our device consists of a main channel for cell-loading with an array of 14 side channel mazes, each ending in reservoirs designed to maintain chemoattractant gradients over time. Each device also has an inlet and outlet, both of which were closed and secured by plastic tubing during time of video-microscopy experiments to prevent any fluid flow. In order to model the mechanical constraints during physiologic lymphocyte migration patterns in tissues, migrating lymphocytes were confined inside the 10 × 10 μm channels (cross-section). While the turns that moving cells could make were restricted within the nodes of the maze, the mazes enabled precise quantification of exploratory cell movement patterns. The size of each maze (600 μm by 800 μm) is such that we could observe multiple cells moving simultaneously through the mazes. The distance between nodes was calculated such that one image of a lymphocyte per pair of nodes was acquired for each lymphocyte (fastest lymphocyte migration speed ~600 μm/hour) at the required frequency of image acquisition to allow imaging of all mazes in one experiment (once every 10 minutes). For cells enter the mazes, the devices allow for the analysis of migration in the direction of the chemical gradients (along the X axis) as well as orthogonal exploration (along Y axis) and the analysis of the exploratory patterns of migration by individual as well as the entire subpopulation of responsive cells (by the number of nodes visited).
Standard microfabrication techniques were used to manufacture micro-fluidic devices. Two layers of photoresist (SU8, Microchem, Newton, MA), the first one 10 μm thin and second 50μm thick, were patterned onto a silicon wafer sequentially as per manufacturer’s instructions creating a “master” wafer. Patterned replicas were fabricated molding PDMS (Polydimethylsiloxane, Fisher Scientific, Fair Lawn, NJ), which were later bonded to standard glass slides (1×3 inches, Fisher Scientific) after treatment with air plasma (Nordson March XP250) similar to a previously described process36. Four to six microfluidic devices were placed per glass slide: a new microfluidic device was used for each experimental condition.
Separation of human T-cells
Venous blood samples were obtained from healthy volunteers under informed consent as approved by the IRB at Boston Children’s and Massachusetts General Hospital. Human peripheral blood mononucleocytes (PBMC) were isolated using Ficoll gradient centrifugation. CD3+ T-lymphocytes were isolated from PBMC by standard negative selection using the human Pan T cell Isolation Kit (Miltenyi Biotec, Auburn, CA) according to the manufacturer’s instructions. The purity of CD3+ population was analyzed by flow cytometry (Beckton Dickinson Analyzer, Franklin Lakes, NJ) with the FlowJo Software application (Tree Star, Inc, OR) and found to be better than 95%.
After isolation, T-cells were cultured at 37°C in 5% CO2 in RPMI 1640 media containing 10% fetal calf serum, 2mM L-glutamine, 100 U/ml penicillin/streptomycin (Gibco-Invitrogen, Carlsbad, CA). T-cells were cultured in the absence or presence of anti-CD3 and anti-CD28 antibodies (each at 1 μg/mL, BD Pharmingen, San Diego, CA) in 96 well cell culture plates for 48 hours prior to being added to the maze device. For the purpose of our studies we have used standard mitogen to activate pooled population of CD4+ T-cells, such that they undergo a uniform activation response that includes more homogenous chemokine receptor expression profiles within polyclonal populations of T-cells.
Device setup
The chemoattractants, recombinant human CCL5/RANTES (Biolegend, San Diego, CA) and CXCL10/IP-10 (R&D Systems, Minneapolis, MN), were diluted in cell culture media and fibronectin (120kDa, Sigma Aldrich, 1 μg/mL, 1:20 dilution) and used at 100 nM concentrations. The micro-fluidic devices were initially primed with either preparations of media or chemoattractant for 1 hour at room temperature. Overall, 10 experimental conditions were tested, and each condition repeated three times in independent experiments: unstimulated T-cells (TUS cells) and mitogen-activated T-cells (TMA cells) were placed in cell culture media without chemoattractant (control), uniform concentrations and gradients of CCL5/RANTES [100nM] or CXCL10/IP-10 [100nM].
For priming, the solutions were loaded under pressure from a 1 mL syringe, while the exit of the main channel was clamped, to allow filling of side channels and reservoirs with chemoattractants or media and push air out through the porous PDMS. To established chemoattractant gradients, after priming, the main channel was flushed with culture media. This procedure enables the formation of chemoattractant gradients extending from the main channel through mazes to the chemoattractant reservoirs. T-cells (either unstimulated or mitogen-activated) were washed and then infused into the main channel (~6×10³ T-cells/condition) and allowed to settle in the device at 37°C for a few minutes before imaging started. The entrance and exit ports were secured by clamping the inlet and outlet tubing, preventing any flow inside the main channel and ensuring gradual diffusion of chemoattractant into the maze. Time-lapse microscopy was performed on a fully automated Nikon TiE microscope with environmental chamber at 37 °C, 5% CO2 using NIS-Elements AR 3.10 software (Nikon Instruments Inc, Melville, NY). Images were acquired every 10 minutes for 15 hours, using a 10X objective.
Image Analysis
Cell tracking was performed manually using Image J software (NIH), which assigned colour tracks to each cell. Due to variations in the initial positioning of the devices and slow mechanical drift with time of the microscope stage, the position and orientation of each maze varied from image to image. To allow comparisons across different mazes and experimental conditions, we computed the location of the maze for each image (at time t=0) and transformed the cell positions into normalized coordinates. For each subsequent image, a gradient-based method was used to compute the relative displacement in each region 37. Prior to analysis, images were also normalized to the same average brightness to reduce the effect of slow changes in illumination conditions. The displacements for all regions at a given time were combined to find the best-fit translation and rotation by a least-squares scheme.
Data Analysis
On the aligned and normalized images of each maze, the positions of each cell were recorded relative to the entrance of the maze (0,0 coordinates in the X,Y system), and at each time step, over the 15 hour experimental period. These positions were then quantized to the nearest node of the maze. From these points, we built “probability maps” to quantify cellular trafficking across each branch and nearest nodes in the maze. Given the nodes for a cell at two sequential times, we calculated the number additional nodes visited when travelling along the shortest paths between these nodes. From these nodal maps, we generated “heat maps” in MATLAB (MathWorks, Natick, MA) in order to provide analysis of node passage by the T-cells (and thereby area of maze coverage) in each experimental condition. For example, if a cell migrated between two nodes horizontally and two vertically in the time interval between two sequential images, we considered six shortest paths. We estimated the probability of a visit for each of the additional seven nodes on each path from the number of paths passing through each of the nodes. With this approach, nodes of the maze that are part of multiple paths were marked as more likely to have been visited. We then computed the probability for node of the maze from all the probabilities for all cells at all times and normalized by the number of cells. The resulting probability reflects, over the course of one experiment, how likely a given cell in the maze is to traverse that node at some point. Because of the methods of calculating the visited nodes, this approach tends to smear out the probabilities somewhat, and the actual differences between experimental conditions are likely to be starker than represented here. Additional analysis (i.e. speed calculations of T-cells) for control and experimental conditions were also performed in MATLAB.
Conclusions
A microfluidic device allows for the analysis of T-cell migration patterns, with single cell resolution. This analysis could help understand whether the patterns of T-cell migration have implications for the development or resolution of disease processes. The study of T-cell exploratory migration patterns will help in the development of novel agents as future anti-inflammatory therapeutics.
Supplementary Material
Unstimulated T-cells (TUS) moving along straight paths in CCL5/RANTES gradient [0 to 100nM].
Mitogen-activated T-cells (TMA) display exploratory patterns in CCL5/RANTES gradient [0 to 100nM].
Mitogen-activated T-cells (TMA) exploring the maze in response to a gradient of CXCL10/IP-10 [0 to 100nM].
Innovation, Integration, Impact.
We designed a microfluidic device to quantify exploratory patterns of T-cell migration through mazes by chemoattractants. We identified distinct exploratory patterns of migration among populations of unstimulated and mitogen-activated T-cells, in response to CCL5 and CXCL10 chemoattractants. Analysis of lymphocyte migratory patterns through mazes may serve as an index of lymphocyte activation and/or response to therapy, for example in patients with chronic infections or transplant rejection.
Acknowledgments
We thank Sarah Bruneau and Megan McGourty for support in the isolation of T-cells, FACS analysis and cell culture and Dr. Ian Y. Wong for stimulating discussions. Microfabrication was performed at the BioMEMS Resource Center EB002503. This study was supported by National Institutes of Health (NIH) Grants GM092804 (to DI) and by AI092305 (to DMB). NGJ received funding from NIH T32 grant T32DK07726.
Notes and references
- 1.Mueller SN. Immunol Cell Biol. 2013;91:290–296. doi: 10.1038/icb.2012.75. [DOI] [PubMed] [Google Scholar]
- 2.Robson AW. British medical journal. 1906;1:601–605. doi: 10.1136/bmj.1.2359.601. [DOI] [PMC free article] [PubMed] [Google Scholar]
- 3.Woodland DL, Dutton RW. Curr Opin Immunol. 2003;15:336–342. doi: 10.1016/s0952-7915(03)00037-2. [DOI] [PubMed] [Google Scholar]
- 4.Cyster JG. Annu Rev Immunol. 2005;23:127–159. doi: 10.1146/annurev.immunol.23.021704.115628. [DOI] [PubMed] [Google Scholar]
- 5.Bonecchi R, Bianchi G, Bordignon PP, D’Ambrosio D, Lang R, Borsatti A, Sozzani S, Allavena P, Gray PA, Mantovani A, Sinigaglia F. J Exp Med. 1998;187:129–134. doi: 10.1084/jem.187.1.129. [DOI] [PMC free article] [PubMed] [Google Scholar]
- 6.Melter M, Exeni A, Reinders ME, Fang JC, McMahon G, Ganz P, Hancock WW, Briscoe DM. Circulation. 2001;104:2558–2564. doi: 10.1161/hc4601.098010. [DOI] [PubMed] [Google Scholar]
- 7.Pattison J, Nelson PJ, Huie P, von Leuttichau I, Farshid G, Sibley RK, Krensky AM. Lancet. 1994;343:209–211. doi: 10.1016/s0140-6736(94)90992-x. [DOI] [PubMed] [Google Scholar]
- 8.Krensky AM, Ahn YT. Nat Clin Pract Nephrol. 2007;3:164–170. doi: 10.1038/ncpneph0418. [DOI] [PMC free article] [PubMed] [Google Scholar]
- 9.Suthanthiran M, Schwartz JE, Ding R, Abecassis M, Dadhania D, Samstein B, Knechtle SJ, Friedewald J, Becker YT, Sharma VK, Williams NM, Chang CS, Hoang C, Muthukumar T, August P, Keslar KS, Fairchild RL, Hricik DE, Heeger PS, Han L, Liu J, Riggs M, Ikle DN, Bridges ND, Shaked A I Clinical Trials in Organ Transplantation 04 Study. The New England journal of medicine. 2013;369:20–31. doi: 10.1056/NEJMoa1215555. [DOI] [PMC free article] [PubMed] [Google Scholar]
- 10.Panzer U, Reinking RR, Steinmetz OM, Zahner G, Sudbeck U, Fehr S, Pfalzer B, Schneider A, Thaiss F, Mack M, Conrad S, Huland H, Helmchen U, Stahl RA. Transplantation. 2004;78:1341–1350. doi: 10.1097/01.tp.0000140483.59664.64. [DOI] [PubMed] [Google Scholar]
- 11.Baggiolini M. Nature. 1998;392:565–568. doi: 10.1038/33340. [DOI] [PubMed] [Google Scholar]
- 12.Melter M, McMahon G, Fang J, Ganz P, Briscoe DM. Pediatr Transplant. 1999;3:10–21. doi: 10.1034/j.1399-3046.1999.00023.x. [DOI] [PubMed] [Google Scholar]
- 13.Hancock WW, Lu B, Gao W, Csizmadia V, Faia K, King JA, Smiley ST, Ling M, Gerard NP, Gerard C. The Journal of experimental medicine. 2000;192:1515–1520. doi: 10.1084/jem.192.10.1515. [DOI] [PMC free article] [PubMed] [Google Scholar]
- 14.Hancock WW, Gao W, Csizmadia V, Faia KL, Shemmeri N, Luster AD. J Exp Med. 2001;193:975–980. doi: 10.1084/jem.193.8.975. [DOI] [PMC free article] [PubMed] [Google Scholar]
- 15.Fahmy NM, Yamani MH, Starling RC, Ratliff NB, Young JB, McCarthy PM, Feng J, Novick AC, Fairchild RL. Transplantation. 2003;75:2044–2047. doi: 10.1097/01.TP.0000069601.73079.94. [DOI] [PubMed] [Google Scholar]
- 16.Boneschansker L, Yan J, Wong E, Briscoe DM, Irimia D. Nature communications. 2014;5:4787. doi: 10.1038/ncomms5787. [DOI] [PMC free article] [PubMed] [Google Scholar]
- 17.Recchiuti A, Serhan CN. Front Immunol. 2012;3:298. doi: 10.3389/fimmu.2012.00298. [DOI] [PMC free article] [PubMed] [Google Scholar]
- 18.Chapman LE, Folks TM, Salomon DR, Patterson AP, Eggerman TE, Noguchi PD. The New England journal of medicine. 1995;333:1498–1501. doi: 10.1056/NEJM199511303332211. [DOI] [PubMed] [Google Scholar]
- 19.Nankivell BJ, Alexander SI. The New England journal of medicine. 2010;363:1451–1462. doi: 10.1056/NEJMra0902927. [DOI] [PubMed] [Google Scholar]
- 20.Agostini C, Calabrese F, Rea F, Facco M, Tosoni A, Loy M, Binotto G, Valente M, Trentin L, Semenzato G. The American journal of pathology. 2001;158:1703–1711. doi: 10.1016/S0002-9440(10)64126-0. [DOI] [PMC free article] [PubMed] [Google Scholar]
- 21.Lazzeri E, Rotondi M, Mazzinghi B, Lasagni L, Buonamano A, Rosati A, Pradella F, Fossombroni V, La Villa G, Gacci M, Bertoni E, Serio M, Salvadori M, Romagnani P. Transplantation. 2005;79:1215–1220. doi: 10.1097/01.tp.0000160759.85080.2e. [DOI] [PubMed] [Google Scholar]
- 22.Henrickson SE, Mempel TR, Mazo IB, Liu B, Artyomov MN, Zheng H, Peixoto A, Flynn MP, Senman B, Junt T, Wong HC, Chakraborty AK, von Andrian UH. Nat Immunol. 2008;9:282–291. doi: 10.1038/ni1559. [DOI] [PMC free article] [PubMed] [Google Scholar]
- 23.Halin C, Mora JR, Sumen C, von Andrian UH. Annual review of cell and developmental biology. 2005;21:581–603. doi: 10.1146/annurev.cellbio.21.122303.133159. [DOI] [PubMed] [Google Scholar]
- 24.Gebhardt T, Whitney PG, Zaid A, Mackay LK, Brooks AG, Heath WR, Carbone FR, Mueller SN. Nature. 2011;477:216–219. doi: 10.1038/nature10339. [DOI] [PubMed] [Google Scholar]
- 25.Lin F, Butcher EC. Lab on a chip. 2006;6:1462–1469. doi: 10.1039/b607071j. [DOI] [PubMed] [Google Scholar]
- 26.Hoerning A, Koss K, Datta D, Boneschansker L, Jones CN, Wong IY, Irimia D, Calzadilla K, Benitez F, Hoyer PF, Harmon WE, Briscoe DM. Eur J Immunol. 2011;41:2291–2302. doi: 10.1002/eji.201041095. [DOI] [PMC free article] [PubMed] [Google Scholar]
- 27.Nandagopal S, Wu D, Lin F. PLoS One. 2011;6:e18183. doi: 10.1371/journal.pone.0018183. [DOI] [PMC free article] [PubMed] [Google Scholar]
- 28.Wu J, Wu X, Lin F. Lab Chip. 2013;13:2484–2499. doi: 10.1039/c3lc50415h. [DOI] [PubMed] [Google Scholar]
- 29.Ambravaneswaran V, Wong IY, Aranyosi AJ, Toner M, Irimia D. Integrative biology : quantitative biosciences from nano to macro. 2010;2:639–647. doi: 10.1039/c0ib00011f. [DOI] [PMC free article] [PubMed] [Google Scholar]
- 30.Olsen MH, Hjorto GM, Hansen M, Met O, Svane IM, Larsen NB. Lab Chip. 2013;13:4800–4809. doi: 10.1039/c3lc50930c. [DOI] [PubMed] [Google Scholar]
- 31.Wolf K, Te Lindert M, Krause M, Alexander S, Te Riet J, Willis AL, Hoffman RM, Figdor CG, Weiss SJ, Friedl P. J Cell Biol. 2013;201:1069–1084. doi: 10.1083/jcb.201210152. [DOI] [PMC free article] [PubMed] [Google Scholar]
- 32.Nelson PJ, Krensky AM. Immunity. 2001;14:377–386. doi: 10.1016/s1074-7613(01)00118-2. [DOI] [PubMed] [Google Scholar]
- 33.Herz J, Paterka M, Niesner RA, Brandt AU, Siffrin V, Leuenberger T, Birkenstock J, Mossakowski A, Glumm R, Zipp F, Radbruch H. Journal of neuroinflammation. 2011;8:131. doi: 10.1186/1742-2094-8-131. [DOI] [PMC free article] [PubMed] [Google Scholar]
- 34.Muthukumar T, Dadhania D, Ding R, Snopkowski C, Naqvi R, Lee JB, Hartono C, Li B, Sharma VK, Seshan SV, Kapur S, Hancock WW, Schwartz JE, Suthanthiran M. The New England journal of medicine. 2005;353:2342–2351. doi: 10.1056/NEJMoa051907. [DOI] [PubMed] [Google Scholar]
- 35.Irimia D. Methods in cell biology. 2014;121:141–153. doi: 10.1016/B978-0-12-800281-0.00010-5. [DOI] [PMC free article] [PubMed] [Google Scholar]
- 36.Butler KL, Ambravaneswaran V, Agrawal N, Bilodeau M, Toner M, Tompkins RG, Fagan S, Irimia D. PloS one. 2010;5:e11921. doi: 10.1371/journal.pone.0011921. [DOI] [PMC free article] [PubMed] [Google Scholar]
- 37.Horn BK, Weldon EJ. IEEE transactions on pattern analysis and machine intelligence. 1986;8:665–668. doi: 10.1109/tpami.1986.4767839. [DOI] [PubMed] [Google Scholar]
Associated Data
This section collects any data citations, data availability statements, or supplementary materials included in this article.
Supplementary Materials
Unstimulated T-cells (TUS) moving along straight paths in CCL5/RANTES gradient [0 to 100nM].
Mitogen-activated T-cells (TMA) display exploratory patterns in CCL5/RANTES gradient [0 to 100nM].
Mitogen-activated T-cells (TMA) exploring the maze in response to a gradient of CXCL10/IP-10 [0 to 100nM].