Summary
Objective
The aim of this study was to develop a theoretic analysis of the cepstral peak, to compare several cepstral peak software programs, and to propose methods for reducing variability in cepstral peak estimation.
Study Design
Descriptive, experimental study.
Methods
The theoretic cepstral peak value of a pulse train was derived and compared to estimates computed for pulse train WAV files using available cepstral peak software programs: 1) Hillenbrand’s cepstral peak prominence (CPP) software, 2) KayPENTAX Multi-Speech implementation of CPP, and 3) a MATLAB implementation using cepstral interpolation. Cepstral peak variation was also investigated for synthetic breathy vowels.
Results
For pulse trains with period T samples, the theoretic cepstral peak is 1/2+ε/T, |ε|<0.1 for all pulse trains (ε=0 for integer T). For fundamental frequencies between 70 and 230 Hz, cepstral peak mean ± st. dev. was 0.496±0.002 using cepstral interpolation and 0.29±0.03 using Hillenbrand’s software, whereas CPP was 35.0±3.8 dB using Hillenbrand’s software and 20.5±2.7 dB using KayPENTAX’s software. CP and CPP vs. signal-to-noise ratio for synthetic breathy vowels were fit to a logistic model for the Hillenbrand (R2 = 0.92) and KayPENTAX (R2 = 0.82) estimators as well as an ideal estimator (R2 = 0.98) which used a period-synchronous analysis.
Conclusions
The findings indicate that several variables unrelated to the signal itself impact cepstral peak values, with some factors introducing large variability in cepstral peak values that would otherwise be attributed to the signal (e.g., voice quality). Variability may be reduced by using a period-synchronous analysis with Hann windows.
INTRODUCTION
Clinical use of voice quality measures has increased with the availability of software programs for automated or semi-automated voice quality assessment. Popular programs such as the Analysis of Dysphonia in Speech and Voice module [1] of Multi-Speech from KayPENTAX and Hillenbrand’s cpps.exe [2] have automated the measurement of cepstral peak prominence (CPP) which, along with the success of CPP in voice quality research compared to other acoustic measures [3], have made CPP a popular metric for quantifying voice quality in clinical settings. A typical use may require comparison of CPP before and after laryngeal surgery or voice therapy, with a change in CPP being indicative of the treatment outcome. However, other factors also affect CPP measurements which may confound the effects of treatment, including signal characteristics like fundamental frequency (F0) as well as CPP estimation parameters like analysis window length and type [4, 5, 6]. The current work investigated the sensitivities of the cepstral peak (CP) and CPP to signal characteristics and software settings in a series of experiments using synthesized signals, which provided complete control over the signal characteristics. The current work includes derivation of the expected CP value of a periodic signal, against which estimates from various software programs may be compared.
The Cepstrum and Cepstral Peak
The cepstrum, first described as the power spectrum of the log power spectrum of a signal [7], has a long history in speech signal processing. The cepstrum was first applied to speech signals to detect the fundamental frequency of speech [8]: a windowed signal of speech was first Fourier transformed to the frequency domain, and then the magnitude spectrum was log-compressed and Fourier transformed to the quefrency domain (a play on the word “frequency” to denote frequency of components within the log power spectrum) to form the cepstrum (“spectrum”) of the signal. If the windowed signal contained a periodic component of speech, the cepstrum included a narrow pulse, referred to as the dominant rahmonic (“harmonic”), centered at the fundamental period of the periodic component. The height of the pulse was called the cepstral peak (CP). The presence/absence of the pulse was used as a pitch detector by comparing CP to a threshold, and the quefrency of the pulse was used to estimate fundamental frequency.
Another application of the cepstrum was in separating the source from the filter when considering the source-filter theory of speech production which models speech as the filtering of a source signal by a vocal tract transfer function. Noll [8] noted that the log operation in the cepstrum algorithm conveniently transforms the multiplication of source and filter spectra into addition of their log spectra. The vocal tract log spectral magnitude varies slowly across frequency and affects the low-quefrency region of the cepstrum, while the periodic source log spectral magnitude varies more rapidly across frequency and affects the high-quefrency region of the cepstrum. Thus, the characteristics of the source and vocal tract may be further processed with little influence from each other by processing in the cepstral domain. Oppenheim [9] described the cepstral transformation of source-filter convolution to log spectra addition within the framework of homomorphic filtering and manipulated the source cepstrum in a speech synthesis application.
Voice Quality Assessment
The ability to separate the source and vocal tract components of a speech signal has made cepstral analysis useful in the study of source characteristics and vocal pathologies. The cepstrum and comb filtering were used to separate harmonic energy and noise energy in a noisy periodic signal to estimate the harmonic-to-noise ratio (HNR) as a voice quality measure [10]. By comb filtering in the cepstral domain, harmonic energy was measured with little influence from the vocal tract and noise spectra. Accuracy of the HNR estimates was quantified using speech-like synthetic signals with known levels of noise, and HNR varied by about 15 dB for a given noise level across the range of fundamental frequencies tested (80–296 Hz), indicating the degree of sensitivity of cepstrum estimation to fundamental frequency and other estimator parameters. CP was highly negatively correlated with severity rating of hoarseness in pathological voices measured from sustained vowels [11] and was the most predictive acoustic measure of hoarseness rating among the tested measures. Hillenbrand et al. [12] measured CP of breathy sustained vowels and introduced a normalized variant called cepstral peak prominence (CPP) that was highly negatively correlated with breathy ratings. To calculate CPP, a linear regression trend of the cepstrum (in dB) was calculated in a range of quefrencies around the CP, and the difference between CP and the regression line at the quefrency of the CP was defined as the CPP. The normalization accounted for scaling issues of the cepstrum due to implementation factors (e.g., window type and length, fast Fourier transform size) and, to a lesser degree, the effects of the vocal tract and noise spectra on CP. The correlation of breathy rating and CPP was −0.92, indicating that as breathiness increased, CPP decreased. Hillenbrand and Houde [13] introduced smoothing to CPP which averaged the cepstrum across time and quefrency. CPP calculated from the smoothed cepstrum was called CPP-smoothed (CPPS) and further reduced variation in CPP. In an experiment using natural dysphonic sustained vowels, correlation of breathy rating and CPP was −0.89 compared to −0.96 for CPPS.
CPP and its variants have become popular acoustic measures of voice quality due to their high correlation with perceptual ratings of dysphonia [14] and discriminability between normal and disordered voices [15]. CPP was shown to be highly correlated with overall severity of dysphonia [16], breathiness [17], and roughness [18]. CPP was highly correlated with voice quality ratings of both sustained vowels and read sentence material [1, 19, 20]. Awan [21] modified CPP by replacing the difference between CP in dB and the expected cepstral value from the normalizing linear regression function with the ratio of those terms, called CPP/EXP, and the modified measure was shown to discriminate between normal and dysphonic voices but not among individual dysphonic voice qualities (i.e., breathy, rough, and hoarse). More recently, CPP was shown to correlate with breathiness generated by a kinematic speech synthesizer [22] and with glottal area measurements taken from high-speed videoendoscopy [23], and CPP was highly correlated with GRBAS ratings from Portuguese sentence material [24]. A meta-analysis of overall voice quality rating found CPP to be the highest correlated measure for read sentence material among 26 acoustic measures [3].
In summary, cepstral analysis conveniently isolates the speech source from the vocal tract without the need to directly estimate characteristics of the vocal tract, and CPP is a measure of CP of the dominant rahmonic that 1) accounts for scaling of CP due to some algorithm parameters, and 2) correlates highly with some voice quality ratings (for overall severity and breathiness and, to a lesser extent, roughness). CP as a signal property is unlike other properties like intensity or fundamental frequency in that the quantity of CP is not a readily identifiable attribute of the signal. Intensity is the root-mean-square value of a signal and is correlated with its loudness, and fundamental frequency is the inverse of the longest period of a signal that repeats and is correlated with its pitch. CP, on the other hand, appears to be related to the degree of periodicity and the perception of voice quality. However, the relationships among signal property, acoustic measure, and perception are not as well established as they are for other signal properties and have not received sufficient theoretic treatment.
Purpose
The purpose of the current study was to establish a theoretic expected value of CP for periodic signals, with the broader goal of understanding the factors that influence CP calculations for dysphonic voices. With an established CP expected value, the effects of estimation algorithm parameters (e.g., window size and type, frequency resolution) and signal properties on CP may be investigated, and the variability of CP estimates may be quantified for different implementations. To date, variation in CP and CPP has been compared to variation in voice quality ratings through correlation measures, yet the effects of algorithm parameters and signal properties like fundamental frequency on accuracy have not been previously reported. Identifying and isolating the variation of CP due to implementation factors is important because by doing so, the remaining variation of CP is better explained by other factors of interest such as degree of dysphonia, response to treatment, and changes to voice quality over time.
Variations in CP and CPP were investigated in three experiments using two popular cepstral software programs and a custom cepstrum implementation which allowed us to test various implementation details for comparison with the other software programs. In the first experiment, the expected CP value was derived for the most fundamental periodic signal, the ideal pulse train, and compared to CP measurements of pulse train WAV files over a range of fundamental frequencies. In the second experiment, the effects of noise on cepstral peak and cepstral F0 estimation were demonstrated. White noise was added to the pulse trains at select fundamental frequencies to simulate breathiness. In the third experiment, the effects of noise and amplitude variation on CP estimation were quantified. Pulse trains over a broad range of F0s were modified by filtering the signals with all-pole vocal tract models of sustained vowels, giving the periodic signals more speech-like qualities, and by adding white noise to simulate breathiness. CP and CPP were regressed against signal-to-noise ratio using a logistic model which allowed us to quantify the variability of CP and CPP to vowel and fundamental frequency among the various cepstrum estimators. The results of the current study are followed by comments on unexplored factors that affect the cepstrum and CP and on extending the theoretic framework to a broader class of periodic signals.
METHODS
Expected Cepstral Peak
To derive the cepstral peak value of a period signal, consider the most basic periodic signal: the pulse train. A pulse train contains pulses that are regularly spaced in time by the fundamental period of the signal, with at least 2 pulses necessary to determine the fundamental period. For the specific case in which the fundamental period is an integer number of samples, the pulse train is a periodic signal with a value of one at the onset of each period and zero values for all other samples within a period. For the more general case, the pulses within the train may be modeled with sinc functions [25]. Any periodic signal x(n) may be considered the output of a linear system whose impulse response contributes to the shape of one period of x(n) and whose input is a pulse train with the same fundamental period as x(n). For speech, the pulse train may be considered the input to a glottal function which outputs a glottal excitation waveform, which in turn is the input to a vocal tract function which outputs a speech waveform according to the source-filter model of speech production [26, 27].
For a pulse train with a fundamental period of T samples and M pulses, the cepstral peak is the following (see Appendix for details):
where ε(T, M) is an error function of T and M that is (empirically) < 0.1 in magnitude for all T and M. For integer T, ε(T, M) = 0, and CP = 1/2 for all pulse trains with at least 2 pulses. These results are the first to quantify the cepstral peak for a periodic signal and provide a benchmark against which we may compare the output of real CP estimators. To put the deviation of CP from 1/2 for real T in perspective, consider a practical example. For data sampled at 16 kHz, a pulse train with fundamental frequency F0 = 100.2 Hz and M = 10 pulses has a duration ≈ 100 ms and fundamental period T = 159.68 samples. The error function ε(159.68,10) = −0.0039, and CP is below 1/2 by 0.01%. As shown in the subsequent experiments, there are several factors that affect CP variation to a much greater degree than the error function ε(T, M).
Cepstral Peak Estimators
Two popular cepstrum software packages were evaluated in the experiments: cpps.exe [2, 13] and the Analysis of Dysphonia in Speech and Voice module [1] of Multi-Speech from KayPENTAX (Montvale, NJ 07645, version 3.4.2). In both estimators, spectral estimates were made using a Hamming window and the fast Fourier transform (FFT) without zero padding. The software programs were compared to a custom cepstral peak estimator implemented in MATLAB (The Mathworks, Natick, MA, version R2014a) which was based on the discrete Fourier transform implementation of the cepstrum [25] (see Appendix for details). By implementing a custom cepstral peak estimator, we were able to manipulate details of the algorithm (e.g., window type, FFT and inverse FFT zero padding) to investigate their effects on CP variation. While zero padding the FFT does not increase spectral resolution (i.e., the ability to resolve two tones close in frequency), zero padding does produce a spectrum with finer frequency sampling that better represents details of not only the peaks of a harmonic signal but also the inter-peak valleys which have been shown to be related to amplitude of the dominant rahmonic [5]. Using zero padding for cepstral estimation also reduces aliasing in the cepstrum [25] which wraps high quefrency cepstral energy to low quefrency regions of the cepstrum. The custom cepstrum estimator also used a zero padded inverse FFT which had the effect of producing an interpolated cepstrum with sub-quefrency resolution.
Experiment 1: Pulse Trains
The cepstral peak estimators were evaluated using pulse train WAV files of 10 seconds in duration with 22050 Hz sampling rate and 16-bit resolution, generated in MATLAB. The sampling rate was chosen to accommodate the choice built into the KayPENTAX software. Fundamental frequencies of the pulse trains spanned the range 70–230 Hz in 1-Hz increments which allowed us to investigate the sensitivity of CP estimation to fundamental frequency. Cepstral peak was estimated from windows with duration of 46.44 ms (1024 samples) and window shift of 4.6 ms (101 samples, 90% overlap). The short window shift allowed examination of the effect of window phase on cepstral peak estimation. The fundamental frequency of the dominant rahmonic was searched over the range 50–300 Hz.
The Hillenbrand estimator output CP and CPP, both in dB. Estimates of CP were converted to cepstral magnitude using the following transform:
where CP is the cepstral peak magnitude, CPdB is the cepstral peak in dB, and N is the FFT size. The following algorithm parameters were applied: FFT size = 1024 samples, the “all voice” flag was enabled, and the temporal and cepstral averaging parameters were Tav = Bav = 1, respectively. Setting the averaging parameters to unity disabled CPP smoothing and allowed for direct comparison with the other estimators which did not employ averaging. The software program cpps.exe was called from a MATLAB script which processed all WAV files as a batch. The output from cpps.exe was a text file, one for each WAV file, and the set of text files was processed by a MATLAB script for analysis.
The KayPENTAX estimator output only CPP values which were not directly comparable to the CP expected value. However, the KayPENTAX CPP values were comparable to Hillenbrand CPP values. The following algorithm parameters were applied: FFT size = 1024, CPP threshold = 0 dB, “Resample to 25 kHz” was disabled, “Apply vocalic event detection” was disabled, cepstral time average = 0 to disable cepstral smoothing, and the maximum frequency for estimating the normalization regression line for CPP was 10 kHz. The WAV files were processed by the KayPENTAX software in batch mode. As with the Hillenbrand software, the output of the KayPENTAX software was a text file, one for each WAV file, and the set of text files was processed by a MATLAB script for analysis.
The interpolated cepstrum estimator output CP magnitude values. The following algorithm parameters were applied: rectangular analysis window, FFT size = 8192, cepstrum interpolation factor K = 8, and a floor function threshold of 200 dB below the peak of the log spectrum was applied to avoid log-zero singularities. The Hillenbrand and KayPENTAX estimators did not employ zero padding, while the interpolated cepstrum estimator used a zero-padded FFT of 8 times the analysis window length and a zero-padded inverse FFT of 64 times the window length. As stated above, the purpose of zero padding the FFT and inverse FFT was to reduce cepstral aliasing and to increase resolution of the cepstral peak both in magnitude and in quefrency of the peak.
Experiment 2: Noisy Pulse Trains
The effect of additive white noise on CP estimation was investigated at 3 fundamental frequencies: 90 Hz, 147 Hz, and 215 Hz. The frequencies were selected such that they spanned a wide range of typical fundamental frequencies of speech. A pulse train of 10 seconds in duration was created for each fundamental frequency, and white noise was scaled to the desired signal-to-noise ratio (SNR) and added to the pulse train. The resulting vector was written to a WAV file with 22050 Hz sampling rate and 16 bits resolution. SNR varied from −30 dB to 50 dB in 5 dB steps. For SNR < −10 dB, the noisy pulse train was scaled down by 20 dB to avoid WAV file amplitude clipping. The WAV files were processed for cepstral peak and fundamental frequency estimates using the same methods that were used in the noise-free experiment.
Experiment 3: Noisy Vocal Tract Model Signals
The pulse trains in the above experiments were expanded to represent a wider class of speech-like periodic signals by generating synthesized breathy sustained vowels. Synthetic vowels were used so as to control the parameters of the periodic signal: fundamental frequency, periodicity, SNR, duration, and vocal tract transfer function. Vocal tract models were created for three sustained vowels (\i\, \a\, \u\) using linear prediction coding (LPC) [28, 29]. The vowels were uttered by a male talker and digitized to WAV files at 22050 Hz sampling rate and 16-bit amplitude resolution. Linear prediction coefficients were estimated from the vowel WAV files using the MATLAB function lpc in the Signal Processing Toolbox version 6.21 (R2014a). A total of 14 coefficients for each vowel were used in the vocal tract models. Table 1 lists the formant frequencies and amplitudes of the synthetic vowels. Pulse trains were generated using the same procedure in the above experiments with F0 between 70–230 Hz in 5-Hz increments, and synthetic vowels were generated by filtering the pulse trains with the LPC vocal tract models. Signals of 1 second duration were extracted from the filter output (ignoring filter transients). To simulate breathiness, white noise was added to the vowel signals at a specified SNR. The noisy signals were written to WAV files at 22050 Hz sampling rate and 16-bit amplitude resolution for analysis by the cepstrum software programs. SNR varied from −20 to 120 dB in 5-dB steps (the high SNR was necessary to accommodate the sensitivity of some of the cepstrum estimators to noise level).
TABLE 1.
Formant frequencies F1–F3 and amplitudes A1–A3 of three vowels used in noisy synthetic vowel experiment. Formant amplitudes are relative to first formant.
| \i\ | \a\ | \u\ | |
|---|---|---|---|
| F1, Hz | 125 | 740 | 225 |
| F2, Hz | 2400 | 1105 | 880 |
| F3, Hz | 2775 | 2585 | 2265 |
| A1, dB | 0 | 0 | 0 |
| A2, dB | −25 | −5 | −32 |
| A3, dB | −31 | −30 | −49 |
CP and CPP estimates were made using the same procedures used in the pulse train experiments. Mean CP and CPP values were calculated from all frames of each WAV file for regression analysis (CP and CPP variation among analysis frames was ignored). The interpolated cepstrum estimator, which used a rectangular analysis window in the pulse train experiments, was modified to use a Hamming and Hann analysis window to accommodate the amplitude variations of the synthetic vowel signals. Results for all three window types are reported below.
In addition to the three cepstrum estimators, an ideal cepstrum estimator was included in the synthetic vowel experiment, which was based on the principle of period synchronous spectral estimation [5, 30]. The ideal cepstrum estimator included three critical factors: 1) an integer number of periods within an analysis window, 2) an integer number of discrete-time samples per period, and 3) an analysis window that tapers to zero (e.g., Hann, Blackman). The use of an integer number of periods and integer samples per period ensured alignment of spectral nulls (due to leakage among the harmonics), which resulted in “deep” inter-harmonic valleys. For vanishing tapered windows, leakage rolls off at 18 dB per octave compared to only 6 dB per octave for the rectangular and Hamming windows [31], which means leakage of a harmonic due to a Hann or Blackman window interferes with a much narrower band of frequencies around the harmonic compared to the other windows. In practical terms, distant harmonic energy leakage due to a vanishing analysis window has little impact on the spectral valleys around a local harmonic. The ideal detector was realized with the interpolated cepstrum estimator by using a Hann analysis window whose length was fixed to M = 15 periods based on the known F0 of the synthetic vowels. To ensure an integer number of samples per period T, instead of adjusting the sampling rate fs such that T = fs/F0 samples was an integer, we rounded the actual period used in the construction of the synthetic vowels to the nearest integer such that T = round(fs/F0) samples. The effect of rounding was that F0 changed slightly from the values used with the other cepstrum estimators (less than 0.4% change across the range of F0s tested).
CP and CPP variations were quantified for each cepstrum estimator by modeling CP and CPP vs. SNR with a logistic regression function:
where “min”/”max” are the minimum/maximum asymptotes of the logistic function, “slope” is proportional to the maximum slope of the logistic function, and “mid” is the SNR at the midpoint of the logistic function (the point of maximum slope). Models were fit for each cepstrum estimator using data for all F0s (33), vowels (3), and SNRs (29) for a total of 2871 data points. Model parameters were estimated with the MATLAB function fit in the Curve Fit Toolbox version 3.4.1 (R2014a) using the nonlinear least squares fit option. Initial conditions for the model parameters were set by hand after inspection of the CP and CPP vs. SNR scatter plots.
RESULTS
Pulse Train Cepstral Peak
The CP, CPP, and fundamental frequency estimates for the Hillenbrand estimator, KayPENTAX estimator, and interpolated cepstrum are shown in Figures 1–3, respectively, and summarized in Table 2. The Hillenbrand CP estimates vs. pulse train frequency in Figure 1A showed several interesting characteristics. CP varied between 0.25 and 0.33 for frequencies above 100 Hz. From 100 Hz to 70 Hz, CP gradually declined from 0.30 to 0.20. For four frequencies (70, 75, 90, and 98 Hz), CP mean was lower than that of neighboring frequencies and CP st. dev. was much larger than the average variation. Across all other frequencies, CP mean was 0.289 ± 0.028 and CP st. dev. was 0.0084 ± 0.004. The CPP estimates in Figure 1B varied between 28–44 dB across frequencies with a slight negative trend as frequency increased above 100 Hz. The four frequencies noted above had CPP mean values that were lower than that of neighboring frequencies and CPP st. dev. that were much larger than the average variation. For all other frequencies, CPP mean was 35.0 ± 3.8 dB and CPP st. dev. was 0.78 ± 0.26 dB. Figure 1C shows that the fundamental frequency estimates based on the dominant rahmonic were lower than the pulse train fundamental frequencies. The smallest error was about 0.3 Hz at F0 = 71 Hz, and error increased to about 6 Hz as F0 increased to 230 Hz. RMS error of cepstral F0 was 4.2 Hz. The four frequencies noted above, as well as the frequencies of 206, 210, and 214 Hz, produced mean F0 estimates 10–20 Hz below the pulse train F0 values with much larger variances. For nearly all fundamental frequencies tested, the standard deviation in cepstral fundamental frequency across analysis frames was zero, which indicated consistent estimates.
FIGURE 1.


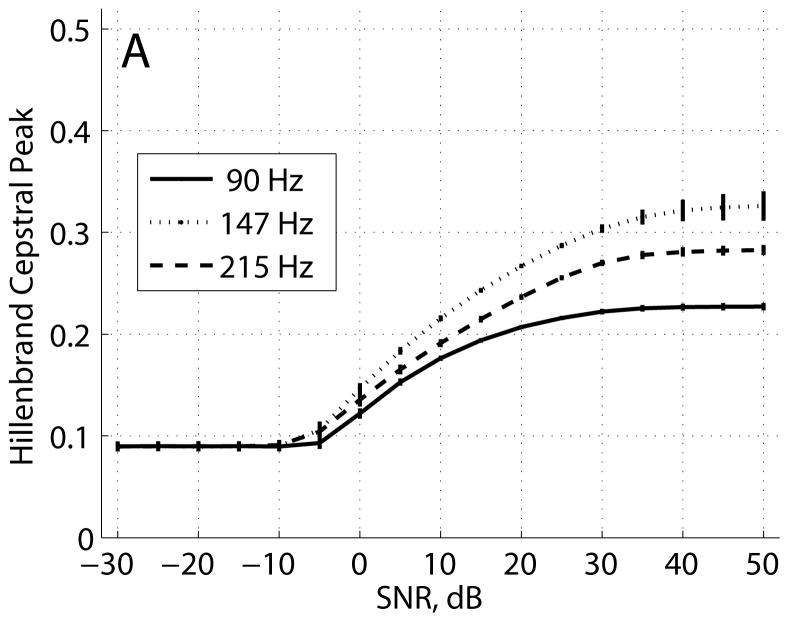
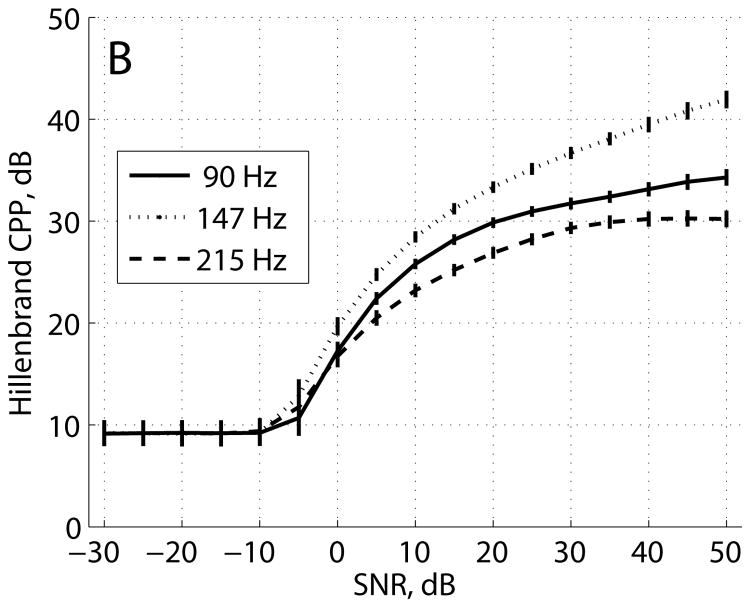
Hillenbrand estimator (A) cepstral peak, (B) cepstral peak prominence, and (C) error in fundamental frequency estimate (cepstral peak F0 – pulse train F0). Plots show mean ± standard deviation.
FIGURE 3.


Interpolated cepstrum estimator, (A) cepstral peak, and (B) error in fundamental frequency estimate (cepstral peak F0 – pulse train F0). Plots show mean ± standard deviation.
TABLE 2.
CP, CPP, and cepstral F0 estimates. All entries are mean ± standard deviation over all pulse train F0s. Entries with a “–” indicate no output for that measure.
| Hillenbrand | KayPENTAX | Interpolated Cepstrum | |
|---|---|---|---|
| CP mean | 0.298 ± 0.028 | – | 0.496 ± 0.0022 |
| CP st. dev. | 0.0084 ± 0.004 | – | 0.0033 ± 0.001 |
| CPP mean, dB | 35.0 ± 3.8 | 20.5 ± 2.7 | – |
| CPP st. dev., dB | 0.78 ± 0.26 | 0.55 ± 0.43 | – |
| F0 RMS error, Hz | 4.2 | 1.6 | 0.041 |
The KayPENTAX CPP estimates varied between 14–25 dB across the fundamental frequencies tested (Figure 2A) except for F0 = 105 Hz for which CPP = 28.1 ± 4.3 dB. CPP varied widely between 1-Hz-spaced frequencies, and CPP trended downward between 120–230 Hz. Across all frequencies, CPP mean = 20.5 ± 2.7 dB and CPP st. dev. = 0.55 ± 0.43 dB. Cepstral F0 estimates from the KayPENTAX software were slightly larger than the pulse train fundamental frequencies by 0–4 Hz (Figure 2B). RMS error in cepstral F0 was 1.6 Hz.
FIGURE 2.


KayPENTAX estimator (A) cepstral peak prominence, and (B) error in fundamental frequency estimate (cepstral peak F0 – pulse train F0). Plots show mean ± standard deviation.
The CP estimates from the interpolated cepstrum estimator in Figure 3A varied between 0.49 and 0.50 across the range of fundamental frequencies tested. Across all frequencies, CP mean was 0.496 ± 0.0022 and CP st. dev. was 0.0033 ± 0.001. CP showed little pattern across F0, although variation in CP mean appeared slightly greater for the largest frequencies tested. For about 10 frequencies tested, within-frequency variance in CP was much smaller than average, and CP mean was much closer to the theoretical value of 1/2 (between 0.5 and 0.499). Error in cepstral F0 (Figure 3B) was less than 0.12 Hz for all pulse train F0s, and the largest errors occurred for the highest frequencies. RMS error in cepstral F0 was 0.041 Hz.
Noisy Pulse Train
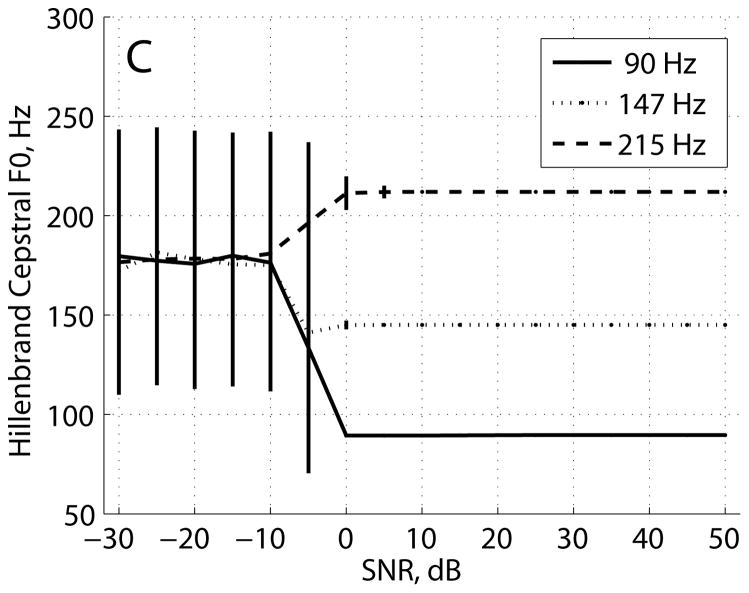
The results for the Hillenbrand estimator, KayPENTAX estimator, and interpolated cepstrum estimator are shown in Figures 4–6, respectively. Figure 4A shows Hillenbrand cepstral peak vs. SNR for pulse trains with fundamental frequencies of 90 Hz, 147 Hz, and 215 Hz. Similar to the results in Figure 1A, cepstral peak at the highest SNR varied with fundamental frequency: CP = 0.23 at 90 Hz, 0.32 at 147 Hz, and 0.28 at 215 Hz. As SNR decreased, cepstral peak decreased for the three fundamental frequencies and converged to a floor value of 0.09 at −10 dB SNR. CPP in Figure 4B also varied with fundamental frequency at the highest SNR: CPP = 34.3 dB at 90 Hz, 41.9 dB at 147 Hz, and 30.2 dB at 215 Hz. As SNR decreased, CPP decreased for the three fundamental frequencies and converged to a floor value of 9.2 dB at −10 dB SNR. The cepstral frequency estimates in Figure 4C were consistent from the highest SNR to 0 dB SNR and converged to about 177 ± 65 Hz for SNR ≤ −10 dB.
FIGURE 4.
Hillenbrand estimator, noisy pulse train, three fundamental frequencies, (A) cepstral peak, (B) cepstral peak prominence, and (C) cepstral fundamental frequency. Plots show mean ± standard deviation.
FIGURE 6.
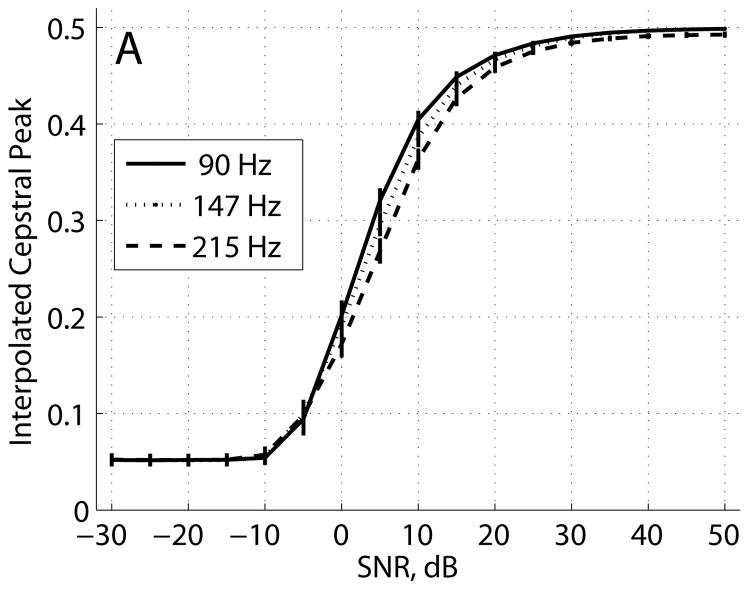
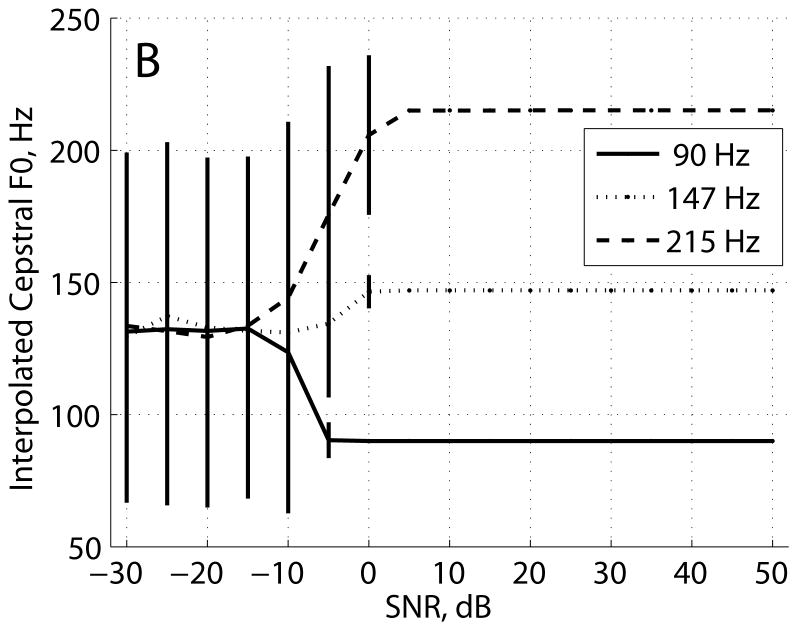
Interpolated cepstrum estimator, noisy pulse train, three fundamental frequencies, (A) cepstral peak, and (B) cepstral fundamental frequency. Plots show mean ± standard deviation.
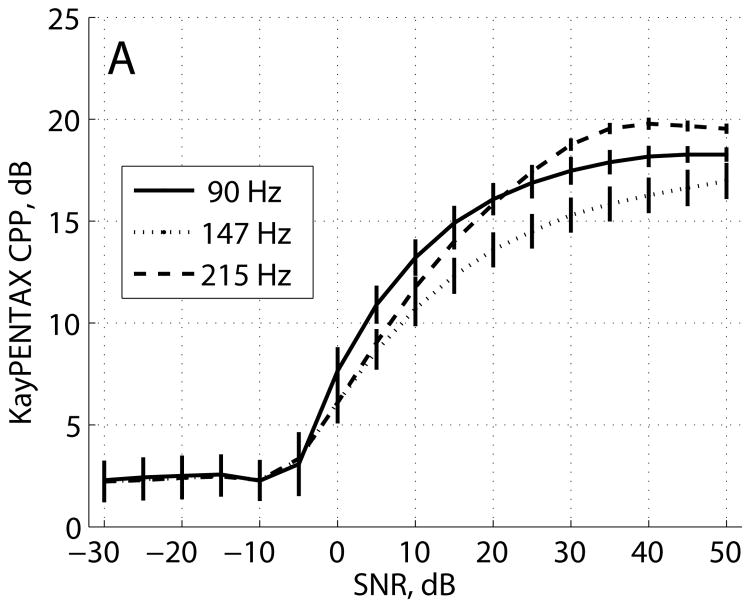
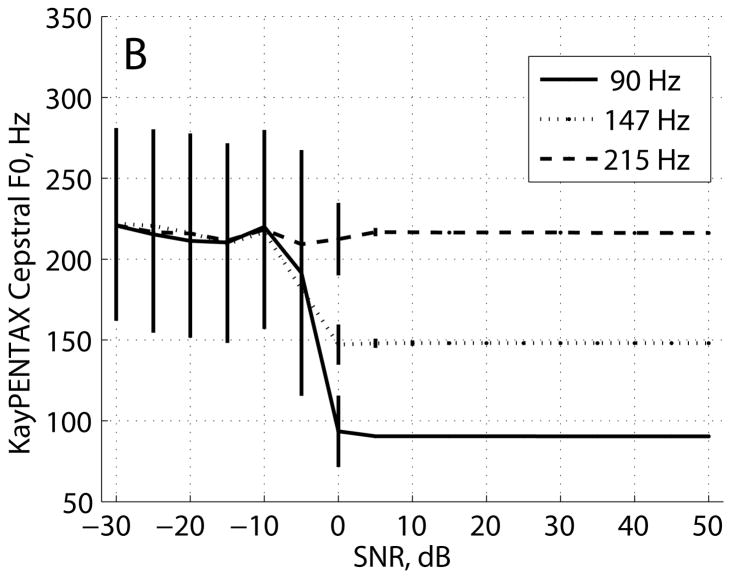
Figure 5A shows CPP vs. SNR for the KayPENTAX estimator. At the highest SNR, CPP varied with F0: CPP = 18.3 dB at 90 Hz, 17.0 dB at 147 Hz, and 19.5 dB at 215 Hz. As SNR decreased, CPP decreased to 2.3 dB for SNR ≤ −10 dB. The cepstral frequency estimates in Figure 5B were consistent from the highest SNR to about 0 dB SNR and converged to about 215 ± 60 Hz for SNR ≤ −10 dB.
FIGURE 5.
KayPENTAX estimator, noisy pulse train, three fundamental frequencies, (A) cepstral peak prominence, and (B) cepstral fundamental frequency. Plots show mean ± standard deviation.
The interpolated cepstrum peak estimation results in Figure 6A showed a consistent relationship between cepstral peak and SNR for all fundamental frequencies tested. Cepstral peak was constant below −10 dB SNR at a value of 0.05, and cepstral peak steadily increased to 0.490–0.499 at the highest SNR tested. Cepstral fundamental frequency, shown in Figure 6B, was consistent for SNRs above 5 dB, and cepstral fundamental frequency converged to about 134 ± 70 Hz for SNRs below −15 dB.
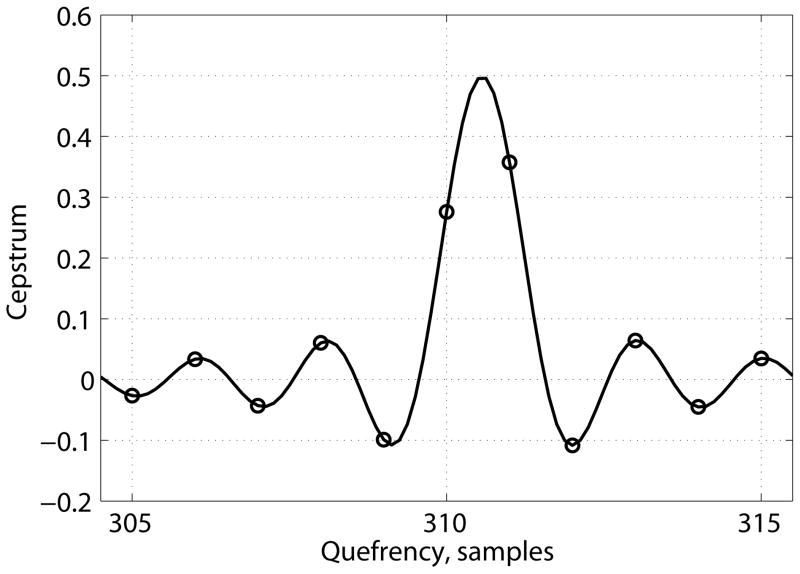
Figure 7 shows an example interpolated cepstrum for a pulse train with T = 310.6 samples (F0 = 71 Hz) that was constructed according to the procedure in the above experiments. The non-interpolated cepstrum, denoted by the circle markers, inadequately samples the cepstrum around the peak which leads to error in cepstral peak estimation as well as fundamental frequency estimation. Furthermore, averaging the cepstrum at integer quefrencies, as in cepstral smoothing [13], increases the bias in the cepstral peak value because all values included in the average are below the true peak value. The shape of the interpolated cepstrum around the peak was approximately a sinc function centered on the quefrency of the fundamental frequency.
FIGURE 7.
Interpolated cepstrum of pulse train, fs = 22050 Hz, F0 = 71 Hz, 46.4 ms rectangular window. Circles denote cepstrum at integer quefrencies. Cepstral peak value occurs at T = 310.6 samples.
Noisy Vocal Tract Model Signals
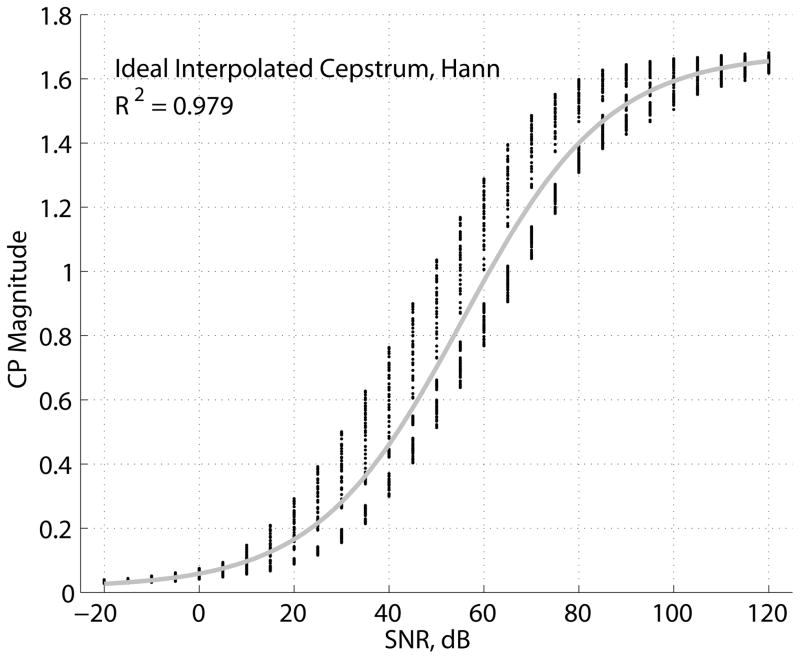
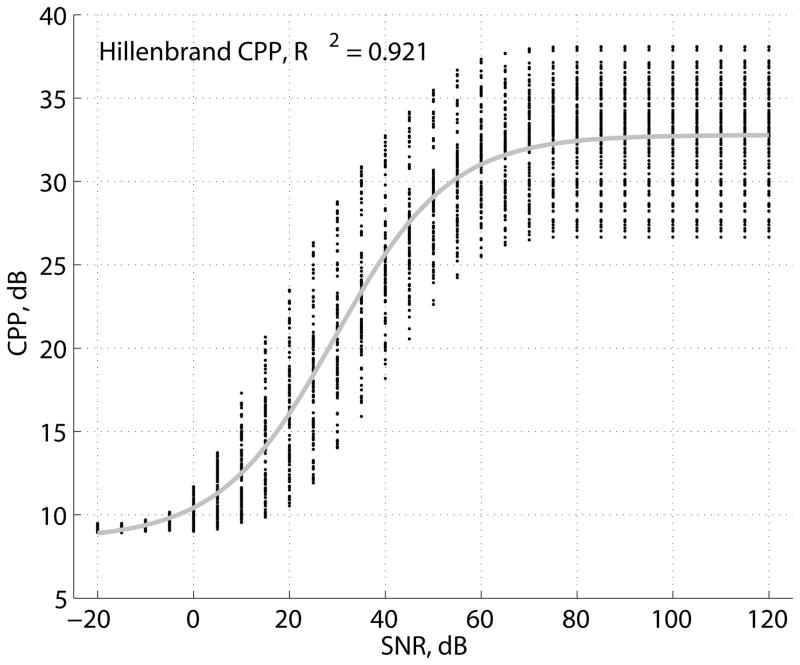
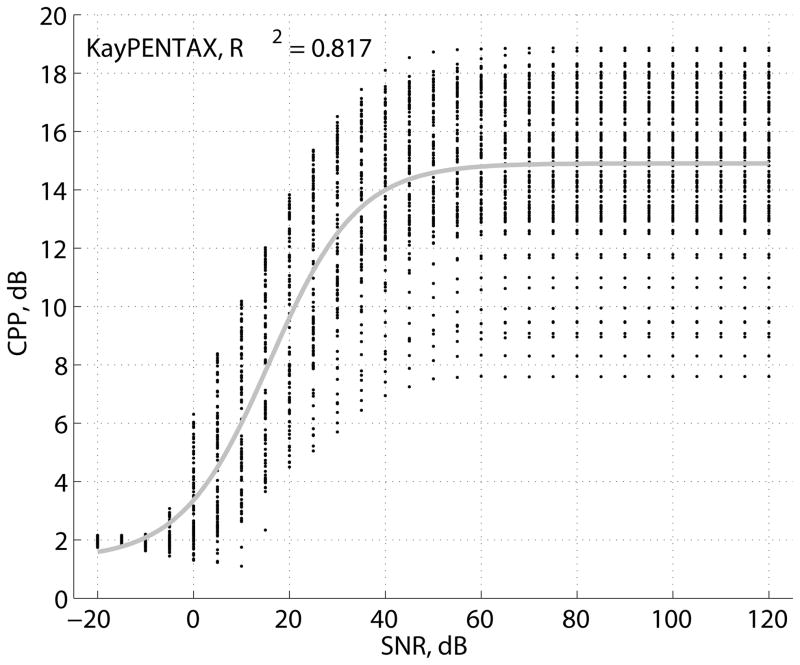
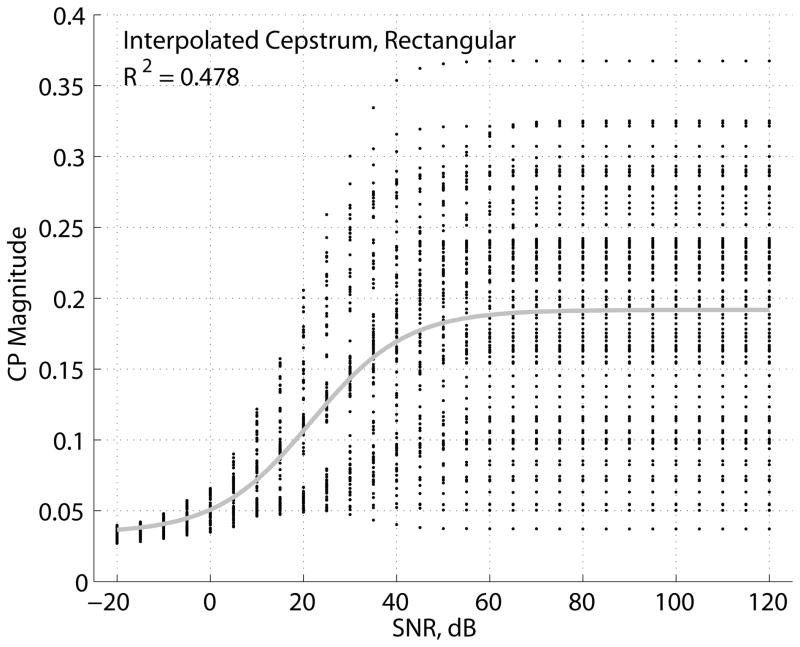
The results of the experiment are summarized in the model fit data in Table 3 for various cepstrum estimators, and CP and CPP vs. SNR scatter plots and logistic model curves are shown in Figure 8 for a select set of cepstrum estimators. The logistic model for the Hillenbrand CPP estimator explained the highest proportion of CPP variation due to SNR among all non-ideal estimators (R2 = 0.921). Only the model for the ideal interpolated cepstrum estimator with a Hann window explained a higher proportion of CP variation (R2 = 0.979). The model for the Hillenbrand CP estimator in dB units (R2 = 0.912) was nearly the same in terms of explained variation as the model for the Hillenbrand CPP estimator (also in dB units), while the model for the Hillenbrand CP estimator in magnitude units (R2 = 0.867) was significantly lower in explained variation. Note that all R2 values in Table 3 are significantly different from each other (p<0.05) due to the large N = 2871 data points used in the fit of each model. The model for the KayPENTAX CPP estimator (R2 = 0.817) performed similarly to the models for the interpolated cepstrum CP estimator with a Hann (R2 = 0.791) or Hamming (R2 = 0.778) window. The models with the least explained variation in CP were the interpolated cepstrum estimator with a rectangular window using the regular data set (R2 = 0.478) or the ideal case (R2 = 0.673).
TABLE 3.
Summary of logistic model fits of CP and CPP vs. SNR (N = 2871 samples) for the noisy vocal tract model experiment and various cepstrum estimators. Results are ranked by coefficient of determination R2.
| R2 | min | max | slope | mid | |
|---|---|---|---|---|---|
| Ideal Interpolated Cepstrum CP, Hann | 0.979 | 0.015 | 1.68 | 0.065 | 55.4 |
| Hillenbrand CPP | 0.921 | 8.5 | 32.8 | 0.083 | 29.5 |
| Hillenbrand CP dB | 0.912 | 89.8 | 110.2 | 0.092 | 25.1 |
| Ideal Interp. Cepstrum CP, Hamming | 0.900 | 0.031 | 0.73 | 0.087 | 39.3 |
| Hillenbrand CP | 0.867 | 0.087 | 0.24 | 0.093 | 30.4 |
| KayPENTAX CPP | 0.817 | 1.3 | 14.9 | 0.11 | 15.9 |
| Interpolated Cepstrum CP, Hann | 0.791 | 0.041 | 1.08 | 0.079 | 43.7 |
| Interpolated Cepstrum CP, Hamming | 0.778 | 0.047 | 0.67 | 0.10 | 33.1 |
| Ideal Interp. Cepstrum CP, Rectangular | 0.673 | 0.024 | 0.29 | 0.089 | 29.9 |
| Interpolated Cepstrum CP, Rectangular | 0.478 | 0.034 | 0.19 | 0.098 | 21.7 |
FIGURE 8.
CP and CPP vs. SNR scatter plots and logistic model curve fits for (a) ideal interpolated cepstrum estimator with Hann window, (b) Hillenbrand CPP estimator, (c) KayPENTAX CPP estimator, and (d) interpolated cepstrum estimator with rectangular window.
Scatter plots of CP and CPP vs. SNR for the Hillenbrand CPP, KayPENTAX CPP, and interpolated cepstrum estimator with rectangular and Hann (ideal) windows are shown in Figure 8. For the ideal interpolated cepstrum estimator with Hann window in Figure 8a, the variation in CP among all vowels and F0s was largest for SNRs near the middle of the logistic curve fit, while variation decreased for both smaller and larger SNRs. For all other scatter plots, variation in CP and CPP was greatest at the highest SNRs (nearly noise-free case), indicating greater sensitivity to vowel and F0 compared to variation in CP and CPP due to noise. For the interpolated cepstrum CP estimator with a rectangular window in Figure 8d, the results were in sharp contrast to those for the pulse train in Figure 6a. The pulse train results were nearly insensitive to F0 and were within 2% of the theoretical value of CP = 1/2 at the highest SNRs, whereas results for the synthetic vowels varied between 0.04–0.37 among F0s at the highest SNRs.
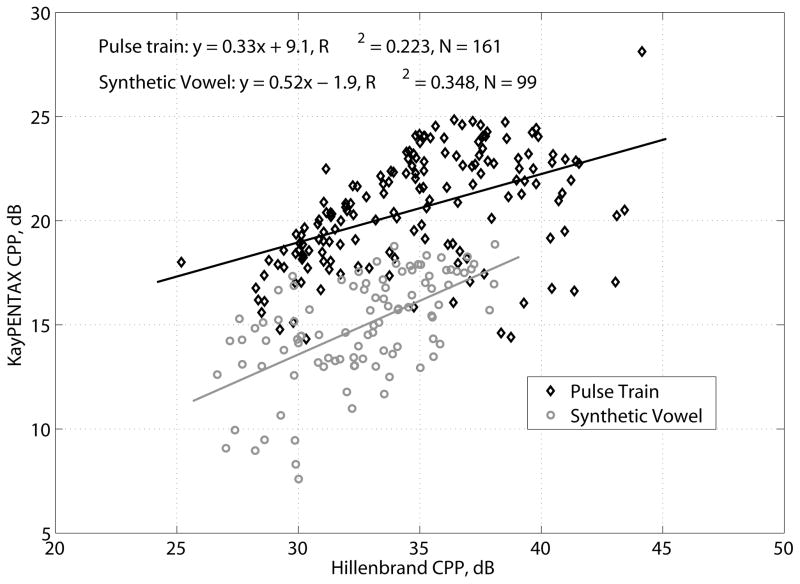
The CPP estimates of the Hillenbrand and KayPENTAX software programs may be compared using the results from the pulse train experiment and the synthetic breathy vowel experiment. Figure 9 shows scatter plots between the Hillenbrand mean CPP, averaged over all frames for each F0, and KayPENTAX mean CPP that were measured from pulse trains and from synthetic breathy vowels at the highest SNR tested. Agreement between the Hillenbrand and KayPENTAX estimators was low for pulse trains (R2 = 0.223, N = 161, p < 0.001) and for synthetic vowels (R2 = 0.348, N = 99, p < 0.001).
FIGURE 9.
KayPENTAX CPP vs. Hillenbrand CPP scatter plots for pulse trains and synthetic vowels. CPP averaged over all frames for each F0.
DISCUSSION
The results from the pulse train experiment and the results from the synthetic breathy vowel experiment drew strikingly different conclusions. For pulse trains, the interpolated cepstrum estimator with rectangular window produced CP estimates that were within 2% of the theorized expected value across a wide range of F0s, while the Hillenbrand CP estimator error was about 50 times larger than that of the interpolated cepstrum CP estimator. While CPP estimates were not directly comparable to the theoretic CP expected value, sensitivity of the estimators to F0 may be compared to each other using the coefficient of variation (CV) which is the ratio of the standard deviation to the mean. CV of mean CPP for the KayPENTAX estimator (20.5 ± 2.7 dB, CV = 13%) and the Hillenbrand estimator (35.0 ± 3.8 dB, CV = 11%) were similar, while CV of mean CP for the interpolated cepstrum estimator (0.496 ± 0.0022, CV = 0.44%) was about 20 times smaller. Results from the synthetic breathy vowel experiment, on the other hand, showed that the interpolated cepstrum estimator with rectangular window was the most sensitive to F0 and vowel compared to the other estimators tested. A theoretic analysis of CPP concluded that the vocal tract transfer function should have almost no effect on CPP [6], so the expected value of CP for a synthetic vowel (or any periodic signal with amplitude variation within a period) should be about the same as that for a pulse train. Future theoretic work on the cepstral peak should explicitly include window type to better understand the effects of the window on the log spectrum (specifically, spectral valleys) and the cepstrum. The “ideal” cepstral peak estimator used in the synthetic breathy vowel experiment was one proposed method for reducing CP variation, but further theoretic justification is required to understand how window type and length, sampling rate, and F0 interact and affect the cepstrum and cepstral peak and how CP may be estimated in an optimal way.
The Hillenbrand and KayPENTAX CPP estimators varied not only by F0 and vowel but also between each other. Agreement between the estimators in the pulse train experiment (R2 = 0.223) and the synthetic breathy vowel experiment (R2 = 0.348) was low, meaning the two estimators were only partially related to an underlying property of the test signals (i.e., periodicity). The variation between the estimators may be attributed to undocumented details of the estimator algorithms. Without a theoretic expected value, we are unable to quantify the accuracy of the CPP estimators, but the low agreement between estimators indicates that significant variations exist in CPP estimates that have not been recognized or reported previously. Future research is required to establish expected values of CP for a broad class of periodic signals so that the variation may be quantified and optimal estimators may be designed and compared.
While tapered windows are regularly used in spectral estimation to suppress leakage [25], tapered windows are known to degrade detection of the dominant rahmonic, especially for short windows such as those used to process speech [32]. The theory of analysis windows for spectral estimation was developed for linear system, but the effects of window type for nonlinear systems such as the cepstral transform are not fully known.
Variation in CPP estimates from the current experiments with synthetic signals may be put in perspective by comparison with reported CPP variation in voice quality experiments. For pulse trains, mean CPP for the Hillenbrand estimator was 34.5 ± 3.8 dB with a range of 28–44 dB over F0, and mean CPP for the KayPENTAX estimator was 20.5 ± 2.7 dB with a range of 14–25 dB. By comparison, CPP range was 13.1–21.6 dB between two example non-breathy and moderately breathy sustained vowels [13]. For a set of 27 female breathy voices from the Kay Elemetrics Disordered Voice Database, CPP range was 9–18 dB [17]. For a set of 228 voice-disordered subjects (79 male, 149 female), CPP range was 8.7–21.7 dB with mean 13.8 ± 2.5 dB [20]. The same study reported for a set of 22 vocally normal subjects (3 male, 19 female) that CPP range was 13.6–21.8 dB with mean 16.8 ± 2.1 dB. Compared to the voice quality experiments, CPP mean and range for noise-free pulse trains were higher with larger span of range and st. dev. across pulse train F0. The results reinforce the conclusion that the sources of variability in CPP due to sensitivities of the estimator should be further studied and isolated so as to better account for explained variability due to factors like voice quality.
CPP is not directly comparable to the CP expected value due to the linear regression normalization. However, we may compare the range of CP variation (in dB) to that of CPP for the Hillenbrand estimator. CP varied over a range of 10 dB (0.20–0.33, or 106.4–116.5 dB) while CPP varied over a range of 16 dB (28–44 dB) across F0 values. One explanation for the wider range of variation of Hillenbrand CPP values is that CP estimation requires one estimate only (the CP value itself) while CPP requires two estimates (CP and the normalizing linear regression function of the cepstrum). The variation in estimates of the regression function added to the variation in CP which led to a wider range of CPP estimates.
The current results have implications for clinical usage of CPP. Given the sensitivities of the currently available CPP software programs, CPP variation may be reduced by maintaining constant values for as many parameters as practical: same sustained vowel, same F0 (may use prompt tone for consistency), a high frame rate (high overlap percentage) which aids in adequate sampling of CPP to account for the effects of window phase, and the same setup for making audio recordings (microphone, sampling rate, amplitude resolution). Several F0s may be used to gauge the variation of CPP to F0 in a particular setting.
The current results also have implications for future research on CP and CPP. We have derived the expected value of the cepstral peak and demonstrated the accuracy of the interpolated cepstrum estimator for pulse trains. However, the current theory does not explain the low accuracy and high variability of the interpolated cepstrum estimator for a broader class of periodic signals which have amplitude variation within one period, as seen in the results of the synthetic breathy vowel experiment. The use of tapered windows reduced the effects of window truncation and also reduced CP variation, but future research is necessary to determine the relevant properties of windows for accuracy in CP estimation. Unlike traditional spectral analysis, cepstral analysis includes estimation of the log spectrum, in which the harmonic peaks and inter-harmonic valleys are equally important in affected CP. Murphy [5] states that “the amplitude of the first rahmonic, R1, is dependent…on the depth of the valleys between adjacent harmonic locations.” The inter-harmonic valleys “fill up” with spectral energy from additive noise (breathiness) and perturbations of F0 or amplitude (roughness), and CP and CPP diminish as desired, reflecting a deterministic relationship between signal properties and acoustic measures. If the inter-harmonic valleys fill up with spectral energy due to leakage from the interaction of the analysis window and the signal, then the variations in CP and CPP due to leakage mask to a degree the effects of noise and signal perturbation and should be minimized.
CP and CPP estimates from Hillenbrand’s software and KayPENTAX software have been used extensively in voice quality experiments, and the current results do not weaken the conclusions of those studies. Instead, the current results demonstrate that CP estimation error may be decreased significantly by better accounting for estimation parameters that impact CP variability, potentially increasing the power of the conclusions of previous studies using CPP.
CONCLUSIONS
The theoretic cepstral peak of a pulse train with at least 2 pulses and fundamental period T samples was shown to be 1/2 for all integer T and ~1/2 for non-integer T (error < 1% for T>20 samples). The results are the first published theoretic expected value for cepstral peak of a periodic signal and are the basis for a better understanding of cepstral peak estimation from time series data. Cepstral peak value and fundamental frequency were measured for pulse trains spanning 70 Hz to 230 Hz using Hillenbrand’s CPP software, KayPENTAX software, and an interpolated cepstrum method. Across all frequencies, mean Hillenbrand CP was 0.289 ± 0.028 compared to 0.496 ± 0.0022 using the interpolated cepstrum. The KayPENTAX software only output CPP values, which are not comparable to the derived theoretic CP value for pulse trains, but mean KayPENTAX CPP (20.5 ± 2.7 dB) varied significantly from mean Hillenbrand CPP (35.0 ± 3.8 dB) across fundamental frequencies. Interpolation of the cepstrum allowed for sub-sample resolution which more adequately sampled the cepstrum around the peak and led to higher accuracy in CP estimation. The Hillenbrand estimator of CP and CPP and the KayPENTAX estimator of CPP were sensitive to fundamental frequency, varying by as much as 10 dB between pulse trains with fundamental frequency differences of 1 Hz, which complicates comparison of CP and CPP across voices that span a range of fundamental frequencies. Furthermore, correlations between Hillenbrand CPP estimates and KayPENTAX CPP estimates were low (R2 = 0.223 for pulse trains, R2 = 0.348 for synthetic vowels) which shows the large impact estimator error has on CPP measurements.
Results from the synthetic breathy vowel experiment show that the cepstral peak theory developed for pulse train signals is inadequate to describe the experiment results of CP and CPP estimation from the interpolated cepstrum estimator. The large variation with a rectangular analysis window and the reduction in CP and CPP variation with a tapered window remain unexplained theoretically. Variation was minimized experimentally for an “ideal” interpolated cepstrum estimator based on the concept of period synchronous spectral estimation. Further theoretic work remains to describe the effects of fundamental elements of the cepstral transform (such as the analysis window and discrete-frequency transforms) on the cepstral peak.
Acknowledgments
The work was supported by the National Institute for Deafness and other Communicative Disorders 2R01DC009029.
APPENDIX
Cepstral Peak Value Derivation
The real cepstrum of a discrete-time signal is defined as follows [25]:
| (1) |
where x(n) is a discrete-time signal of N samples (may be zero-padded), X(ω) is the discrete-time Fourier transform of x(n), and c(n) is the real cepstrum of x(n). Consider a pulse train x(n):
which is a superposition of M sinc functions spaced by T samples with phase shift n0. When T ≥ 2 and n0 are integers, x(n) equals one at M multiples of T and zero elsewhere. For the more general case in which T or n0 is non-integer, x(n) is infinite in length due to the tails of the sinc function. The phase shift term introduces the scale factor exp(−jωn0) to the discrete-time Fourier transform of x(n) which has no effect on the magnitude spectrum. Without loss of generality, consider n0 = 0. For M = 1, the signal is a single Dirac delta function at n = 0, and the discrete-time Fourier transform X(ω) = 1 for ω ∈ [0,2π]. For M> 1, x(n − mT) transforms to e−jωmT according to the shifting property of the discrete-time Fourier transform, so
where ϕm = 2πm/M. The magnitude spectrum |X(ω)| contains several zeroes which are singularities in the log-magnitude spectrum. Despite the singularities, the inverse Fourier transform of log|X(ω)| exists. To see this, consider the signal y(ω) = log(ω) with a singularity at ω= 0. The integral of y(ω) over the range ω ∈ [0,1] is identical to the integral of the inverse equation ω = ey over the range y ∈ (−∞, 0] which equates to unity. The magnitude of X(ω) is determined from the product of X(ω) and its conjugate X*(ω):
so that
When x(n) is a real-valued signal, |X(ω)| is an even function, so the term ejωn in Eq. 1 may be replaced with a cosine term. The cepstral peak is the cepstrum evaluated at lag T:
where the integral operator is moved inside the summation operator. The integral evaluates as follows:
where we note that
and
due to the fact that the sine term is an odd function of m while the log-cosine term is an even function of m. Therefore,
and, after manipulation,
which may be evaluated for two cases:
- Case 1: 2T integer. When T is integer or integer + 1/2, the summation term equates to zero, so
Case 2: 2T non-integer. When 2T is non-integer, the summation term does not equate to zero. The summation term is a function of T and M and may be empirically evaluated, noting that the argument of the summation term is zero when T-m/M = 0. The maximum/minimum values of the summation term (including the 1/2π term) are approximately ±0.1073 and occur for M = 7 and T ≈ integer ± 0.1105.
In summary, the cepstral peak of a pulse train is 0.5 for T ≥ 2 samples when 2T is an integer and M ≥ 2 periods. When 2T is not an integer, the cepstral peak is approximately 0.5, converging to 0.5 as T increases. Note that the results do not depend on the sampling rate of the discrete-time signal x(n), only the number of samples in a fundamental period. Furthermore, the cepstral peak exists with as few as two periods. For a typical sampling rate of 16 kHz and fundamental frequency of 225 Hz, T ≈ 71.1 samples and the cepstral peak differs from 0.5 by less than 0.26%. For lower fundamental frequencies, the difference is smaller.
Interpolated Cepstrum Estimation
The following is an outline of the calculation of the cepstrum with zero padding:
Rectangular window of data x(n), L samples in length,
X(k) = FFT of x(n), zero-padded to length N≥L, N power of 2 for efficiency, k∈ [0,N-1]
Spectral magnitude: Y(k) = |X(k)|,
Log spectrum: Z(k) = log(Y(k)), natural logarithm,
Floor function applied to Z(k), level in dB relative to max(Z(k)),
Zero pad: W(l) = K*[Z(0:N/2-1), zeros((K-1)*N+1), Z(N/2+1:N-1)], l∈[0,K*N-1], K power of 2 for efficiency,
-
Interpolated cepstrum: c(n) = inverse FFT of W(l), n in [0,K*N-1]
With the interpolated cepstrum c(n), the following steps are used to find cepstral peak lag and value:
-
Determine integer index range into c(n), F0 in [F0min,F0max] Hz, sampling rate fs Hz:
nMin = floor(K*fs/F0max)+1, rounded down to nearest integer,
nMax = ceil(K*fs/F0min)+1, rounded up to nearest integer,
Cepstral peak = c(n0) = max of c(n’) at index n’=n0, n’ in [nMin, nMax],
Convert index to cepstral lag (fundamental period): T0 = (n0-1)/K (fractional) samples,
Cepstral F0: F0cep = fs/T0 Hz.
-
Footnotes
Presented at the 167th Meeting of the Acoustical Society of America, Providence, RI, May 5–9, 2014
Publisher's Disclaimer: This is a PDF file of an unedited manuscript that has been accepted for publication. As a service to our customers we are providing this early version of the manuscript. The manuscript will undergo copyediting, typesetting, and review of the resulting proof before it is published in its final citable form. Please note that during the production process errors may be discovered which could affect the content, and all legal disclaimers that apply to the journal pertain.
References
- 1.Awan SN, Roy N, Jette ME, Meltzner GS, Hillman RE. Quantifying dysphonia severity using a sepctral/cepstral-based acoustic index: Comparisons with auditory-perceptual judgements from the CAPE-V. Clinical Linguistics and Phonetics. 2010;24(9):742–758. doi: 10.3109/02699206.2010.492446. [DOI] [PubMed] [Google Scholar]
- 2.Hillenbrand JM. James M Hillenbrand Homepage. 2014 Jun; [Online]. Available: http://homepages.wmich.edu/~hillenbr/
- 3.Maryn Y, Roy N, De Bodt M, Van Cauwenberge P, Corthals P. Acoustic measurement of overall voice quality: A meta-analysis. Journal of the Acoustical Society of America. 2009;126(5):2619–2634. doi: 10.1121/1.3224706. [DOI] [PubMed] [Google Scholar]
- 4.Skowronski MD, Shrivastav R, Hunter EJ. The cepstral peak: A theoretic analysis and implementation comparison of a popular voice measure. 167th Meeting of the Acoustical Society of America; Providence, RI. 2014. [Google Scholar]
- 5.Murphy PJ. On first rahmonic amplitude in the analysis of synthesized aperiodic voice signals. Journal of the Acoustical Society of America. 2006;120(5):2896–2907. doi: 10.1121/1.2355483. [DOI] [PubMed] [Google Scholar]
- 6.Fraile R, Godino-Llorente JI. Cepstral peak prominence: A comprehensive analysis. Biomedical Signal Processing and Control. 2014;14:42–54. [Google Scholar]
- 7.Bogert BP, Healy MJR, Tukey JW. The quefrency alanysis of time series for echoes: Cepstrum, pseudo-autocovariance, cross-cepstrum and saphe cracking. In: Rosenblatt M, editor. Proceedings of the Symposium on Time Series Analysis. New York: John Wiley and Sons, Inc; 1963. pp. 209–243. [Google Scholar]
- 8.Noll AM. Short-time spectrum and “cepstrum” techniques for vocal-pitch detection. J Acoustical Society of America. 1964;36(2):296–302. [Google Scholar]
- 9.Oppenheim AV. Speech analysis-synthesis system based on homomorphic filtering. J Acoustical Society of America. 1969;45(2):458–465. doi: 10.1121/1.1911395. [DOI] [PubMed] [Google Scholar]
- 10.de Krom G. A cepstrum-based technique for determining a harmonics-to-noise ratio in speech signals. Journal of Speech and Hearing Research. 1993;36:254–266. doi: 10.1044/jshr.3602.254. [DOI] [PubMed] [Google Scholar]
- 11.Dejonckere PH, Wieneke GH. Cepstra of normal and pathological voices, in correlation with acoustic, aerodynamic, and perceptual data. In: Ball MJ, Duckworth M, editors. Advances in Clinical Phonetics. Amsterdam: John Benjamins Publishing Company; 1996. pp. 217–226. [Google Scholar]
- 12.Hillenbrand J, Cleveland RA, Erickson RL. Acoustic correlates of breathy vocal quality. Journal of Speech and Hearing Research. 1994 Aug;37:769–778. doi: 10.1044/jshr.3704.769. [DOI] [PubMed] [Google Scholar]
- 13.Hillenbrand J, Houde RA. Acoustic correlates of breathy vocal quality: Dysphonic voices and continuous speech. Journal of Speech and Hearing Research. 1996 Apr;39:311–321. doi: 10.1044/jshr.3902.311. [DOI] [PubMed] [Google Scholar]
- 14.Eadie TL, Baylor CR. The effect of perceptual training on inexperienced listeners’ judgements of dyshponic voice. Journal of Voice. 2006;20(4):527–544. doi: 10.1016/j.jvoice.2005.08.007. [DOI] [PubMed] [Google Scholar]
- 15.Callan DE, Kent RD, Roy N, Tasko SM. Self-organizing map for the classification of normal and disordered female voices. Journal of Speech, Language, and Hearing Research. 1999;42:355–366. doi: 10.1044/jslhr.4202.355. [DOI] [PubMed] [Google Scholar]
- 16.Heman-Ackah YD, Michael DD, Goding GS., Jr The relationship between cepstral peak prominence and selected parameters of dysphonia. Journal of Voice. 2002;16(1):20–27. doi: 10.1016/s0892-1997(02)00067-x. [DOI] [PubMed] [Google Scholar]
- 17.Shrivastav R, Sapienza CM. Objective measures of breathy voice quality obtained using an auditory model. Journal of the Acoustical Society of America. 2003;114(4):2217–2224. doi: 10.1121/1.1605414. [DOI] [PubMed] [Google Scholar]
- 18.Wolfe VI, Martin DP, Palmer CI. Perception of dysphonic voice quality by naive listeners. Journal of Speech, Language, and Hearing Research. 2000;43:697–705. doi: 10.1044/jslhr.4303.697. [DOI] [PubMed] [Google Scholar]
- 19.Stranik A, Cmejla R, Vokral J. Acoustic parameters for classification of breathiness in continuous speech according to the GRBAS scale. Journal of Voice. 2014 Apr; doi: 10.1016/j.jvoice.2013.07.016. [DOI] [PubMed] [Google Scholar]
- 20.Maryn Y, Corthals P, Van Cauwenberge P, Roy N, De Bodt M. Toward improved ecological validity in the acoustic measurement of overall voice quality: Combining continuous speech and sustained vowels. Journal of Voice. 2010;24(5):540–555. doi: 10.1016/j.jvoice.2008.12.014. [DOI] [PubMed] [Google Scholar]
- 21.Awan SN, Roy N. Acoustic prediction of voice type in women with functional dysphonia. Journal of Voice. 2005;19(2):268–282. doi: 10.1016/j.jvoice.2004.03.005. [DOI] [PubMed] [Google Scholar]
- 22.Samlan RA, Story BH, Bunton K. Relation of perceived breathiness to laryngeal kinematics and acoustic measures based on computational modeling. Journal of Speech, Language, and Hearing Sciences. 2013;56:1209–1223. doi: 10.1044/1092-4388(2012/12-0194). [DOI] [PMC free article] [PubMed] [Google Scholar]
- 23.Chen G, Kreiman J, Gerratt BR, Neubauer J, Shue YL, Alwan A. Development of a glottal area index that integrates glottal gap size and open quotient. Journal of the Acoustical Society of America. 2013;133(3):1656–1666. doi: 10.1121/1.4789931. [DOI] [PMC free article] [PubMed] [Google Scholar]
- 24.Brinca LF, Batista APF, Tavares AI, Goncalves IC, Moreno ML. Use of cepstral analyses for differentiating normal from dysphonic voices: a comparative study of connected speech versus sustained vowel in European Portuguese female speakers. Journal of Voice. 2014;28(3):282–286. doi: 10.1016/j.jvoice.2013.10.001. [DOI] [PubMed] [Google Scholar]
- 25.Oppenheim AV, Schafer RW. Discrete-time signal processing. Englewood Cliffs, NJ: Prentice-Hall; 1989. [Google Scholar]
- 26.Klatt DH, Klatt LC. Analysis, synthesis, and perception of voice quality variations among female and male talkers. Journal of the Acoustical Society of America. 1990;87(2):820–857. doi: 10.1121/1.398894. [DOI] [PubMed] [Google Scholar]
- 27.Childers DG, Lee CK. Vocal quality factors: Analysis, synthesis, and perception. Journal of the Acoustical Society of America. 1991;90(5):2394–2410. doi: 10.1121/1.402044. [DOI] [PubMed] [Google Scholar]
- 28.Atal BA, Hanauer SL. Speech analysis and synthesis by linear prediction of the speech wave. J Acoustical Society of America. 1971;50(2):637–655. doi: 10.1121/1.1912679. [DOI] [PubMed] [Google Scholar]
- 29.Deller JR, Jr, Hansen JHL, Proakis JG. Discrete-time processing of speech signals. New York: IEEE Press; 2000. [Google Scholar]
- 30.Muta H, Baer T, Wagatsuma K, Muraoka T, Fukuda H. A pitch-synchronous analysis of hoarseness in running speech. Journal of the Acoustical Society of America. 1988;84(4):1292–1301. doi: 10.1121/1.396628. [DOI] [PubMed] [Google Scholar]
- 31.Harris FJ. On the use of windows for harmonic analysis with the discrete Fourier transform. Proceedings of the IEEE. 1978;66(1):51–83. [Google Scholar]
- 32.Childers DG, Skinner DP, Kemerait RC. The cepstrum: a guide to processing. Proceedings of the IEEE. 1977;65(10):1428–1443. [Google Scholar]


