

Abstract
CIGB-552 is a cell-penetrating peptide that exerts in vitro and in vivo antitumor effect on cancer cells. In the present work, the mechanism involved in such anticancer activity was studied using chemical proteomics and expression-based proteomics in culture cancer cell lines. CIGB-552 interacts with at least 55 proteins, as determined by chemical proteomics. A temporal differential proteomics based on iTRAQ quantification method was performed to identify CIGB-552 modulated proteins. The proteomic profile includes 72 differentially expressed proteins in response to CIGB-552 treatment. Proteins related to cell proliferation and apoptosis were identified by both approaches. In line with previous findings, proteomic data revealed that CIGB-552 triggers the inhibition of NF-κB signaling pathway. Furthermore, proteins related to cell invasion were differentially modulated by CIGB-552 treatment suggesting new potentialities of CIGB-552 as anticancer agent. Overall, the current study contributes to a better understanding of the antitumor action mechanism of CIGB-552.
1. Introduction
Peptides, owing to their feasible rational design, high specificity, and low toxicity, have become attractive therapeutic agents to treat different diseases [1]. Ongoing advances in cancer therapy include the discovery of peptides with a potent antineoplastic effect [2]. Peptides inhibiting angiogenesis or blocking protein-protein interactions have already been evaluated as potential anticancer agents [3]. Additionally, proapoptotic peptides or peptides functioning as receptor antagonists have been proposed to restrict tumor progression [3].
CIGB-552 is a second-generation peptide derived from the antitumor peptide L-2. Initially, L-2 was identified by screening a peptide library corresponding to the region 32–51 of Limulus anti-LPS factor (LALF) [4]. The cytotoxic effect of L-2 was demonstrated on different murine and human tumor cell lines [4]. A transcriptomic study on tumor cells suggested that L-2 could induce apoptosis by modulating glycolysis, mitosis, protein biosynthesis, and other cancer related processes [4].
Such biological findings, in combination with the peptide cell-penetrating capacity, made L-2 an attractive lead molecule for further structural optimization. Therefore, the primary sequence of L-2 was modified, including substitution by D-amino acids and N-terminal acetylation [5]. These modifications increased the antitumor effect of the resultant peptide known as CIGB-552 [5, 6].
The CIGB-552 in vitro antineoplastic effect has been documented by using human cancer cells of different histological origins [5]. In vivo, a significant reduction in tumor growth after treatment with CIGB-552 was demonstrated in both syngenic murine tumors and patient-derived xenograft models [6]. Additionally to induce apoptosis in the tumor mass, CIGB-552 administration decreased the microvessels' density in the human HT-29 xenograft tumor model suggesting its antiangiogenic effect [6].
Significant advances have been made to discover the functional mediators of CIGB-552 biological response. Copper metabolism (Murr1) domain-containing protein 1 (COMMD1) has been identified as a major target of CIGB-552. Such interaction increased the COMMD1 stability and induced ubiquitination of RelA with subsequent inhibition of the antiapoptotic activity regulated by NF-κB [5]. Nevertheless, the proteome regulated by CIGB-552 can provide new insights to support the antitumor action mechanism of such peptide.
In this work, to identify additional CIGB-552 targets and modulated proteins in tumor cells, two proteomics approaches were used: the chemical proteomics and the expression-based proteomics. The proteomics-derived data suggested that CIGB-552 could be considered as a multitarget drug, which exerts its antitumor effect by modulating proteins related to NF-κB activation, cell cycle regulation, and apoptosis. Network analysis of proteomic results indicates the molecular basis by which the CIGB-552 peptide regulates cancer related processes. The analysis provided here is the starting point for further investigations about the role of CIGB-552 as an anticancer drug.
2. Materials and Methods
2.1. Peptide Synthesis
CIGB-552 is a cell-penetrating peptide with sequence Ac-HARIKPTFRRLKWKYKGKFW, where proline and leucine are D-amino acids; and the N-terminal was blocked by acetylation [5]. The CIGB-552 peptide was synthesized on solid phase using the Fmoc strategy; it was purified by reverse phase high performance liquid chromatography (RP-HPLC) to >95% purity on an acetonitrile/H2O-trifluoroacetic acid gradient [7] and confirmed by electrospray mass spectrometry (Micromass, UK). For chemical proteomics, the CIGB-552 peptide biotinylated at the N-terminal end (CIGB-552-B) was synthesized using the same procedure.
2.2. Cell Culture and Treatments
For proteomic studies two CIGB-552 sensitive cancer cell lines were selected, the larynx carcinoma and colon adenocarcinoma cells, Hep-2 and HT-29, respectively, which were obtained from ATCC (Rockville, MD). Both cell lines were cultured at 37°C and 5% CO2 in RPMI 1640 (Life Technologies, USA) supplemented with 10% fetal bovine serum (FBS; PAA, Canada) and 30 μg/mL gentamicin (Sigma, USA).
For expression-based proteomics, 20 × 106 HT-29 cells were seeded in appropriate vessels and incubated for 24 h. Subsequently, the tumor cells were incubated with 150 μmol/L of CIGB-552 during 40 min, 2 h, and 5 h.
2.3. Chemical Proteomics
2.3.1. Isolation of Proteins
For chemical proteomics, 20 × 106 Hep-2 cells were seeded in appropriate vessels and cultured for 24 h. Subsequently, Hep-2 cells were collected by centrifugation, washed twice with cold phosphate buffered saline (PBS), and lysed in hypotonic PBS solution (0.1x), containing 1 mM of DDT (Sigma) and complete protease inhibitor (Roche, USA), by three freeze-thaw (37°C) cycles. Cellular lysate was cleared by centrifugation at 12 000 rpm at 4°C for 15 min.
2.3.2. Affinity Purification
The CIGB-552-B peptide was incubated with 50 μL of streptavidin-sepharose matrix (binding capacity: 300 nmol/mL; GE Healthcare, USA) for 1 h. As a control, streptavidin-sepharose matrix without CIGB-552-B peptide was used. Then, 300 μg of total protein from Hep-2 cell lysate, as determined by the Bradford assay (Bio-Rad, USA), was added to each matrix and incubated for 2 h at 4°C. The streptavidin-sepharose matrix was collected by short spin and extensively washed with PBS containing 1 mM DTT and 0.5% NP40. Retained proteins were eluted by heat denaturing with SDS sample buffer.
2.3.3. Sample Preparation and LC-MS/MS Analysis
Affinity-purified proteins were reduced, alkylated with acrylamide, and separated by sodium dodecyl sulfate-polyacrylamide gel electrophoresis (SDS-PAGE). Analytical and preparative gels were silver [8] and Coomassie blue stained, respectively. Each lane of the preparative gel was cut into 12 slices that were faded, washed, and in situ digested with sequencing grade trypsin (Promega, USA) during 18 h at 37°C. The resulting peptide mixtures were extracted and desalted with stage tips (Thermo Scientific, USA).
Purified samples were analyzed in an Agilent 1100 series nano LC system (Agilent, USA) coupled online to a QTof-2 tandem mass spectrometer (Micromass, UK). The capillary and cone voltages of the electrospray ionization source were operated with 1.8 kV and 35 V, respectively. Samples were applied at 20 μL/min to a PepMap C18 Precolumn Cartridge (5 mm × 300 μm i.d.) from LC-Packings (USA) and were extensively desalted for 10 min using 0.1% formic acid. The precolumn was switched back onto a C18 capillary column (15 cm × 75 μm i.d., packed with 5 μm, Zorbax 300 SB) and the tryptic peptides were separated using a mobile phase containing 0.1% formic acid, 5–45% acetonitrile gradient over 90 min at 300 nL/min flow rate. Survey scans were acquired during 1 s and a maximum of 4 concurrent MS/MS acquisitions were only triggered for 2+, 3+ charged precursors ions detected at an intensity above a threshold of 15 counts/s. Each MS/MS acquisition was completed and switched back to MS mode when the total ion current fell below a threshold of 2 counts/s or after a maximum of 6 s of continuous acquisition. Data acquisition and processing were performed using MassLynx v3.5 (Micromass, UK).
2.3.4. Protein Identification
Acquired data were searched against the human proteins in the UniProtKB database using MASCOT (version 2.2, Matrix Science, UK) [9]. Search parameters were set to a mass tolerance of 1.2 Da for the precursor ions and 0.6 Da for the fragment ions. One trypsin missed cleavage site was allowed. Propionamide-cysteine and oxidized methionine were set as fixed and variable modifications, respectively. MS/MS spectra of identified proteins with one or two peptides were manually inspected. The identification of a protein or peptide was considered positive using the consensus of several criteria: the peptide score >20, the assignment of four intense consecutive y n′′ fragments ions in the MS/MS spectrum, and the most intense signals which must be explained considering the proposed sequence.
2.3.5. Bioinformatics Analysis
Functional classification of identified proteins was based on the information annotated in the Gene Ontology (GO) database (http://www.geneontology.org). The analysis was performed using the functional enrichment tool GeneCodis (version 3.0) (http://genecodis.cnb.csic.es/) [10]. To identify significant enriched biological processes (p values lower than 0.05), the hypergeometric distribution and the false discovery rate (FDR) correction method were computed by GeneCodis, as statistical analysis. Protein complexes associated with the CIGB-552 target profile were identified by using the CORUM database (http://mips.helmholtz-muenchen.de/genre/proj/corum) [11].
A target deconvolution strategy was applied to filter the CIGB-552 target profile. Nonspecific proteins, retained in unloaded streptavidin-sepharose matrix (without CIGB-552-B), were ruled out. Further, proteins reported by Burkard et al. [12] as part of the central proteome were subtracted from the analysis. To identify contaminants or background proteins the potential CIGB-552 target profile was queried against the CRAPome database (http://www.crapome.org). For each protein, the average spectral count was retrieved as a measure of its abundance in affinity purification followed by mass spectrometry (AP-MS) experiments [13].
Functional subnetworks perturbed by CIGB-552 were identified by using drugDisruptNet (http://bioinformatics.cemm.oeaw.ac.at/index.php/downloads-left/87-disruption-of-functional-networks). The impact of CIGB-552 on functional subnetworks was estimated by the score S net, which was calculated as described by Burkard et al. [14] but with some modifications. In this regard, the affinity of CIGB-552 to its targets (affinity score) was computed irrespective of the protein abundance in a competitive pull-down (fixed to 1 for all potential CIGB-552 targets). Hence, the affinity score was set to be only proportional to the amount of protein pulled down by CIGB-552-B. As a measure of protein abundance, the exponentially modified Protein Abundance Index (emPAI) of each identified protein was retrieved from MASCOT results. Briefly, the emPAI value is calculated as 10PAI − 1 (PAI = observed peptides/observable peptides), being the number of different observed peptides that cover the protein sequence, a rough estimate of the protein amount in mass spectrometric analysis [15].
2.4. Expression-Based Proteomics
2.4.1. Isolation of Cytosolic Proteins
HT-29 cells were collected by trypsinization. After washing with PBS, the cells were suspended in 700 μL of the isotonic buffer containing 10 mM Tris-HCl adjusted to pH 7.5, 0.25 M sucrose, 1 mM EGTA, and protease inhibitors. For plasma membrane solubilization Triton X-100 at final concentration of 0.25% was added. After 15 min at 4°C, the cell lysate was centrifuged for 15 min at 12 000 rpm and 4°C. The supernatant containing cytoplasmic proteins was kept at −70°C until subsequent analysis.
2.4.2. Tryptic Digestion and Isobaric Labeling (iTRAQ)
The cytoplasmic protein extracts (120 μg) of CIGB-552-treated and untreated (control) HT-29 cells were precipitated with acetone/TCA and independently dissolved in 20 μL of buffer containing 2 M guanidinium hydrochloride (GuCl) and 500 mM tetraethylammonium bromide (TEAB), pH 8.5. Proteins were reduced using 49 mM tris-2-carboxyethyl phosphine (TCEP) at 60°C for 1 h and alkylated with 84 mM iodoacetamide for 30 min at ambient temperature in the dark. The pool of reduced and S-alkylated proteins was diluted until 50 μL by adding 500 mM TEAB buffer. Proteins were digested with sequencing grade trypsin (Promega, USA) at an enzyme-to-substrate mass ratio of 1 : 10 for 18 h at 37°C.
Tryptic peptides were labeled with iTRAQ reagent according to the manufacturer's protocol (Applied Biosystems, USA). Briefly, each vial of iTRAQ reagent (114–117 tags) was dissolved in 70 μL ethanol by vortexing for 1 min at room temperature. Equal amounts of tryptic peptides derived from different samples were labeled by adding iTRAQ reagent 114 (untreated HT-29 cells, control), iTRAQ reagent 115 (HT-29 cells treated with CIGB-552 for 40 min), iTRAQ reagent 116 (HT-29 cells treated with CIGB-552 for 2 h), and iTRAQ reagent 117 (HT-29 cells treated with CIGB-552 for 5 h). The reaction for iTRAQ labeling was incubated at room temperature for 1 h. Labeled peptides were mixed and dried in a centrifugal evaporator.
2.4.3. LC-MS/MS Analysis
A high pH reversed-phase chromatography step was used to separate the complex mixture of peptides prior to LC-MS/MS analysis. The labeled peptides were resuspended in 500 μL buffer A (0.1% NH4OH, pH 10.5) and separated in 24 fractions using a 4.6 mm × 10 cm RP column packed with POROS R2 resin (Applied Biosystems, USA). Peptides were eluted at a flow rate of 0.8 mL/min using a stepwise buffer B (0.1% NH4OH, 60% acetonitrile, pH 10.5) gradient. Collected fractions were acidified by adding 200 μL of 5% formic acid, lyophilized, and further dissolved in 200 μL of 0.2% formic acid.
For each fraction, three replicate aliquots of 40 μL were separated in independent LC-MS/MS experiments by reverse phase chromatography. Peptides were separated and analyzed using an Agilent 1100 series nano-LC system (Agilent, USA) coupled online to a QTof-2 orthogonal hybrid tandem mass spectrometer (Micromass, UK) operated as described above. Peptides were eluted at a flow rate of 300 nL/min using a 60 min gradient starting with 5% acetonitrile to 45% acetonitrile with a two-buffer system (Buffer A: 0.2% formic acid; Buffer B: 0.2% formic acid, 80% acetonitrile). Data dependent acquisition MS/MS spectra of the eluted peptides were acquired in three m/z ranges (400–600, 590–900, or 890–2000) using the gas-phase fractionation approach [16]. Subsequent analysis proceeded as described above.
2.4.4. Protein Identification
Raw files were processed using MASCOT Distiller software (version 2.3). Peptides were assigned to MS/MS spectra using MASCOT search engine (version 2.2) against the human proteins in the UniProtKB database. The following search parameters were selected: 1.2 Da precursor mass tolerance, 0.6 Da daughter ions mass tolerance, and tryptic search with up to one missed cleavage site. Variable modifications including deamidation of glutamine and asparagine, methionine sulfoxide, and the side reaction of iTRAQ labeling on tyrosine residues were taken into account. Carbamidomethyl cysteine and iTRAQ label on lysine and at the peptide N-terminus were specified as fixed modifications. To accept a peptide hit as positive we considered a false discovery rate (FDR) of 3% based on the target-decoy strategy [17].
Quantification was achieved using ISOTOPICA software [18, 19]. The software enables the relative peptide quantification based on the detailed analysis of the observed isotopic ion distribution. The software calculated the best ratio of the reporter ions (tags 114, 115, 116, and 117) to obtain an in silico isotopic ion distribution best matching with the isotopic ion distribution observed experimentally. To evaluate the quality of this adjustment, the software calculates the difference between the area of both in silico and experimental isotopic ion distributions, and it is expressed as a GOF coefficient (goodness of fitting). The relative quantifications of peptides with GOF below 0.8 were not considered for further analysis. Additionally all relative quantifications were manually inspected. The relative peptide expression ratios (fold changes) were determined with respect to the control sample (tag 114). The fold changes of all peptides corresponding to the same protein were averaged. The resulting protein fold changes were normalized; population median and standard deviation set the threshold ratio to consider, with a p value < 0.1, a protein as differentially expressed in each condition (HT-29 cells treated with CIGB-552 for 40 min, 2 h, or 5 h) with respect to control (untreated HT-29 cells).
2.4.5. Bioinformatics Analysis
The functional classification of differentially expressed proteins and enrichment analysis were performed as described above. For biological network analysis, the Cytoscape software (version 2.8) [20] and accessory applications were used. Protein-protein interaction network was generated using the BisoGenet application (version 1.4) [21] which retrieves information from interaction databases including DIP, BioGrid, HPRD, and BIND. The fold changes of differentially expressed proteins were visualized in the network context using the MultiColoredNodes application [22].
3. Results and Discussion
CIGB-552 is a peptide-based drug with antitumor effect and cell-penetrating capacity [4]. The first evidence about CIGB-552 mechanism of action has been already reported [5]. CIGB-552 interacts with COMMD1 protein, increasing its abundance levels. Such evidences were corroborated by Western blot and immunofluorescence detection of COMMD1 in human cancer cells of different histological origins [5]. CIGB-552 induces cellular cytotoxicity in a variety of tumor cell lines [4, 5]. Among them, the Hep-2 larynx carcinoma cell line is highly sensitive to CIGB-552 cytotoxic effect.
To identify other proteins that interact with CIGB-552 a chemical proteomic approach was then conducted (Figure 1(a)). PBS-soluble proteins derived from Hep-2 cells were incubated with CIGB-552-B previously bound to the streptavidin-sepharose matrix (Figure 1(a)). As a negative control, the same pool of proteins was also incubated with the unloaded streptavidin-sepharose matrix. CIGB-552 interacting proteins were eluted and analyzed by SDS-PAGE (Figure 1(b)). The electrophoretic pattern of the whole cell extract and CIGB-552-matrix eluted proteins showed appreciable differences in terms of band intensities indicating the potential CIGB-552 target profile. The proteins identified in the negative control correspond to proteins that interact with the matrix, known as either nonspecific binders or sticky proteins.
Figure 1.

Chemical proteomic approach (a) and results (b). (a) The streptavidin-sepharose (grey) biotinylated CIGB-552 complex retains the drug targets (green) and secondary binders (orange). Nonspecific proteins (blue) stick to the matrix. The retained proteins were eluted, separated by SDS-PAGE, and identified by LC-MS/MS. (b) Proteins eluted from the streptavidin-sepharose matrix were separated by SDS-PAGE. Molecular weight markers (MWM) displayed on the left. Lane I: protein cell extract (Hep-2 cell line); lane II: proteins eluted from the unloaded matrix (without CIGB-552-B); lane III: proteins eluted from the matrix bound to CIGB-552-B.
A total of 265 proteins were identified by mass spectrometry, of which 104 proteins were also identified as nonspecific binders (see Supplementary Table S1a in the Supplementary Material available online at http://dx.doi.org/10.1155/2015/124082). Therefore, 161 proteins constitute the potential CIGB-552 target profile identified by chemical proteomics. Biological processes related to carbohydrate metabolism, protein modification, and cell cycle are significantly represented on this dataset (Figure 2). Interestingly, such biological processes are also represented in the transcriptomic profile regulated by L-2 peptide in Hep-2 tumor cells [4].
Figure 2.
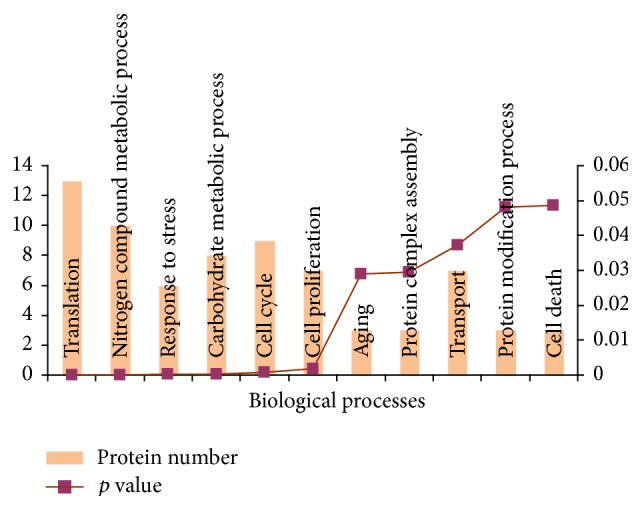
Biological processes significantly represented in the CIGB-552 target profile (161 proteins). Proteins were classified according to annotations of Gene Ontology database; the enrichment analysis was performed using the GeneCodis bioinformatic tool.
The potential CIGB-552 target profile identified in vitro includes five biological complexes (Figure 3). Components of the minichromosome maintenance (MCM) complex were identified as potential CIGB-552 targets. The MCM complex is related to DNA replication and cell cycle regulation. Therefore, the MCM proteins are frequently upregulated in different cancer types including meningioma, lung cancer, and laryngeal carcinoma [23–26]. Four components of the 60S ribosomal large subunit were also identified. Accordingly, translation is a biological process overrepresented in the CIGB-552 target profile (Figure 2). Related to protein modification process, five components of the ubiquitin E3 ligase complex were found. In addition, nine subunits of the proteasome complex were included in the CIGB-552 target profile.
Figure 3.

Protein complexes included in the CIGB-552 target profile (161 proteins). Biological processes related to protein complexes are illustrated. The analysis was conducted using CORUM database.
Chemical proteomics do not distinguish between drugs direct and indirect binders. In addition, a high background is typically identified in these experiments [27]. Therefore, the 161 proteins found in the chemical proteomic profile might include nonspecific binders of CIGB-552. Potential solutions to overcome the specificity problem of chemical proteomics are (i) to include unrelated drugs or the matrix itself as negative controls, (ii) to identify and subtract from the analysis the abundant proteins or core proteome, and (iii) to perform a competitive pull-down to rank the most relevant targets [28].
In the present study, besides identifying nonspecific binders, the core proteome was subtracted from the potential CIGB-552 target profile. A set of 1124 proteins previously identified as part of the human central proteome was used [12]. The potential CIGB-552 target profile (161 proteins) includes 106 proteins of the central proteome. The majority of these proteins (91/106) were also reported with an average spectral count greater than two in the CRAPome database (Supplementary Table S1a-b). The spectral count is used as a measure of protein abundance in affinity purification (AP) experiments [13]. Therefore, the CRAPome repository gives information about abundant proteins or common contaminants of AP-MS experiments.
By subtracting the central proteome, 55 proteins were identified as the most probable targets of CIGB-552 (Table 1). This result suggests the potentialities of CIGB-552 as a multitarget drug. In contrast to previously published results [5], the COMMD1 protein was not identified in the chemical proteomic profile, probably due to its low expression levels in tumor cells [29].
Table 1.
Proteins identified by chemical proteomics as potential CIGB-552 targets.
| UniProt ACCa | Description | Gene symbolb | Scorec | emPAId |
|---|---|---|---|---|
| O95218 | Zinc finger Ran-binding domain-containing protein 2 | ZRANB2 | 39 | 0.21 |
| Q9NX65 | Zinc finger and SCAN domain-containing protein 32 | ZSCAN32 | 26 | 0.05 |
| Q9UBQ0 | Vacuolar protein sorting-associated protein 29 | VPS29 | 56 | 0.66 |
| Q14376 | UDP-glucose 4-epimerase | GALE | 38 | 0.1 |
| Q12888 | Tumor suppressor p53-binding protein 1 | TP53BP1 | 28 | 0.02 |
| O14773 | Tripeptidyl-peptidase 1 | TPP1 | 76 | 0.06 |
| Q13428 | Treacle protein | TCOF1 | 27 | 0.02 |
| P04183 | Thymidine kinase, cytosolic | TK1 | 24 | 0.15 |
| Q9NXG2 | THUMP domain-containing protein 1 | THUMPD1 | 58 | 0.09 |
| Q8WW59 | SPRY domain-containing protein 4 | SPRYD4 | 39 | 0.16 |
| P63151 | Serine/threonine-protein phosphatase 2A 55 kDa regulatory subunit B alpha isoform | PPP2R2A | 87 | 0.07 |
| Q9NVA2 | Septin-11 | SEPT11 | 29 | 0.08 |
| O00764 | Pyridoxal kinase | PDXK | 59 | 0.11 |
| Q16740 | ATP-dependent Clp protease proteolytic subunit, mitochondrial | CLPP | 67 | 0.26 |
| Q9Y4X5 | E3 ubiquitin-protein ligase ARIH1 | ARIH1 | 29 | 0.06 |
| O15460 | Prolyl 4-hydroxylase subunit alpha-2 | P4HA2 | 41 | 0.12 |
| P40261 | Nicotinamide N-methyltransferase | NNMT | 46 | 0.27 |
| P19105 | Myosin regulatory light chain 12A | MYL12A | 200 | 2.45 |
| Q16539 | Mitogen-activated protein kinase 14 | MAPK14 | 82 | 0.19 |
| Q9UNF1 | Melanoma-associated antigen D2 | MAGED2 | 238 | 0.18 |
| P50213 | Isocitrate dehydrogenase [NAD] subunit alpha, mitochondrial | IDH3A | 64 | 0.2 |
| P05161 | Ubiquitin-like protein ISG15 | ISG15 | 34 | 0.21 |
| O00629 | Importin subunit alpha-3 | KPNA4 | 49 | 0.06 |
| Q8WTS6 | Histone-lysine N-methyltransferase SETD7 | SETD7 | 42 | 0.09 |
| P06737 | Glycogen phosphorylase, liver form | PYGL | 40 | 0.04 |
| P30712 | Glutathione S-transferase theta-2 | GSTT2 | 96 | 0.14 |
| P47755 | F-actin-capping protein subunit alpha-2 | CAPZA2 | 109 | 0.38 |
| P52907 | F-actin-capping protein subunit alpha-1 | CAPZA1 | 118 | 0.54 |
| P41091 | Eukaryotic translation initiation factor 2 subunit 3 | EIF2S3 | 43 | 0.07 |
| O95571 | Persulfide dioxygenase ETHE1, mitochondrial | ETHE1 | 35 | 0.13 |
| Q9BVJ7 | Dual specificity protein phosphatase 23 | DUSP23 | 50 | 0.23 |
| P52564 | Dual specificity mitogen-activated protein kinase kinase 6 | MAP2K6 | 29 | 0.1 |
| Q14691 | DNA replication complex GINS protein PSF1 | GINS1 | 24 | 0.16 |
| Q3LXA3 | Bifunctional ATP-dependent dihydroxyacetone kinase/FAD-AMP lyase (cyclizing) | DAK | 45 | 0.06 |
| P21291 | Cysteine and glycine-rich protein 1 | CSRP1 | 47 | 0.39 |
| Q99627 | COP9 signalosome complex subunit 8 | COPS8 | 69 | 0.35 |
| Q9UBW8 | COP9 signalosome complex subunit 7a | COPS7A | 46 | 0.12 |
| P61201 | COP9 signalosome complex subunit 2 | COPS2 | 136 | 0.23 |
| Q07021 | Complement component 1 Q subcomponent-binding protein, mitochondrial | C1QBP | 648 | 1.74 |
| Q9NT62 | Ubiquitin-like-conjugating enzyme ATG3 | ATG3 | 58 | 0.1 |
| Q9BZZ5 | Apoptosis inhibitor 5 | API5 | 173 | 0.13 |
| P12814 | Alpha-actinin-1 | ACTN1 | 1345 | 1.76 |
| P11766 | Alcohol dehydrogenase class 3 | ADH5 | 78 | 0.19 |
| P36404 | ADP-ribosylation factor-like protein 2 | ARL2 | 38 | 0.4 |
| P40616 | ADP-ribosylation factor-like protein 1 | ARL1 | 39 | 0.19 |
| P84077 | ADP-ribosylation factor 1 | ARF1 | 99 | 0.66 |
| P00813 | Adenosine deaminase | ADA | 35 | 0.09 |
| Q9BTT0 | Acidic leucine-rich nuclear phosphoprotein 32 family member E | ANP32E | 169 | 0.41 |
| P84098 | 60S ribosomal protein L19 | RPL19 | 38 | 0.16 |
| P61586 | Transforming protein RhoA | RHOA | 32 | 0.17 |
| Q07960 | Rho GTPase-activating protein 1 | ARHGAP1 | 63 | 0.07 |
| Q14657 | EKC/KEOPS complex subunit LAGE3 | LAGE3 | 34 | 0.26 |
| Q96IU4 | Alpha/beta hydrolase domain-containing protein 14B | ABHD14B | 67 | 0.17 |
| P39687 | Acidic leucine-rich nuclear phosphoprotein 32 family member A | ANP32A | 286 | 1.38 |
| O75607 | Nucleoplasmin-3 | NPM3 | 33 | 0.2 |
aUniProtKB/Swiss-Prot entry accession number (http://www.uniprot.org/).
bRecommended gene name (official gene symbol) as provided by UniProtKB/Swiss-Prot.
cMASCOT protein score.
demPAI: exponentially modified Protein Abundance Index.
The central proteome is mainly enriched in cell vital processes [12]. Consequently, after the central proteome subtraction, biological processes such as translation, transport, response to stress, and cell death are no longer significantly represented in the CIGB-552 chemical proteomic profile. However, proteins related to cell cycle, carbohydrate metabolic process, and signal transduction are corroborated as mediators of the CIGB-552 antitumor activity (Supplementary Table S2a).
Target deconvolution based on the subtractions of sticky and core proteome proteins might remove a real drug target [28]. Nevertheless, this strategy has been previously used to identify the targets of BCR-ABL kinase inhibitor INNO-406 in chronic myeloid leukemia [30]. To overcome the potential disadvantage of removing real targets, a computational strategy was applied for identifying the functional subnetworks perturbed by CIGB-552. Such computational approach, named drugDisruptNet, was presented by Burkard et al. to predict the mechanism and potential side effects of drugs [14]. A functional subnetwork is defined as a connected fraction of the interactome in which all the proteins share the same function [14]. A drug can impact functional subnetworks directly (the drug target is part of the subnetwork) or indirectly (the drug target interacts with the protein subnetwork) [14]. Therefore, even if a CIGB-552 target is removed during the target deconvolution, the remaining potential targets might indicate the functional subnetworks perturbed by the drug.
To identify the functional subnetworks perturbed by CIGB-552, the filtered target profile (55 proteins) was used. As other studies have corroborated the role of COMMD1 in CIGB-552 cytotoxic effect [5], this protein was included in the network analysis. According to drugDisruptNet results (Table 2), different subnetworks related to carcinogenesis were perturbed by CIGB-552, “antiapoptosis” and “negative regulation of cell cycle” among them. These results corroborate the antitumor effect of CIGB-552.
Table 2.
Functional subnetworks perturbed by CIGB-552.
| Perturbed functional subnetworks | GO id.a | Nodes | Targetsb | Score S net c |
|---|---|---|---|---|
| Insulin receptor signaling pathway | GO:0008286 | 57 | 15 | 0.175 |
| Positive regulation of biosynthetic process | GO:0009891 | 73 | 19 | 0.173 |
| Positive regulation of NF-κB transcription factor activity | GO:0051092 | 40 | 14 | 0.165 |
| Protein autoprocessing | GO:0016540 | 67 | 14 | 0.165 |
| Extracellular structure organization | GO:0043062 | 66 | 13 | 0.143 |
| Mitochondrion organization | GO:0007005 | 68 | 17 | 0.136 |
| Antiapoptosis | GO:0006916 | 178 | 26 | 0.112 |
| Interleukin-6 production | GO:0032635 | 21 | 8 | 0.105 |
| Response to hypoxia | GO:0001666 | 68 | 14 | 0.103 |
| Negative regulation of cell cycle | GO:0045786 | 37 | 8 | 0.076 |
aGO id.: Gene Ontology identifier.
bNumber of proteins related to the functional subnetwork and identified as potential CIGB-552 targets.
c S net: score calculated by drugDisruptNet, predicting the impact of CIGB-552 over the functional subnetwork.
Additionally, “extracellular structure organization” and “response to hypoxia” were modulated by the CIGB-552 target profile (Table 2). Both the composition and organization of the extracellular matrix and hypoxia are microenvironment signals that contribute to metastatic spread of cancer cells [31]. Therefore, CIGB-552 could inhibit metastasis in treated cells.
The “positive regulation of NF-κB transcription factor activity” is disrupted by CIGB-552 (Table 2). Although the target profile is not annotated in this signaling pathway, it acts at the periphery of the functional subnetwork (Figure 4). Previous results demonstrated that CIGB-552 treatment upregulates COMMD1 levels [5]. Such event increases RelA ubiquitination and consequently inhibits the NF-κB signaling pathway [5]. In the present study, COMMD1 was not identified in the target profile. However, the “positive regulation of NF-κB transcription factor activity” is disrupted by the CIGB-552 target profile essentially at two network nodes: RELA and TRAF6 (Figure 4).
Figure 4.
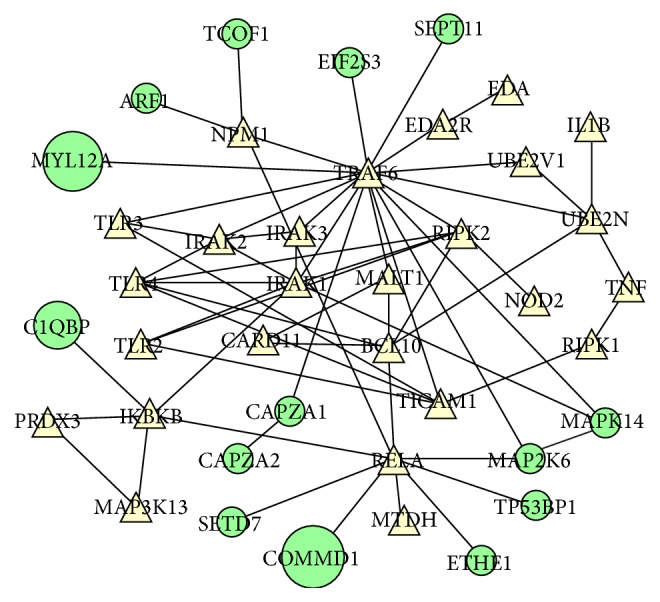
CIGB-552 targets (green nodes) perturb the positive regulation of NF-κB transcription factor activity. In the protein-protein interaction network, the CIGB-552 target profile (green nodes) interferes with proteins that share the same Gene Ontology term (triangular nodes). The node size is proportional to drug affinity, which was calculated based on the abundance of pulled-down proteins according to emPAI values. COMMD1 protein, which is a validated CIGB-552 target, is represented in the functional subnetwork with the maximal node size to illustrate a high drug affinity.
NF-κB transcription factor is a homo- or heterodimeric complex composed of REL proteins (RelA/p65, RelB, c-Rel, p50/p105, and p52/p100). RelA/p50 appears to be the most common heterodimer. After activation of I-kappa-B kinase complex (IKK), the active NF-κB complex is translocated into the nucleus to regulate gene transcription [32]. NF-κB target genes promote tumor cell proliferation, inhibition of apoptosis, migration, inflammation, and angiogenesis [33]. Therefore, upregulated NF-κB activity has been reported in different tumor types including laryngeal and pancreatic cancers [34–36].
The TNF receptor-associated factor 6 (TRAF6) activates NF-κB [37]. This mechanism depends on TRAF6-mediated TGF-beta-activated kinase 1 (MAP3K7/TAK1) activation, which in turn phosphorylates and activates the I-kappa-B kinase complex (IKK) [38]. MAP3K7/TAK1 also phosphorylates the dual specificity mitogen-activated protein kinase kinase 6 (MAP2K6), which in turn activates the p38 MAPK signaling pathway [37]. In the present study, MAP2K6 and MAPK14 (mitogen-activated protein kinase 14) were identified as potential CIGB-552 targets (Figure 4). MAPK14 is a member of the p38 MAPK family. The p38 MAPKs phosphorylate different substrates, including the nuclear mitogen- and stress-activated protein kinase 1 (RPS6KA5/MSK1). MSK1 phosphorylates RelA and increases the transcriptional activity of NF-κB [39]. Therefore, CIGB-552 could inhibit the NF-κB signaling pathway in tumor cells by blocking the MAP2K6/MAPK14 functions.
Furthermore, persulfide dioxygenase ETHE1 (ETHE1) and lysine N-methyltransferase 7 (SETD7) were identified as potential CIGB-552 targets (Figure 4). Other studies demonstrate that both proteins regulate RelA transcriptional activity. ETHE1 protein promotes accumulation of RelA in the cytoplasm and consequently inhibits the NF-κB transcriptional activity [40]. SETD7 protein monomethylates RelA subunit; this event triggers RelA degradation and downregulates NF-κB target gene expression [41, 42]. The identification of ETHE1 and SETD7 in the target profile suggests that CIGB-552 could exert, by interacting with these proteins, different mechanisms to regulate RelA function.
Interleukin-6 (IL-6) expression is activated by NF-κB transcription factor [43, 44]. The “interleukin-6 production” subnetwork was perturbed by CIGB-552 target profile (Table 2). Therefore, disruption of this subnetwork could be a consequence of inhibiting NF-κB transcriptional activity. Importantly, IL-6 downregulation could be validated as a subrogate marker of CIGB-552 antitumor effect.
CIGB-552 target interactions trigger cellular signaling events that finally accomplish the antitumor response. To investigate these signaling events at the protein level, an expression-based proteomics study was conducted. The majority of proteins identified by chemical proteomics as potential CIGB-552 targets (109/161) are located in the cytosol. Cytoplasmic proteins are also enriched after target deconvolution (36/55) (Supplementary Table S2b-c). Therefore, the cytoplasmic proteome regulated in the presence of 150 μmol/L of CIGB-552 was studied using the HT-29 cell line as target cells. Such peptide dose represents the inhibitory concentration 80 (IC80) for CIGB-552 in HT-29 cells (unpublished results). Confocal microscopy demonstrates that after 10 min of incubation CIGB-552 is able to penetrate the cells [4]. In the present work, the proteomic profile modulated by CIGB-552 was investigated at three incubation times: 40 min, 2 h, and 5 h.
In both proteomic experiments, different tumor cell lines were used to evaluate consistence among results. HT-29 cells, as well as Hep-2 cells, have shown to be sensitive to CIGB-552 anticancer effect [4]. In addition, CIGB-552 was able to elicit significant antitumor activity in both murine CT-26 (colon carcinoma cells) and human HT-29 implanted tumors [6]. Consequently, the differentially expressed proteins in treated HT-29 cells could support the findings of the CIGB-552 target profile identified in total cell extracts from Hep-2 cells.
As a result, 658 protein hits were identified (Supplementary Table S3), of which 72 proteins were differentially modulated in at least one experimental condition (CIGB-552: 40 min, 2 h, and 5 h) with respect to control (Table 3). A total of 68 proteins of the proteomic profile (658 protein hits), including eight differentially modulated proteins in response to CIGB-552 treatment, were also identified by chemical proteomics as potential CIGB-552 targets (Supplementary Table S3).
Table 3.
Differentially expressed proteins in HT-29 cells treated with CIGB-552.
| UniProt ACCa | Description | Gene symbolb | Scorec | Fold changed | ||
|---|---|---|---|---|---|---|
| 40 min (2.6) | 2 h (2.6) | 5 h (2.4) | ||||
| Downregulated proteins | ||||||
| Q14566 | DNA replication licensing factor MCM6 | MCM6 | 76.01 | −4.2 | −1.1 | −2 |
| Q14764 | Major vault protein | MVP | 88.9 | −1.2 | −1.9 | −2.6 |
| P35579 | Myosin-9 | MYH9 | 166.85 | −1.7 | −2.9 | −1.6 |
| P61160 | Actin-related protein 2 | ACTR2 | 60.97 | −2.6 | −1.4 | −1.8 |
| Q02338 | D-beta-hydroxybutyrate dehydrogenase, mitochondrial | BDH1 | 71.17 | −1.7 | −1.4 | −2.6 |
| P20290 | Transcription factor BTF3 | BTF3 | 62.09 | 1.2 | −2.9 | −1.5 |
| Q7L1Q6 | Basic leucine zipper and W2 domain-containing protein 1 | BZW1 | 95.07 | −1.3 | −3.8 | −2.3 |
| P17655 | Calpain-2 catalytic subunit | CAPN2 | 101.09 | −1.3 | −3.1 | −1.9 |
| A8K010 | Putative uncharacterized protein C6orf176 | C6orf176 | 33.72 | −1.1 | −3.3 | −1.6 |
| P53618 | Coatomer subunit beta | COPB1 | 64.4 | −2.9 | −1.5 | −1.4 |
| O60888 | Protein CutA | CUTA | 62.42 | 1.2 | −2.2 | −2.9 |
| O14976 | Cyclin-G-associated kinase | GAK | 47.67 | −3.4 | −3.8 | −2.9 |
| O95395 | Beta-1,3-galactosyl-O-glycosyl-glycoprotein beta-1,6-N-acetylglucosaminyltransferase 3 | GCNT3 | 59.62 | −3.2 | −1.2 | −1.6 |
| P52306 | Rap1 GTPase-GDP dissociation stimulator 1 | RAP1GDS1 | 66.74 | −1.2 | −3 | −1.1 |
| O15228 | Dihydroxyacetone phosphate acyltransferase | GNPAT | 46.58 | −4.5 | −3.1 | −1.9 |
| Q86Y56 | HEAT repeat-containing protein 2 | HEATR2 | 63.07 | −1.5 | −5 | −1.4 |
| Q6YP21 | Kynurenine-oxoglutarate transaminase 3 | CCBL2 | 39.9 | 1.7 | OFF | 1.5 |
| P43243 | Matrin-3 | MATR3 | 269.16 | 1 | −1.2 | −4.5 |
| O75439 | Mitochondrial-processing peptidase subunit beta | PMPCB | 99.73 | −2.9 | 1.2 | −1.1 |
| O43847 | Nardilysin | NRD1 | 41.16 | −1.3 | −2.9 | 1.6 |
| O15270 | Serine palmitoyltransferase 2 | SPTLC2 | 62.71 | −3.2 | −2 | −2.5 |
| P29122 | Proprotein convertase subtilisin/kexin type 6 | PCSK6 | 30.52 | −1.3 | −1.5 | −16.7 |
| P00491 | Purine nucleoside phosphorylase | PNP | 91.96 | −2 | −5.6 | 1.7 |
| P25787 | Proteasome subunit alpha type 2 | PSMA2 | 75.42 | 1.6 | −2.9 | 1 |
| O14818 | Proteasome subunit alpha type 7 | PSMA7 | 103.36 | −1.3 | −2.8 | −1.1 |
| Q13813 | Spectrin alpha chain, nonerythrocytic 1 | SPTAN1 | 112.76 | −1.6 | −3.1 | −1.6 |
| Q9UL25 | Ras-related protein Rab-21 | RAB21 | 129.33 | −2.6 | 1.1 | −1.1 |
| Q9NV58 | E3 ubiquitin-protein ligase RNF19A | RNF19A | 31.17 | −1.4 | −1.8 | −4.8 |
| P62081 | 40S ribosomal protein S7 | RPS7 | 65.3 | −4.2 | −3.8 | −2.6 |
| Q96FQ6 | Protein S100-A16 | S100A16 | 78 | −2.6 | −1.4 | 1 |
| P63208 | S-phase kinase-associated protein 1 | SKP1 | 72.23 | −7.1 | −3.1 | 1.2 |
| O00193 | Small acidic protein | SMAP | 74.25 | −1.5 | −2.6 | −1.3 |
| Q96JX3 | Protein SERAC1 | SERAC1 | 32.13 | −1.1 | 1.3 | −2.5 |
| Q9Y5M8 | Signal recognition particle receptor subunit beta | SRPRB | 54.95 | −1.7 | −1.1 | −2.9 |
| Q96I99 | Succinyl-CoA ligase [GDP-forming] subunit beta, mitochondrial | SUCLG2 | 85.7 | −1.5 | −2.4 | −2.4 |
|
| ||||||
| Upregulated proteins | ||||||
| O75223 | Gamma-glutamylcyclotransferase | GGCT | 37.33 | 1.1 | 2 | 3.8 |
| P61758 | Prefoldin subunit 3 | VBP1 | 152.64 | 2.1 | 2.2 | 2.5 |
| Q9BWD1 | Acetyl-CoA acetyltransferase, cytosolic | ACAT2 | 69.2 | 2.5 | 2 | 3.2 |
| Q86TX2 | Acyl-coenzyme A thioesterase 1 | ACOT1 | 73.32 | 2.8 | 1.6 | 2.4 |
| P02647 | Apolipoprotein A-I | APOA1 | 76.16 | 1.9 | 2.7 | −1.1 |
| O00192 | Armadillo repeat protein deleted in velocardiofacial syndrome | ARVCF | 46 | ON | ON | ON |
| Q9NYF8 | Bcl-2-associated transcription factor 1 | BCLAF1 | 86.18 | 1 | ON | ON |
| O14523 | C2 domain-containing protein 2-like | C2CD2L | 31.3 | 2.9 | 1.7 | 2 |
| P60953 | Cell division control protein 42 homolog | CDC42 | 52.58 | 2.3 | 1.5 | 3.1 |
| Q9UJS0 | Calcium-binding mitochondrial carrier protein Aralar2 | SLC25A13 | 57.95 | 2.4 | 3.4 | 1.9 |
| O43809 | Cleavage and polyadenylation specificity factor subunit 5 | NUDT21 | 70.35 | 1.2 | −1.7 | 2.5 |
| Q96C86 | Scavenger mRNA-decapping enzyme DcpS | DCPS | 70.59 | 1.5 | 2.1 | 2.4 |
| Q5TDH0 | Protein DDI1 homolog 2 | DDI2 | 31.55 | 1 | ON | ON |
| P18858 | DNA ligase 1 | LIG1 | 49.53 | 2.3 | 2.2 | 2.6 |
| Q5JZY3 | Ephrin type A receptor 10 | EPHA10 | 37.22 | ON | ON | ON |
| O76003 | Glutaredoxin-3 | GLRX3 | 50.31 | 3.2 | 1.8 | 2.4 |
| Q14103 | Heterogeneous nuclear ribonucleoprotein D0 | HNRNPD | 138.39 | 1.4 | 3 | 1.4 |
| Q96P70 | Importin-9 | IPO9 | 88.04 | 3.9 | 2.9 | 2.9 |
| P33176 | Kinesin-1 heavy chain | KIF5B | 102.25 | 4.3 | 3.6 | 5.1 |
| P49006 | MARCKS-related protein | MARCKSL1 | 112.06 | ON | ON | 1 |
| Q9H3R2 | Mucin-13 | MUC13 | 68.36 | 1.8 | 4.2 | 1.9 |
| Q7Z406 | Myosin-14 | MYH14 | 90.59 | −1.1 | 9.7 | −1.9 |
| Q9NX40 | OCIA domain-containing protein 1 | OCIAD1 | 87.8 | 2.6 | 2.9 | 2.3 |
| Q15102 | Platelet-activating factor acetylhydrolase IB subunit gamma | PAFAH1B3 | 84.5 | 2.4 | 62.4 | 1.6 |
| O43252 | Bifunctional 3′-phosphoadenosine 5′-phosphosulfate synthetase 1 | PAPSS1 | 51.9 | 1 | 1 | ON |
| P36871 | Phosphoglucomutase-1 | PGM1 | 105.24 | 3.3 | −2.2 | 2.2 |
| P35232 | Prohibitin | PHB | 90.52 | 8.4 | 4.7 | 3.2 |
| Q9UHJ6 | Sedoheptulokinase | SHPK | 59.09 | 1 | 1 | ON |
| P52788 | Spermine synthase | SMS | 60.56 | −1.2 | 2.1 | 3.2 |
| Q01082 | Spectrin beta chain, brain 1 | SPTBN1 | 63.84 | ON | ON | ON |
| Q9Y3F4 | Serine-threonine kinase receptor-associated protein | STRAP | 80.3 | 2.9 | 3.7 | 4.5 |
| P26640 | Valyl-tRNA synthetase | VARS | 54.77 | 1.7 | 3 | 3.5 |
| Q86VP1 | Tax1-binding protein 1 | TAX1BP1 | 31.29 | 2.3 | 11.7 | 1.2 |
| Q9HD45 | Transmembrane 9 superfamily member 3 | TM9SF3 | 71.54 | 1.5 | 3.1 | −1.8 |
| P55327 | Tumor protein D52 | TPD52 | 64.69 | 5.9 | 1.8 | 1.8 |
| P38606 | V-type proton ATPase catalytic subunit A | ATP6V1A | 66.31 | −1.2 | 4.4 | 2.8 |
| P45880 | Voltage-dependent anion-selective channel protein 2 | VDAC2 | 59.14 | 2.1 | 4 | 2 |
aUniProtKB/Swiss-Prot entry accession number (http://www.uniprot.org/). The UniProt accession numbers highlighted in bold indicate those proteins (8) that were also identified by chemical proteomics.
bRecommended gene name (official gene symbol) as provided by UniProtKB/Swiss-Prot.
cMASCOT protein score.
dFold change of differentially regulated proteins after 40 min, 2 h, and 5 h of treatment with CIGB-552 [(−) downregulated]. For each incubation time with CIGB-552, is given the fold change threshold to consider a protein significantly up- or downregulated. The fold changes that have an absolute value higher than the threshold are highlighted in boldface.
Bioinformatics analysis of comparative proteomic data demonstrated the enrichment of biological processes such as gene expression, proteolysis, and response to drug (Figure 5). Importantly, carbohydrate and nitrogen metabolic processes, protein transport, cell cycle, and regulation of apoptosis were found to be significantly represented in chemical and comparative proteomic profiles (Figures 2 and 5). These results demonstrated that even in different cell lines (HT-29, Hep-2) the CIGB-552 antitumor effect is exerted by modulating similar biological processes.
Figure 5.

Functional association network that illustrates the biological processes significantly represented (p values < 0.05) in the proteomic profile modulated by CIGB-552 on HT-29 cells. Proteins were classified according to annotations of Gene Ontology database; the enrichment analysis was performed using the GeneCodis bioinformatic tool. The color of network nodes representing proteins is proportional to the fold change on CIGB-552-treated cells with respect to control.
Differentially expressed proteins related to apoptosis and cell cycle regulation support the CIGB-552 antitumor effect. Among them, the DNA replication licensing factor MCM6 (MCM6), the cyclin-G-associated kinase (GAK), and the S-phase kinase-associated protein 1 (SKP1), which function as positive regulators of cell cycle [25, 45, 46], were significantly downregulated after 40 min of CIGB-552 treatment.
As expected, on CIGB-552-treated cells, the apoptosis was a much later event than the negative regulation of cell cycle (Figure 6). Only after 2 h, the CIGB-552 treatment increased the expression of proapoptotic proteins. For instance, the voltage-dependent anion-selective channel protein 2 (VDAC2) was significantly upregulated after 2 h of CIGB-552 treatment. This protein is a component of the mitochondrial permeability transition pore complex, which releases apoptogenic factors, such as cytochrome C, during apoptosis [47, 48]. In line with this evidence, the expression of the cytochrome C-releasing factor 21 (GGCT) was increased sequentially on CIGB-552-treated cells, the upregulation being significant after 5 h of treatment. Furthermore, the expression of Bcl-2-associated transcription factor 1 (BCLAF1), a transcriptional repressor that promotes apoptosis [49, 50], was increased after 2 h of treatment with CIGB-552. Concomitant with upregulation of proapoptotic proteins, the expression of the major vault protein (MVP) was significantly decreased on HT-29 cells after 5 h of CIGB-552 treatment (Figure 5). MVP functions as a multidrug resistance factor [51–53]. Therefore, the downregulation of MVP could facilitate the proapoptotic effect in response to CIGB-552 treatment and overcome the chemotherapeutic resistance usually developed by cancer cells.
Figure 6.
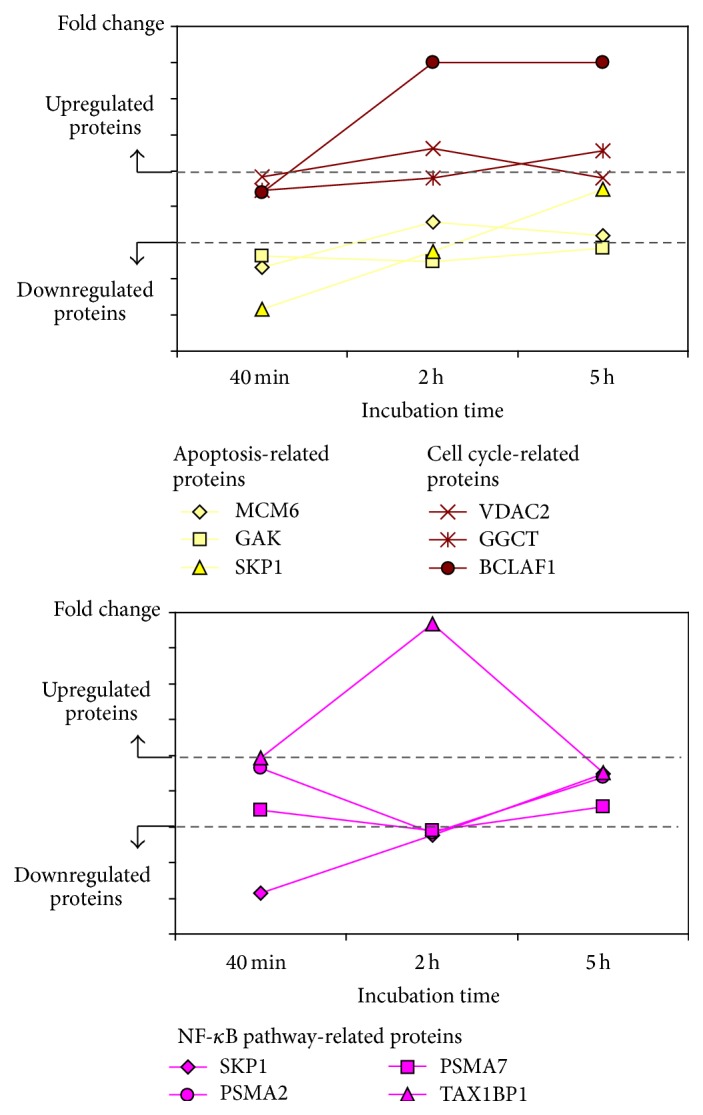
Identification of protein clusters related to cell cycle, apoptosis, and NF-κB signaling, which showed similar trends of differential expression over time.
Most of the proteins related to proteolysis were downregulated by CIGB-552 treatment (Figure 5). Two peptidase M16 family members, which have metalloendopeptidase activity, were identified: the mitochondrial-processing peptidase subunit beta (PMPCB) and nardilysin (NRD1). Particularly, NRD1 protein promotes cell growth and invasion of cancer cells [54, 55]. In the present work, Calpain-2 (CAPN2) and proprotein convertase subtilisin/kexin type 6 (PCSK6) were also identified. Both proteins are proteases related to tumor progression. CAPN2 upregulation increases the invasive potential of different tumor cells; such effect has been associated with secretion of matrix metalloproteinases (MMP-2 and MMP-9) [56–58]. Besides, in the tumor microenvironment, the inhibition of Calpain blocks angiogenesis [59]. PCSK6 substrates include precursors of cancer related proteins such as matrix metalloproteinases and the vascular endothelial growth factor (VEGF) [60]. Therefore, upregulation of PCSK6 increases the invasiveness of carcinoma cells [61–63]. Indeed inhibition of PCSK6 has been proposed as an anticancer therapeutic strategy [64, 65]. Altogether, the concomitant downregulation of NRD1, CAPN2, and PCSK6 suggests that CIGB-552 treatment could inhibit cancer cell invasion, exerting a potential antimetastatic effect. As previously mentioned, the antimetastatic effect of CIGB-552 is also supported by chemical proteomics results. To validate such hypothesis other studies have been conducted.
To analyze chemical proteomic data in combination with differentially expressed proteins, an interaction network was represented (Figure 7). According to interaction databases, 18 differentially modulated proteins interact with the potential CIGB-552 target profile (18 proteins). Prohibitin (PHB) interacts with three proteins included in the CIGB-552 target profile (ACTN1, SET, and C1QBP) (Figure 7). The expression of PHB, which is a negative regulator of cell proliferation [66], was increased on CIGB-552-treated cells. Besides, prefoldin subunit 3 (PFDN3), upregulated by CIGB-552 treatment, interacts with the acidic leucine-rich nuclear phosphoprotein 32 family member A (ANP32A) (Figure 7). It is a tumor suppressor protein [67] that was identified as a potential CIGB-552 target. Additionally, PFDN3 binds to von Hippel-Lindau protein (VHL), which regulates ubiquitination and proteasomal degradation of the hypoxia-inducible factor 1-alpha (HIF-α) [68]. Functional subnetworks of “negative regulation of cell cycle” and “response to hypoxia” were perturbed by CIGB-552 target profile (Table 2). Accordingly, such effects are supported by the upregulation of PHB and PFDN3 on HT-29 cells treated with CIGB-552.
Figure 7.

Protein-protein interaction network that represents the intersection between the chemical (triangle nodes) and the comparative (circular nodes) proteomics profiles. The network was represented using BisoGenet plugin, which retrieves interaction data from multiple databases. For network nodes representing differentially expressed proteins, the color is proportional to the fold change on CIGB-552-treated cells with respect to control.
The intersection between chemical proteomic data and differentially expressed proteins indicates potential mediators of CIGB-552 antitumor effect. The Rho GTPase-activating protein 1 (ARHGAP1) was identified as a potential CIGB-552 target (Figure 7). This protein inactivates signal transduction mediated by Rho-family GTPases, such as RhoA, Rac1, and CDC42 [69, 70]. Accordingly, the functional category of “small GTPase mediated signal transduction” was significantly represented in the proteomic profile modulated by CIGB-552 on HT-29 cells (Figure 5). In addition, ARHGAP1 interacts with Tax1-binding protein 1 (TAX1BP1) (Figure 7) [71]. The expression of TAX1BP1 was increased at 2 h of CIGB-552 treatment (Table 3). TAX1BP1, in conjugation with the zinc finger protein A20, the E3 ubiquitin-protein ligase Itch, and RING finger protein 11, constitutes the A20 ubiquitin-editing protein complex [72]. Downstream to Toll-like receptor 4 (TLR4) and tumor necrosis factor receptor 1 (TNFR1) the A20 complex inactivates TRAF6 and RIP1, repressing the NF-κB signaling pathway [73, 74]. Furthermore, in the present work, several potential CIGB-552 targets interact with TRAF6 (Figure 4). Altogether, these results suggest that CIGB-552 could inhibit the TRAF6/NF-κB axis.
Other proteins related to NF-κB signaling pathway were also modulated on HT-29 cells by CIGB-552. The S-phase kinase-associated protein 1 (SKP1) was downregulated at 40 min and 2 h after CIGB-552 treatment (Figure 7). This protein is an essential component of the SCF (SKP1-CUL1-F-box protein) E3 ubiquitin ligase complex, which mediates the ubiquitination of proteins involved in cell cycle progression, signal transduction, and transcription [75]. As part of SCF complex, the F-box/WD repeat-containing protein 1A (BTRC) ubiquitinates IκB leading to its proteasomal degradation and consequently NF-κB activation [76]. In the present work, the F-box protein BTRC was not identified. However, by decreasing the expression of SKP1, CIGB-552 could compromise the function of SCF complex. SKP1 is a proteasome interacting protein (Figure 7) [77]. The expression of two proteasome subunits (PSMA2, PSMA7) was decreased at 2 h of CIGB-552 treatment (Figure 7). Besides, several components of the proteasome complex, including the subunit PSMA2, were identified by chemical proteomics as potential CIGB-552 targets (Figure 3). Interestingly, modulation of SKP1 and proteasome subunits is concomitant with TAX1BP1 upregulation (Figure 6). These results suggest that CIGB-552 potentiates, at 2 h following treatment, the inhibition of NF-κB signaling pathway. Such effect is also supported by chemical proteomic results, as the “positive regulation of NF-κB transcription factor activity” is a functional subnetwork disrupted by the CIGB-552 target profile (Figure 4).
A potential mechanism of NF-κB inhibition by CIGB-552 was proposed based on both chemical and comparative proteomic profiles (Figure 8). Previous results demonstrated that CIGB-552 interacts with COMMD1 triggering the RelA ubiquitination [5]. Other potential CIGB-552 interactors include the proteins ETHE1 and SETD7. ETHE1 and SETD7, as well as COMMD1, regulate the function of RelA [40–42]. Therefore, CIGB-552 by interacting with ETHE1 and SETD7 could repress the transcription of NF-κB target genes (Figure 8). As the MAPK cascade increases the transcriptional activity of RelA [39], interaction between CIGB-552 and MAPKs proteins (MAP2K6, MAPK14) could also inhibit the NF-κB signaling pathway (Figure 8). Finally, the upregulation of TAX1BP1 and the downregulation of SKP1 induced by CIGB-552 are of great relevance. From a mechanistic view, the modulation of both proteins by CIGB-552 supports the inhibition of NF-κB signaling pathway (Figure 8).
Figure 8.

Proposed mechanism for NF-κB signaling inhibition mediated by the antitumor peptide CIGB-552. Different proteins, which regulate NF-κB pathway, were differentially modulated by CIGB-552 treatment (TAX1BP1, SKP1, PSMA2/A2, and PSMA7/A7). In addition, the CIGB-552 target profile includes proteins that regulate RelA function (ETHE1, SETD7, and MAPK signaling: MAP2K6, MAPK14). Such interactions ultimately could repress the transcription of NF-κB target genes. Altogether, by modulating the function of these proteins CIGB-552 could inhibit cell proliferation and induces apoptosis of tumor cells.
4. Conclusions
This study explored at the proteomic level the CIGB-552 antitumor mechanism of action. The CIGB-552 target profile was investigated in Hep-2 cells using a chemical proteomic approach. In total, 161 proteins were identified as potential CIGB-552 targets. This target profile was reduced to 55 proteins by a target deconvolution strategy. According to chemical proteomic results, CIGB-552 could be a multitarget drug. Downstream to drug-target interactions proteins that mediate cellular response to CIGB-552 treatment were identified by a comparative proteomic experiment including time series (40 min, 2 h, and 5 h). The proteomic profile modulated by CIGB-552 on HT-29 cells includes 72 differentially expressed proteins. The results of both experimental approaches, chemical and expression-based proteomics, were highly consistent. Proteins related to NF-κB signal transduction were identified as potential CIGB-552 targets and were significantly modulated by CIGB-552 treatment. Such findings are in line with previous results demonstrating that CIGB-552 blocks NF-κB signaling by upregulation of COMMD1 and consequently ubiquitination of RelA. The proteomic data revealed new mediators for NF-κB inhibition in response to CIGB-552 treatment. Proteins related to cell proliferation and apoptosis were identified by chemical and expression-based proteomics. These differentially expressed proteins could represent subrogate biomarkers of the CIGB-552 effect on tumor cells. The negative regulation of cell cycle and promotion of apoptosis seem to be early and late events, respectively, triggered by treatment with CIGB-552. Proteins related to cell invasion were differentially modulated on CIGB-552-treated cells. This biological process was also represented in the functional subnetworks perturbed by the potential CIGB-552 targets. Therefore, an antimetastatic effect could be expected as a consequence of CIGB-552 treatment. Further experiments are required to corroborate the role of identified proteins on mediating the anticancer effect of CIGB-552. Overall, the current study contributes to a better understanding of the CIGB-552 potentialities for cancer therapy.
Supplementary Material
Supplementary Table S1a contains the proteins purified on the CIGB-552 streptavidin sepharose matrix from the Hep-2 cell lysate.
Supplementary Table S1b contains the CRAPome information about the central proteome proteins which were identified as part of the CIGB-552 target profile.
Supplementary Table S2a contains biological processes enriched in the CIGB-552 target profile after target deconvolution.
Supplementary Table S2b contains cellular components enriched in the CIGB-552 target profile.
Supplementary Table S2c contains cellular components enriched in the CIGB-552 target profile after target deconvolution.
Supplementary Table S3 contains the proteomic profile modulated by CIGB-552 in HT-29 cells.
Acknowledgments
This work was supported by Heber Biotec SA. The Proteomic and Bioinformatics Departments at the Center for Genetic Engineering and Biotechnology would like to thank INSPUR Company (China) for their kind donation of a computer cluster used for data storage and processing.
Conflict of Interests
No potential conflict of interests was disclosed.
References
- 1.Albericio F., Kruger H. G. Therapeutic peptides. Future Medicinal Chemistry. 2012;4(12):1527–1531. doi: 10.4155/fmc.12.94. [DOI] [PubMed] [Google Scholar]
- 2.Wu D., Gao Y., Qi Y., Chen L., Ma Y., Li Y. Peptide-based cancer therapy: opportunity and challenge. Cancer Letters. 2014;351(1):13–22. doi: 10.1016/j.canlet.2014.05.002. [DOI] [PubMed] [Google Scholar]
- 3.Thundimadathil J. Cancer treatment using peptides: current therapies and future prospects. Journal of Amino Acids. 2012;2012:13. doi: 10.1155/2012/967347.967347 [DOI] [PMC free article] [PubMed] [Google Scholar]
- 4.Vallespi M. G., Fernandez J. R., Torrens I., et al. Identification of a novel antitumor peptide based on the screening of an Ala-library derived from the LALF32-51 region. Journal of Peptide Science. 2010;16(1):40–47. doi: 10.1002/psc.1192. [DOI] [PubMed] [Google Scholar]
- 5.Massó J. R. F., Argüelles B. P., Tejeda Y., et al. The antitumor peptide CIGB-552 increases COMMD1 and inhibits growth of human lung cancer cells. Journal of Amino Acids. 2013;2013:13. doi: 10.1155/2013/251398.251398 [DOI] [PMC free article] [PubMed] [Google Scholar]
- 6.Vallespí M. G., Pimentel G., Cabrales-Rico A., et al. Antitumor efficacy, pharmacokinetic and biodistribution studies of the anticancer peptide CIGB-552 in mouse models. Journal of Peptide Science. 2014;20(11):850–859. doi: 10.1002/psc.2676. [DOI] [PubMed] [Google Scholar]
- 7.Fields G. B., Noble R. L. Solid phase peptide synthesis utilizing 9-fluorenylmethoxycarbonyl amino acids. International Journal of Peptide and Protein Research. 1990;35(3):161–214. doi: 10.1111/j.1399-3011.1990.tb00939.x. [DOI] [PubMed] [Google Scholar]
- 8.Heukeshoven J., Dernick R. Characterization of a solvent system for separation of water-insoluble poliovirus proteins by reversed-phase high-performance liquid chromatography. Journal of Chromatography A. 1985;326:91–101. doi: 10.1016/S0021-9673(01)87434-3. [DOI] [PubMed] [Google Scholar]
- 9.Perkins D. N., Pappin D. J. C., Creasy D. M., Cottrell J. S. Probability-based protein identification by searching sequence databases using mass spectrometry data. Electrophoresis. 1999;20(18):3551–3567. doi: 10.1002/(sici)1522-2683(19991201)20:1860;3551::aid-elps355162;3.0.co;2-2. [DOI] [PubMed] [Google Scholar]
- 10.Tabas-Madrid D., Nogales-Cadenas R., Pascual-Montano A. GeneCodis3: a non-redundant and modular enrichment analysis tool for functional genomics. Nucleic Acids Research. 2012;40(1):W478–W483. doi: 10.1093/nar/gks402. [DOI] [PMC free article] [PubMed] [Google Scholar]
- 11.Ruepp A., Brauner B., Dunger-Kaltenbach I., et al. CORUM: the comprehensive resource of mammalian protein complexes. Nucleic Acids Research. 2008;36(1):D646–D650. doi: 10.1093/nar/gkm936. [DOI] [PMC free article] [PubMed] [Google Scholar]
- 12.Burkard T. R., Planyavsky M., Kaupe I., et al. Initial characterization of the human central proteome. BMC Systems Biology. 2011;5, article 17 doi: 10.1186/1752-0509-5-17. [DOI] [PMC free article] [PubMed] [Google Scholar]
- 13.Mellacheruvu D., Wright Z., Couzens A. L., et al. The CRAPome: a contaminant repository for affinity purification-mass spectrometry data. Nature Methods. 2013;10(8):730–736. doi: 10.1038/nmeth.2557. [DOI] [PMC free article] [PubMed] [Google Scholar]
- 14.Burkard T. R., Rix U., Breitwieser F. P., Superti-Furga G., Colinge J. A computational approach to analyze the mechanism of action of the kinase inhibitor bafetinib. PLoS Computational Biology. 2010;6(11) doi: 10.1371/journal.pcbi.1001001.e1001001 [DOI] [PMC free article] [PubMed] [Google Scholar]
- 15.Ishihama Y., Oda Y., Tabata T., et al. Exponentially modified protein abundance index (emPAI) for estimation of absolute protein amount in proteomics by the number of sequenced peptides per protein. Molecular and Cellular Proteomics. 2005;4(9):1265–1272. doi: 10.1074/mcp.m500061-mcp200. [DOI] [PubMed] [Google Scholar]
- 16.Spahr C. S., Davis M. T., McGinley M. D., et al. Towards defining the urinary proteome using liquid chromatography-tandem mass spectrometry. I. Profiling an unfractionated tryptic digest. Proteomics. 2001;1(1):93–107. doi: 10.1002/1615-9861(200101)1:1x003C;93::aid-prot93x0003e;3.0.co;2-3. [DOI] [PubMed] [Google Scholar]
- 17.Elias J. E., Gygi S. P. Target-decoy search strategy for increased confidence in large-scale protein identifications by mass spectrometry. Nature Methods. 2007;4(3):207–214. doi: 10.1038/nmeth1019. [DOI] [PubMed] [Google Scholar]
- 18.Fernandez-de-Cossio J., Gonzalez L. J., Satomi Y., et al. Isotopica: a tool for the calculation and viewing of complex isotopic envelopes. Nucleic Acids Research. 2004;32(supplement 2):W674–W678. doi: 10.1093/nar/gkh423. [DOI] [PMC free article] [PubMed] [Google Scholar]
- 19.Fernández-de-Cossio J., Gonzalez L. J., Satomi Y., et al. Automated interpretation of mass spectra of complex mixtures by matching of isotope peak distributions. Rapid Communications in Mass Spectrometry. 2004;18(20):2465–2472. doi: 10.1002/rcm.1647. [DOI] [PubMed] [Google Scholar]
- 20.Shannon P., Markiel A., Ozier O., et al. Cytoscape: a software environment for integrated models of biomolecular interaction networks. Genome Research. 2003;13(11):2498–2504. doi: 10.1101/gr.1239303. [DOI] [PMC free article] [PubMed] [Google Scholar]
- 21.Martin A., Ochagavia M. E., Rabasa L. C., Miranda J., Fernandez-de-Cossio J., Bringas R. BisoGenet: a new tool for gene network building, visualization and analysis. BMC Bioinformatics. 2010;11, article 91 doi: 10.1186/1471-2105-11-91. [DOI] [PMC free article] [PubMed] [Google Scholar]
- 22.Warsow G., Greber B., Falk S. S. I., et al. ExprEssence—revealing the essence of differential experimental data in the context of an interaction/regulation net-work. BMC Systems Biology. 2010;4, article 164 doi: 10.1186/1752-0509-4-164. [DOI] [PMC free article] [PubMed] [Google Scholar]
- 23.Chatrath P., Scott I. S., Morris L. S., et al. Aberrant expression of minichromosome maintenance protein-2 and Ki67 in laryngeal squamous epithelial lesions. British Journal of Cancer. 2003;89(6):1048–1054. doi: 10.1038/sj.bjc.6601234. [DOI] [PMC free article] [PubMed] [Google Scholar]
- 24.Kikuchi J., Kinoshita I., Shimizu Y., et al. Minichromosome maintenance (MCM) protein 4 as a marker for proliferation and its clinical and clinicopathological significance in non-small cell lung cancer. Lung Cancer. 2011;72(2):229–237. doi: 10.1016/j.lungcan.2010.08.020. [DOI] [PubMed] [Google Scholar]
- 25.Lei M. The MCM complex: its role in DNA replication and implications for cancer therapy. Current Cancer Drug Targets. 2005;5(5):365–380. doi: 10.2174/1568009054629654. [DOI] [PubMed] [Google Scholar]
- 26.Saydam O., Senol O., Schaaij-Visser T. B. M., et al. Comparative protein profiling reveals minichromosome maintenance (MCM) proteins as novel potential tumor markers for meningiomas. Journal of Proteome Research. 2010;9(1):485–494. doi: 10.1021/pr900834h. [DOI] [PMC free article] [PubMed] [Google Scholar]
- 27.Rix U., Superti-Furga G. Target profiling of small molecules by chemical proteomics. Nature Chemical Biology. 2009;5(9):616–624. doi: 10.1038/nchembio.216. [DOI] [PubMed] [Google Scholar]
- 28.Raida M. Drug target deconvolution by chemical proteomics. Current Opinion in Chemical Biology. 2011;15(4):570–575. doi: 10.1016/j.cbpa.2011.06.016. [DOI] [PubMed] [Google Scholar]
- 29.van de Sluis B., Mao X., Zhai Y., et al. COMMD1 disrupts HIF-1α/β dimerization and inhibits human tumor cell invasion. Journal of Clinical Investigation. 2010;120(6):2119–2130. doi: 10.1172/jci40583. [DOI] [PMC free article] [PubMed] [Google Scholar]
- 30.Rix U., Rix L. L. R., Terker A. S., et al. A comprehensive target selectivity survey of the BCR-ABL kinase inhibitor INNO-406 by kinase profiling and chemical proteomics in chronic myeloid leukemia cells. Leukemia. 2010;24(1):44–50. doi: 10.1038/leu.2009.228. [DOI] [PubMed] [Google Scholar]
- 31.Gilkes D. M., Semenza G. L., Wirtz D. Hypoxia and the extracellular matrix: drivers of tumour metastasis. Nature Reviews Cancer. 2014;14(6):430–439. doi: 10.1038/nrc3726. [DOI] [PMC free article] [PubMed] [Google Scholar]
- 32.Perkins N. D., Gilmore T. D. Good cop, bad cop: the different faces of NF-κB. Cell Death and Differentiation. 2006;13(5):759–772. doi: 10.1038/sj.cdd.4401838. [DOI] [PubMed] [Google Scholar]
- 33.Baldwin A. S. Control of oncogenesis and cancer therapy resistance by the transcription factor NF-kappaB. The Journal of Clinical Investigation. 2001;107(3):241–246. doi: 10.1172/jci11991. [DOI] [PMC free article] [PubMed] [Google Scholar]
- 34.Rayet B., Gélinas C. Aberrant rel/nfkb genes and activity in human cancer. Oncogene. 1999;18(49):6938–6947. doi: 10.1038/sj.onc.1203221. [DOI] [PubMed] [Google Scholar]
- 35.Liptay S., Weber C. K., Ludwig L., Wagner M., Adler G., Schmid R. M. Mitogenic and antiapoptotic role of constitutive NF-κB/Rel activity in pancreatic cancer. International Journal of Cancer. 2003;105(6):735–746. doi: 10.1002/ijc.11081. [DOI] [PubMed] [Google Scholar]
- 36.Huang C., Huang K., Wang C., et al. Overexpression of mitogen-activated protein kinase kinase 4 and nuclear factor-kappaB in laryngeal squamous cell carcinoma: a potential indicator for poor prognosis. Oncology Reports. 2009;22(1):89–95. doi: 10.3892/or_00000410. [DOI] [PubMed] [Google Scholar]
- 37.Lamothe B., Besse A., Campos A. D., Webster W. K., Wu H., Darnay B. G. Site-specific Lys-63-linked tumor necrosis factor receptor-associated factor 6 auto-ubiquitination is a critical determinant of IκB kinase activation. The Journal of Biological Chemistry. 2007;282(6):4102–4112. doi: 10.1074/jbc.m609503200. [DOI] [PMC free article] [PubMed] [Google Scholar]
- 38.Windheim M., Stafford M., Peggie M., Cohen P. Interleukin-1 (IL-1) induces the Lys63-linked polyubiquitination of IL-1 receptor-associated kinase 1 to facilitate NEMO binding and the activation of IκBα kinase. Molecular and Cellular Biology. 2008;28(5):1783–1791. doi: 10.1128/mcb.02380-06. [DOI] [PMC free article] [PubMed] [Google Scholar]
- 39.Vermeulen L., De Wilde G., Van Damme P., Berghe W. V., Haegeman G. Transcriptional activation of the NF-κB p65 subunit by mitogen- and stress-activated protein kinase-1 (MSK1) The EMBO Journal. 2003;22(6):1313–1324. doi: 10.1093/emboj/cdg139. [DOI] [PMC free article] [PubMed] [Google Scholar]
- 40.Higashitsuji H., Higashitsuji H., Nagao T., et al. A novel protein overexpressed in hepatoma accelerates export of NF-kappa B from the nucleus and inhibits p53-dependent apoptosis. Cancer Cell. 2002;2(4):335–346. doi: 10.1016/s1535-6108(02)00152-6. [DOI] [PubMed] [Google Scholar]
- 41.Li Y., Reddy M. A., Miao F., et al. Role of the histone H3 lysine 4 methyltransferase, SET7/9, in the regulation of NF-κB-dependent inflammatory genes. Relevance to diabetes and inflammation. Journal of Biological Chemistry. 2008;283(39):26771–26781. doi: 10.1074/jbc.m802800200. [DOI] [PMC free article] [PubMed] [Google Scholar]
- 42.Yang X.-D., Huang B., Li M., Lamb A., Kelleher N. L., Chen L.-F. Negative regulation of NF-κB action by Set9-mediated lysine methylation of the relA subunit. The EMBO Journal. 2009;28(8):1055–1066. doi: 10.1038/emboj.2009.55. [DOI] [PMC free article] [PubMed] [Google Scholar]
- 43.Libermann T. A., Baltimore D. Activation of interleukin-6 gene expression through the NF-κB transcription factor. Molecular and Cellular Biology. 1990;10(5):2327–2334. doi: 10.1128/mcb.10.5.2327. [DOI] [PMC free article] [PubMed] [Google Scholar]
- 44.Hoesel B., Schmid J. A. The complexity of NF-kappaB signaling in inflammation and cancer. Molecular Cancer. 2013;12, article 86 doi: 10.1186/1476-4598-12-86. [DOI] [PMC free article] [PubMed] [Google Scholar]
- 45.Tanenbaum M. E., Vallenius T., Geers E. F., Greene L., Mäkelä T. P., Medema R. H. Cyclin G-associated kinase promotes microtubule outgrowth from chromosomes during spindle assembly. Chromosoma. 2010;119(4):415–424. doi: 10.1007/s00412-010-0267-8. [DOI] [PMC free article] [PubMed] [Google Scholar]
- 46.Frescas D., Pagano M. Deregulated proteolysis by the F-box proteins SKP2 and β-TrCP: tipping the scales of cancer. Nature Reviews Cancer. 2008;8(6):438–449. doi: 10.1038/nrc2396. [DOI] [PMC free article] [PubMed] [Google Scholar]
- 47.Shimizu S., Narita M., Tsujimoto Y. Bcl-2 family proteins regulate the release of apoptogenic cytochrome c by the mitochondrial channel VDAC. Nature. 1999;399(6735):483–487. doi: 10.1038/20959. [DOI] [PubMed] [Google Scholar]
- 48.Tsujimoto Y., Shimizu S. The voltage-dependent anion channel: an essential player in apoptosis. Biochimie. 2002;84(2-3):187–193. doi: 10.1016/s0300-9084(02)01370-6. [DOI] [PubMed] [Google Scholar]
- 49.Kasof G. M., Goyal L., White E. Btf, a novel death-promoting transcriptional repressor that interacts with Bcl-2-related proteins. Molecular and Cellular Biology. 1999;19(6):4390–4404. doi: 10.1128/mcb.19.6.4390. [DOI] [PMC free article] [PubMed] [Google Scholar]
- 50.Liu H., Lu Z.-G., Miki Y., Yoshida K. Protein kinase C delta induces transcription of the TP53 tumor suppressor gene by controlling death-promoting factor Btf in the apoptotic response to DNA damage. Molecular and Cellular Biology. 2007;27(24):8480–8491. doi: 10.1128/mcb.01126-07. [DOI] [PMC free article] [PubMed] [Google Scholar]
- 51.Laurençot C. M., Scheffer G. L., Scheper R. J., Shoemaker R. H. Increased LRP mRNA expression is associated with the MDR phenotype in intrinsically resistant human cancer cell lines. International Journal of Cancer. 1997;72(6):1021–1026. doi: 10.1002/(sici)1097-0215(19970917)72:660;1021::aid-ijc1762;3.0.co;2-7. [DOI] [PubMed] [Google Scholar]
- 52.Tang S., Bai C., Yang P., Chen X. 14-3-3ε boosts bleomycin-induced DNA damage response by inhibiting the drug-resistant activity of MVP. Journal of Proteome Research. 2013;12(6):2511–2524. doi: 10.1021/pr301085c. [DOI] [PMC free article] [PubMed] [Google Scholar]
- 53.Losert A., Lötsch D., Lackner A., et al. The major vault protein mediates resistance to epidermal growth factor receptor inhibition in human hepatoma cells. Cancer Letters. 2012;319(2):164–172. doi: 10.1016/j.canlet.2012.01.002. [DOI] [PubMed] [Google Scholar]
- 54.Kanda K., Komekado H., Sawabu T., et al. Nardilysin and ADAM proteases promote gastric cancer cell growth by activating intrinsic cytokine signalling via enhanced ectodomain shedding of TNF-α . EMBO Molecular Medicine. 2012;4(5):396–411. doi: 10.1002/emmm.201200216. [DOI] [PMC free article] [PubMed] [Google Scholar]
- 55.Uraoka N., Oue N., Sakamoto N., et al. NRD1, which encodes nardilysin protein, promotes esophageal cancer cell invasion through induction of MMP2 and MMP3 expression. Cancer Science. 2014;105(1):134–140. doi: 10.1111/cas.12316. [DOI] [PMC free article] [PubMed] [Google Scholar]
- 56.Roumes H., Leloup L., Dargelos E., Brustis J.-J., Daury L., Cottin P. Calpains: markers of tumor aggressiveness? Experimental Cell Research. 2010;316(9):1587–1599. doi: 10.1016/j.yexcr.2010.02.017. [DOI] [PubMed] [Google Scholar]
- 57.Jang H. S., Lal S., Greenwood J. A. Calpain 2 is required for glioblastoma cell invasion: rRegulation of matrix metalloproteinase 2. Neurochemical Research. 2010;35(11):1796–1804. doi: 10.1007/s11064-010-0246-8. [DOI] [PMC free article] [PubMed] [Google Scholar]
- 58.Chen B., Tang J., Guo Y.-S., Li Y., Chen Z.-N., Jiang J.-L. Calpains are required for invasive and metastatic potentials of human HCC cells. Cell Biology International. 2013;37(7):643–652. doi: 10.1002/cbin.10062. [DOI] [PubMed] [Google Scholar]
- 59.Su Y., Cui Z., Li Z., Block E. R. Calpain-2 regulation of VEGF-mediated angiogenesis. The FASEB Journal. 2006;20(9):1443–1451. doi: 10.1096/fj.05-5354com. [DOI] [PubMed] [Google Scholar]
- 60.Bassi D. E., Fu J., de Cicco R. L., Klein-Szanto A. J. P. Proprotein convertases: “Master switches” in the regulation of tumor growth and progression. Molecular Carcinogenesis. 2005;44(3):151–161. doi: 10.1002/mc.20134. [DOI] [PubMed] [Google Scholar]
- 61.Lapierre M., Siegfried G., Scamuffa N., et al. Opposing function of the proprotein convertases furin and PACE4 on breast cancer cells' malignant phenotypes: role of tissue inhibitors of metalloproteinase-1. Cancer Research. 2007;67(19):9030–9034. doi: 10.1158/0008-5472.can-07-0807. [DOI] [PubMed] [Google Scholar]
- 62.Delic S., Lottmann N., Jetschke K., Reifenberger G., Riemenschneider M. J. Identification and functional validation of CDH11, PCSK6 and SH3GL3 as novel glioma invasion-associated candidate genes. Neuropathology and Applied Neurobiology. 2012;38(2):201–212. doi: 10.1111/j.1365-2990.2011.01207.x. [DOI] [PubMed] [Google Scholar]
- 63.Bassi D. E., Cenna J., Zhang J., Cukierman E., Klein-Szanto A. J. Enhanced aggressiveness of benzopyrene-induced squamous carcinomas in transgenic mice overexpressing the proprotein convertase PACE4 (PCSK6) Molecular Carcinogenesis. 2015;54(10):1122–1131. doi: 10.1002/mc.22183. [DOI] [PMC free article] [PubMed] [Google Scholar]
- 64.Couture F., Levesque C., Dumulon-Perreault V., et al. PACE4-based molecular targeting of prostate cancer using an engineered 64Cu-radiolabeled peptide inhibitor. Neoplasia. 2014;16(8):634–643. doi: 10.1016/j.neo.2014.07.010. [DOI] [PMC free article] [PubMed] [Google Scholar]
- 65.Bassi D. E., Zhang J., Cenna J., Litwin S., Cukierman E., Klein-Szanto A. J. P. Proprotein convertase inhibition results in decreased skin cell proliferation, tumorigenesis, and metastasis. Neoplasia. 2010;12(7):516–526. doi: 10.1593/neo.92030. [DOI] [PMC free article] [PubMed] [Google Scholar]
- 66.Wang S., Zhang B., Faller D. V. Prohibitin requires Brg-1 and Brm for the repression of E2F and cell growth. The EMBO Journal. 2002;21(12):3019–3028. doi: 10.1093/emboj/cdf302. [DOI] [PMC free article] [PubMed] [Google Scholar]
- 67.Pan W., de Graca L. S., Shao Y., Yin Q., Wu H., Jiang X. PHAPI/pp32 suppresses tumorigenesis by stimulating apoptosis. The Journal of Biological Chemistry. 2009;284(11):6946–6954. doi: 10.1074/jbc.m805801200. [DOI] [PMC free article] [PubMed] [Google Scholar]
- 68.Tsuchiya H., Iseda T., Hino O. Identification of a novel protein (VBP-1) binding to the von Hippel-Lindau (VHL) tumor suppressor gene product. Cancer Research. 1996;56(13):2881–2885. [PubMed] [Google Scholar]
- 69.Lancaster C. A., Taylor-Harris P. M., Self A. J., Brill S., Van Erp H. E., Hall A. Characterization of rhoGAP: a GTPase-activating protein for rho-related small GTPases. The Journal of Biological Chemistry. 1994;269(2):1137–1142. [PubMed] [Google Scholar]
- 70.Lazarini M., Traina F., Machado-Neto J. A., et al. ARHGAP21 is a RhoGAP for RhoA and RhoC with a role in proliferation and migration of prostate adenocarcinoma cells. Biochimica et Biophysica Acta - Molecular Basis of Disease. 2013;1832(2):365–374. doi: 10.1016/j.bbadis.2012.11.010. [DOI] [PubMed] [Google Scholar]
- 71.Nagaraja G. M., Kandpal R. P. Chromosome 13q12 encoded Rho GTPase activating protein suppresses growth of breast carcinoma cells, and yeast two-hybrid screen shows its interaction with several proteins. Biochemical and Biophysical Research Communications. 2004;313(3):654–665. doi: 10.1016/j.bbrc.2003.12.001. [DOI] [PubMed] [Google Scholar]
- 72.Jacque E., Ley S. C. RNF11, a new piece in the A20 puzzle. The EMBO Journal. 2009;28(5):455–456. doi: 10.1038/emboj.2009.18. [DOI] [PMC free article] [PubMed] [Google Scholar]
- 73.Shembade N., Ma A., Harhaj E. W. Inhibition of NF-κB signaling by A20 through disruption of ubiquitin enzyme complexes. Science. 2010;327(5969):1135–1139. doi: 10.1126/science.1182364. [DOI] [PMC free article] [PubMed] [Google Scholar]
- 74.Wartz I. E., O'Rourke K. M., Zhou H., et al. De-ubiquitination and ubiquitin ligase domains of A20 downregulate NF-κB signalling. Nature. 2004;430(7000):694–699. doi: 10.1038/nature02794. [DOI] [PubMed] [Google Scholar]
- 75.Yoshida Y., Murakami A., Tanaka K. Skp1 stabilizes the conformation of F-box proteins. Biochemical and Biophysical Research Communications. 2011;410(1):24–28. doi: 10.1016/j.bbrc.2011.05.098. [DOI] [PubMed] [Google Scholar]
- 76.Shirane M., Hatakeyama S., Hattori K., Nakayama K., Nakayama K. Common pathway for the ubiquitination of IkappaBalpha, IkappaBbeta, and IkappaBepsilon mediated by the F-box protein FWD1. The Journal of Biological Chemistry. 1999;274(40):28169–28174. doi: 10.1074/jbc.274.40.28169. [DOI] [PubMed] [Google Scholar]
- 77.Bousquet-Dubouch M.-P., Baudelet E., Guérin F., et al. Affinity purification strategy to capture human endogenous proteasome complexes diversity and to identify proteasome-interacting proteins. Molecular & Cellular Proteomics. 2009;8(5):1150–1164. doi: 10.1074/mcp.m800193-mcp200. [DOI] [PMC free article] [PubMed] [Google Scholar]
Associated Data
This section collects any data citations, data availability statements, or supplementary materials included in this article.
Supplementary Materials
Supplementary Table S1a contains the proteins purified on the CIGB-552 streptavidin sepharose matrix from the Hep-2 cell lysate.
Supplementary Table S1b contains the CRAPome information about the central proteome proteins which were identified as part of the CIGB-552 target profile.
Supplementary Table S2a contains biological processes enriched in the CIGB-552 target profile after target deconvolution.
Supplementary Table S2b contains cellular components enriched in the CIGB-552 target profile.
Supplementary Table S2c contains cellular components enriched in the CIGB-552 target profile after target deconvolution.
Supplementary Table S3 contains the proteomic profile modulated by CIGB-552 in HT-29 cells.