Abstract
The ATP-binding cassette transporter-2 (ABCA2) is a member of a family of multipass transmembrane proteins that use the energy of ATP hydrolysis to transport substrates across membrane bilayers. ABCA2 has also been genetically linked with Alzheimer’s disease but the molecular mechanisms are unknown. In this report, we hypothesized that ABCA2 modulation of sphingolipid metabolism activates a signaling pathway that regulates amyloid precursor protein transcription. We found that ABCA2 overexpression in N2a cells was associated with increased mass of the sphingolipid sphingosine, derived from the catabolism of ceramide. ABCA2 overexpression increased in vitro alkaline and acid ceramidase activity. Sphingosine is a physiological inhibitor of protein kinase C (PKC) activity. Pharmacological inhibition of ceramidase activity or activation PKC activity with 12-myristate 13-acetate (PMA) or diacylglycerol (DAG) decreased endogenous APP mRNA levels in ABCA2 overexpressing cells. Treatment with PMA also decreased the expression of a transfected human APP promoter reporter construct, while treatment with a general PKC inhibitor, GF109203x, increased APP promoter activity. In N2a cells, chromatin immunoprecipitation experiments revealed that a repressive complex forms at the AP-1 site in the human APP promoter, consisting of c-jun, c-jun dimerization protein 2 (JDP2) and HDAC3 and this complex was reduced in ABCA2 overexpressing cells. Activation of the human APP promoter in A2 cells was directed by the upstream stimulatory factors USF-1 and USF-2 that bound to an E-box element in vivo. These findings indicate that ABCA2 overexpression modulates sphingosine levels and regulates transcription of the endogenous APP gene.
Keywords: ABCA2, APP, Alzheimer’s, transcription, sphingosine, PKC
Introduction
Alzheimer’s disease (AD), a neurological disorder characterized by memory loss and progressive cognitive decline, is a global public health malady affecting tens of millions of individuals worldwide and for which there is no effective cure or preventive therapeutic regimen. A major strategy to develop effective therapeutics is to identify disease-modifying targets of cellular pathways that modulate the presymptomatic stages of the disease to prevent or delay the onset of the more severe symptoms. A prevailing hypothesis (“Amyloid hypothesis”) of Alzheimer’s disease etiology suggests that the elaboration and accumulation of proteolytic Aβ peptide fragments of approximately 39–42 amino acids, derived from the amyloid precursor protein (APP) are the neurotoxic agents in the brain that are responsible for cognitive decline [1]. The Aβ fragments, in soluble oligomeric form or in insoluble fibrillar assemblies, mediate many of the neuropathological lesions observed in human AD brain, i.e., deposition of Aβ in plaques in brain parenchyma and cerebrovasculature and the formation of intraneuronal neurofibrillary tangles composed of hyperphosphorylated microtubule-associated tau protein (NFT) [2].
Although many therapeutic strategies to ameliorate the degenerative effects of Aβ production have focused on APP processing, e.g., targeting the secretase enzymes that cleave the APP holoprotein to its neurotoxic metabolites, we have considered an alternative approach by investigating the mechanisms responsible for production of the APP holoprotein itself and to identify molecular targets that modulate APP synthesis. In fact, surprisingly few human genes have been identified whose expression alone is sufficient to modulate APP expression. One such gene may be the ATP-binding cassette transporter-2 (ABCA2).
The ATP-binding cassette transporters are a large family, ~ 48 genes divided into seven families A-G [3, 4]. The eukaryotic transporters are either “full-transporters” or “half-transporters. The full transporters contain two hydrophobic multi-pass α-helical transmembrane domains (TMDs) and two nucleotide-binding domains (NBDs) that bind and hydrolyze ATP to pump substrates across lipid bilayers. The half-transporters contain a single TMD and NBD and function as homodimers or heterodimers with other half-transporters. The ABC “A” subfamily, including ABCA2, are full transporters and contain 13 members that transport sterols, phospholipids and bile acids [5–7]. ABCA2 is a “full transporter” that is comprised of two hydrophobic multi-pass α-helical transmembrane domains (six per TMD) and two nucleotide-binding domains (NBD-1 and NBD-2) that bind and hydrolyze ATP. The nucleotide binding domains contain the signature Walker A and Walker B motifs separated by an ABC “ signature” motif that is characteristic of ABC transporters [8].
ABCA2 has been genetically linked with Alzheimer’s disease but the molecular mechanisms are unknown. In humans, two independent groups have identified the same single nucleotide polymorphism (SNP) at amino acid position 679 (rs908832) of ABCA2, in both early-onset (Familial AD or FAD) and late-onset or sporadic Alzheimer’s disease [9, 10]. The mutation is a synonymous mutation, i.e., transition of U to C that does not change the acidic amino acid residue (aspartic acid) incorporated into the ABCA2 protein. In contrast, the Minster group reported that in a small set of early-onset subjects, there was no association of the ABCA2 (rs908832) SNP with AD [11]. The biochemical and cellular effects of (rs908832) SNP on ABCA2 function and AD remain to be explored.
We previously reported that the ABCA2 transporter was abundant in the gray matter of the frontal cortex of human AD brains compared to normal controls but was detected at lower concentrations in the parietal, occipital and cerebellar regions [12]. Our group also reported that overexpression of ABCA2 in human embryonic kidney cells (HEK) was associated with increased expression of genes associated with AD, including the amyloid precursor protein (APP), the most significant biological marker for AD pathology [12]. The Michaki group found that knockdown of endogenous ABCA2 in mammalian cells in vitro, in Drosophila melanogaster cells and in mice reduced Aβ production [13].
Numerous studies have suggested a role for ABC transporters, altered cholesterol homeostasis in the brain and the etiology of Alzheimer’s disease [14–16]. Work in this laboratory has revealed that ABCA2 functions to regulate intracellular cholesterol metabolism and trafficking and suggests a possible mechanistic link between ABCA2 and AD [17, 18]. We also determined that stable overexpression of ABCA2 in mouse N2a neuroblastoma cells was associated a ~ 2-fold increase in the production of the 100 kDa APP holoprotein and carboxy-terminal 11–14 kDa peptide fragments as well as neurotoxic Aβ fragments [19]. We also reported that the increase in APP holoprotein was due to increased steady state levels of APP mRNA in ABCA2 overexpressing N2a cells and not due to decreased mRNA turnover. In addition, transient transfection of a human APP promoter luciferase construct into ABCA2 overexpressing N2a cells resulted in increased reporter gene activity compared to control N2a cells.
In addition to cholesterol, sphingolipids are key components of cellular membranes, whose metabolism regulates membrane structure, intracellular trafficking and signaling pathways and have also been implicated in the etiology of Alzheimer’s disease [20]. Two groups have generated ABCA2 knockout mice [21, 22]. Both Tew and Sakai groups observed a distinct shaking phenotype, termed “Skittish” and analysis of brain lipids by the Sakai group reported age-related deficiencies in phosphatidylethanolamine (PE) and phosphatidylserine (PS), sphingomyelin (SM) and a doubling of ganglioside GM1.
We have recently described a novel role for ABCA2 in modulation of sphingolipid metabolism in neural cells. The ABCA2 expression level in neural cells was associated with changes in the mass of many ceramide species as well as ceramide metabolites [23].
In this report, we hypothesized that ABCA2-mediated changes in sphingolipid metabolism would activate a signaling pathway that regulates amyloid precursor protein transcription. We found that ABCA2 overexpression in N2a cells was associated with increased mass of sphingosine that is generated by catabolism of ceramide by organelle-specific ceramidase enzymes. ABCA2 overexpression increased in vitro alkaline and acid ceramidase activities. Sphingosine is a physiological inhibitor of protein kinase C (PKC) activity [24]. Pharmacological inhibition of ceramidase activity or activation PKC activity with 12-myristate 13-acetate (PMA) or diacylglycerol (DAG) was associated with decreased endogenous APP transcription in ABCA2 overexpressing cells, while inhibition of PKC activity with the general PKC inhibitor, GF109203x, increased human APP promoter expression. ABCA2 overexpression was associated with changes in the expression level and in vivo binding of key transcription factors to the endogenous APP gene promoter. These factors regulate APP promoter activity at activator protein-1 (AP-1) and upstream stimulatory factor (USF) sites. These findings indicate that ABCA2 overexpression modulates sphingolipid levels and regulates transcription of the APP gene. Elevated ABCA2 expression levels may provide a mechanistic link between altered sphingolipid metabolism, APP mRNA levels, Aβ production and Alzheimer’s disease.
Materials
Dulbecco’s Modified Eagle medium (DMEM), Ham’s F12 and fetal bovine serum (FBS) were obtained from Hyclone. Glutamine and Penstrep were obtained from Fisher. C12-NBD-ceramide and diacylglycerol (DAG) were from Avanti Polar Lipids. Protein kinase C activator 12-myristate 13 acetate (PMA), PKC inhibitor GF109203X and ceramidase inhibitor Ceranib-1 were from Tocris bioscience. The CHIP-IT express kit was from ActiveMotif. The Dual-luciferase promoter assay kit was from Promega. The AP-1 and USF expression constructs were from Origene. The A-USF expression construct was from Addgene.
Cell lines and culture
The N2a mouse neuroblastoma cell line was obtained from ATCC (CCL-131). Cells were grown in DMEM/Ham’s F12 (50:50) supplemented with 5% fetal bovine serum (FBS) 2 mM glutamine and 1% Penstrep at 37° C and 5% CO2. N2a cell lines stably expressing a 7.4-kilobase human ABCA2 cDNA in the pcDNA5/FRT/TO vector (Invitrogen) have been previously described [18, 19, 23].
Western Blot
Cells were lysed in radioimmunoprecipitation (RIPA) buffer (150 mM NaCl, 1% Triton X-100, 1% sodium deoxycholate, 50 mM Tris-HCl, pH 7.5, 2 mM EDTA, RIPA) supplemented with HALT protease inhibitor cocktail (Thermo Scientific/Pierce). Protein concentrations were determined using the DC-protein assay kit (Bio-Rad). For Western blot of proteins described in figures, 25 μg of protein were fractionated on 4–12% NuPAGE gels. Following gel electrophoresis, proteins were transferred to nitrocellulose membranes and probed with primary rabbit polyclonal antibodies: phospho-c-jun, phospho-c-fos, JunB (Cell Signal, 1:1000), USF-1 and USF-2 (Santa Cruz Biotech, 1:1000), JDP2 (Santa Cruz Biotech, 1:1000) protein kinase Cδ (C-17, Santa Cruz Biotech, 1:1000), protein kinase Cε (C-15, Santa Cruz Biotech, 1:1000), or mouse monoclonal antibody to β-Actin (1:1000, Santa Cruz Biotech). Secondary antibodies were goat anti-rabbit- or anti-mouse horseradish peroxidase (HRP) (Thermo Scientific/Pierce, 1:1000). Blots were developed using the Clarity Western ECL substrate (Bio-Rad) and imaged using the ChemiDoc XRS+ imager and Image Lab software (Bio-Rad).
Real-Time PCR
On day 0, 3 × 10⁶ cells were plated in 10 ml of DMEM/F12, 5% fetal bovine serum (FBS), 2 mM glutamine 1% Penstrep (medium A) in 100 mm dishes. On day 0, the medium was replaced with medium A, in which the FBS was reduced to 0.1% (medium B). Cells were cultured for 6 hours before recovery by trypsinization. Cells were washed in phosphate buffered saline (PBS) and total RNA was recovered using the Absolutely RNA kit (Agilent) and the concentration of RNA determined by absorbance at A260 using a Bio-Rad spectrophotometer. Two micrograms of total RNA from each experimental sample were reverse transcribed using random primers for 90 min at 42° C with AffinityScript reverse transcriptase (Agilent). One hundred nanograms of cDNA from each sample were amplified by real-time PCR with mouse-specific APP primers, sense 5′ GGCTCTGGAGGTACCCACTGAT 3′, antisense 5′ GGTTGGCTTCCACCACGTTTGT 3′ to generate a 221 bp product and 18 S primers sense 5′ ATGCTCTTAGCTGAGTGTCC 3′, antisense 5′ AACTACGACGGTATCTGATC 3′ to generate a 311 bp product. IQ SybrGreen PCR Supermix (Bio-Rad) was used for PCR reactions with the following program: 95° C for 30 sec, 60° C for 30 sec, 72° C for 1 min for 40 cycles. The concentration of the expression level for each sample was determined from the threshold cycle CT, which is the cycle where an increase in PCR product is first detected at a statistically significant level. The relative expression for each gene is obtained by comparing the CT values for each gene using the equation 2−ΔΔCT. N2a cells samples not treated with pharmacological reagents served as the calibrator and the CT for 18S rRNA was subtracted from the CT value for each sample. The relative quantification was calculated by the equation 2−AverageΔΔCT. Data are presented as the mean ± standard deviation (SD) of triplicate determinations of three experiments. Statistical significance was determined using the Student’s t test, p < 0.05 (StatPlus, AnalystSoft).
Luciferase Reporter Gene Assays
On day 0, 0.3 × 10⁶ cells were plated in 2 ml medium A in 6-well plates. On day 0, the medium was replaced with 1 ml of OptiPrep medium (Invitrogen). The human APP promoter construct consisted of a region from −488 to +100 base pairs relative to the transcription start site [25] subcloned into the pGL3 basic firefly luciferase reporter gene (Promega). Site-directed mutagenesis (TGATTCA to TCCTTCA) of the AP-1 element located at −350 base pairs upstream of the transcription start site was performed with sense primer, 5′ GGGTCGGATCCTTCAAGCTCACGGG 3′ and antisense primer 5′ CCCCTGAGCTTGAAGGATCCGACCC 3′ using the Quickchange XL kit. Site-directed mutagenesis of the E-box element (CANNTGAC consensus) located at position −49 bp (CAGCTGA to TCGTGCT) was performed with sense primer 5′ GGGTGGGCCGGAATCGTGCTCTCGCCTGGCTC 3′ and antisense primer 5′ GAGCCAGGCGAGAGCACGATTCCGGCCCACCC 3′ using the Quickchange XL kit (Agilent). For transfection, 140 fmol of human APP firefly luciferase promoter construct: wild type, AP-1 mutant or E-box mutant were co-transfected with 25 ng of pRL SV40 Renilla luciferase and polyethylenimine (PEI) transfection reagent at a 9:1 N/P ratio. After 4 hours, the cells were washed and the medium was replaced with 1 ml of medium B and the cells were cultured for a total of 24 hours post-transfection before recovery of cell lysates for analysis. The c-jun, c-fos, JunB, or fra-2 expression constructs were transfected in the amounts described in figure legends. USF-1, USF-2 or A-USF expression constructs were co-transfected (15 fmol) with the wild type or E-box mutant human APP promoter constructs. Luciferase activity was determined on an aliquot of the cell lysates using the Dual-Luciferase assays system (Promega) and a Berthold luminometer. The relative luciferase activity per sample was determined as the ratio of the APP pGL3 firefly luciferase signal to the co-transfected pRL SV40 Renilla luciferase signal. Data were obtained from a minimum of three transfection experiments and is presented as the mean ± standard deviation (SD).
Chromatin Immunoprecipitation (CHIP)
The CHIP assay was performed using the CHIP-IT Express kit (Active Motif) according to procedures described in the protocol. Cells were grown to 80% confluency in 150 mm dishes in medium A followed by fixation in medium A containing 1% formaldehyde for 10 min at room temperature followed by washing in ice-cold PBS and addition of glycine Stop-Fix solution for 5 min. Cells were scraped in ice-cold scraping solution containing phenylmethanesulfonyl fluoride (PMSF) and centrifuged at 720 × g for 10 min at 4° C. The cell pellet was resuspended in 1 ml ice-cold lysis buffer supplemented with complete protease inhibitor cocktail and PMSF and incubated on ice for 30 min. The cell homogenate was subjected to 10 strokes of a Dounce homogenizer, and centrifuged at 2400 × g for 10 min 4° C to pellet the nuclei. The nuclear pellet was resuspended in 350 μl of Shearing Buffer supplemented with PMSF and complete protease inhibitor. Enzymatic shearing cocktail was added and the reaction proceeded for 15 min. The reaction was stopped by addition of ice-cold 0.5 M EDTA and chilled on ice for 10 min. The sheared DNA samples (200–1500 bp as verified by gel electrophoresis) were centrifuged at 18,000 × g for 10 min at 4° C and the supernatants were used for the assay. The DNA concentration was determined on an aliquot using a spectrophotometer and the CHIP assay was performed using 15 μg of sheared chromatin, 1–3 μg of IgG control antibody, c-jun, c-fos, JDP2, HDAC3, USF-1 or USF-2 antibodies and protein G spin columns in a 100–200 μl reaction volume for 4 hours at 4° C. Following washing the chromatin was eluted, cross-links reversed and the samples treated with proteinase K for 1 hour at 37° C. PCR was performed on the eluate using primers: AP-1: sense 5′ TGGCGTGAAGGGTGACCTCCTA 3′, antisense 5′ GAGTGATCTGGGAGAG 3′ that generates a 300 bp product and E-box: sense 5′ CTCCCGACTTCCCTGGAACCTT 3′, antisense 5′ GCCGCCGAGGAAAACTGACAGAG 3′ that generates a 300 bp product. The PCR cycling parameters were (Hold) 95° C 2 min, (35 cycles) 95° C 15 sec, 65° C 30 sec, 72° C 1 min. The PCR products were run on a 2% agarose gel and photographed.
Sphingosine mass by electrospray ionization/mass spec/mass spectrometry (ESI/MS/MS)
Analysis of sphingolipids was performed on a Thermo Finnigan TSQ 7000 triple quadrupole mass spectrometer, operating in a multiple reaction monitoring positive ionization mode. Total cells, fortified with a set of internal standards, were extracted with ethyl acetate/isopropanol/water (60/30/10, v/v). The lipid extracts were dried under N2 and reconstituted in 100 μl of methanol. The reconstituted samples were injected into the Survayor/TSQ 7000 liquid chromatography/mass spectrometry system with the BDS Hypersil C8, 150 × 3.2 mm, 3-μm particle size column and eluted with a 1.0 mM methanolic ammonium formate/2 mM aqueous ammonium formate mobile phase system. The peaks for the target lipids and internal standards were collected and processed using an Xcalibur software system. Calibration curves were constructed by plotting peak area ratios of the target lipids to their respective internal standard against concentration, using a linear regression model. The results are expressed as the mean ± SD of three determinations. Statistical significance was determined using the Student’s t test, p < 0.05.
In vitro ceramidase activity assay
In vitro ceramidase activity assays were performed as previously described [26, 27]. On day 0, 4 × 10⁶ cells were plated in 150 mm dishes in medium A. On day 2 cells were scraped in ice-cold PBS and centrifuged at 200 × g to pellet. Cells were resuspended in ceramidase lysis buffer (0.3% Triton X-100, 100 mM Tris-HCl, pH 8.5 for alkaline ceramidase, Tris-HCl, pH 7.0 for neutral ceramidase and Tris-HCl, pH 4.0 for acidic ceramidase and 0.25 M sucrose) and subjected to Dounce homogenization. The cell homogenate was centrifuged at 1000 × g for 10 min and the supernatant was recovered for the assay. The protein concentration was determined by the DC-protein assay (Bio-Rad). For the assay, 2.5 nmol of C12-NBD-ceramide (Avanti Lipids) was evaporated to dryness under N2 and 50 μl of 2X reaction buffer (200 mM Tris-HCl, pH 8.5 for alkaline ceramidase, Tris-HCl pH 7.0 for neutral ceramidase and Tris-HCl pH 4.0 for acid ceramidase; 0.6% Triton X-100) was added. The mixture was sonicated in a water bath for 30 min to completely dissolve the C12-NBD-ceramide. To begin the reaction, 50 μl of protein substrate (12.5, 25, 50 or 100 μg of protein and lysis buffer) were added and the reaction was incubated for 1 hour at 37° C. The reaction was stopped by the addition of 300 μl of chloroform/methanol (1:1) and the organic phase was recovered and dried under vacuum. The dried lipids were resuspended in chloroform/methanol (1:1), spotted on silica gel 60 TLC plates and developed in chloroform/methanol/NH4OH (90:20:0.5). The TLC plate was imaged on a Storm 840 phosphorimager (GE Biosciences) with PMT voltage set at 600 and digital chemifluorescent images were quantified using ImageQuant software (GE Biosciences). In vitro ceramidase activity was determined as the mean fluorescence intensity of NBD-dodecanoic acid formation in cell extracts and normalized to the intensity determined in N2a cells containing 12.5 μg protein and was the mean of three independent experiments ± SD. Statistical significance was determined using the Student’s t test, p < 0.05.
Results
Increase in Sphingosine mass in ABCA2 overexpressing cells
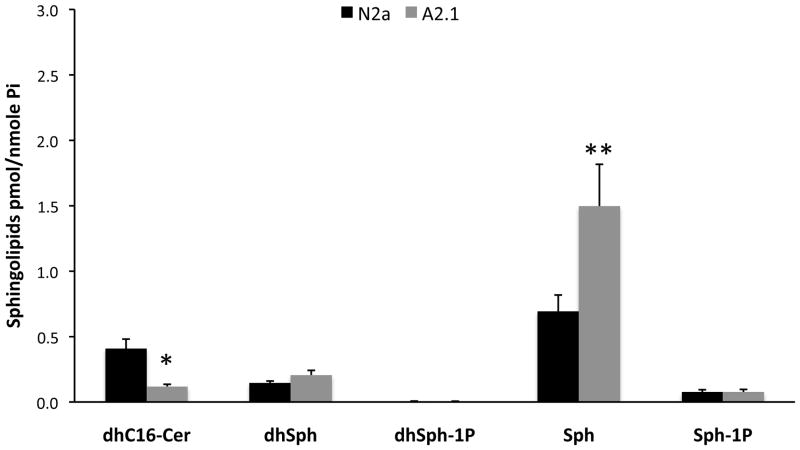
We have previously reported the effects of ABCA2 expression on overall cellular levels of the sphingolipids ceramide and sphingomyelin in N2a and A2 cells through a comprehensive lipidomic analysis of metabolites using electrospray ionization/mass spectrometry ESI/MS/MS [23]. We reported that in A2 cells, the mass of total ceramide species declined from 13.24 pmol/nmol Pi to 8.62 pmol/nmol Pi. To determine whether the decline in ceramide species was associated with in an increase in sphingosine, which is generated through deacylation of ceramide in the catabolic pathway of ceramide metabolism, we performed an analysis of the mass of additional sphingolipids, including sphingosine, using ESI/MS/MS. The mass of dihydro-C16 ceramide, a precursor of ceramide in the de novo synthetic pathway declined from 0.41 pmol/nmol Pi in N2a cells to 0.12 pmol/nmol Pi in A2 cells (*) ± SD 0.016, p < 0.02 (Fig. 1). In contrast, the mass of sphingosine, the product of ceramidase enzymes, more than doubled from 0.694 pmol/nmole Pi in N2a cells to 1.497 pmol/nmole Pi in A2 cells (**) ± SD 0.319 p < 0.027). Interestingly, the mass of 24:0 ceramide-1 phosphate (CIP) declined from 0.222 pmol/nmol Pi in N2a cells to 0.89 pmol/nmol Pi in A2 cells (± SD 0.022 p < 0.0016) and the mass of 24:1 ceramide-1 phosphate declined from 0.161 pmol/nmol Pi in N2a cells to 0.06 pmol/nmol Pi in A2 cells (± SD 0.018 p < 0.004). C1P is the product of ceramide kinase activity. A decrease in the mass of CIP in ABCA2 overexpressing cells is consistent with the hypothesis that ABCA2 functions to alter the membrane bilayer distribution of the ceramide substrate, modulating its topological proximity to the respective ceramidase and ceramide kinase enzymes. The levels of other sphingolipid metabolites did not differ significantly in N2a and A2 cells. These results indicate that ABCA2 overexpression increases the mass of the sphingosine, providing further evidence for a role of ABCA2 in modulation of intracellular sphingolipid homeostasis.
Figure 1. Analysis of sphingolipid levels in N2a and A2 cells.
Total lipids were extracted from the cells and subjected to electrospray ionization/mass spectrometry analysis as described in Methods. The levels of sphingolipids were determined and normalized to Pi concentrations. Results are the mean sphingolipid mass in N2a and A2 cells ± SD. Statistical significance was determined using the Student’s t test, p < 0.05.
ABCA2 increases in vitro ceramidase activity
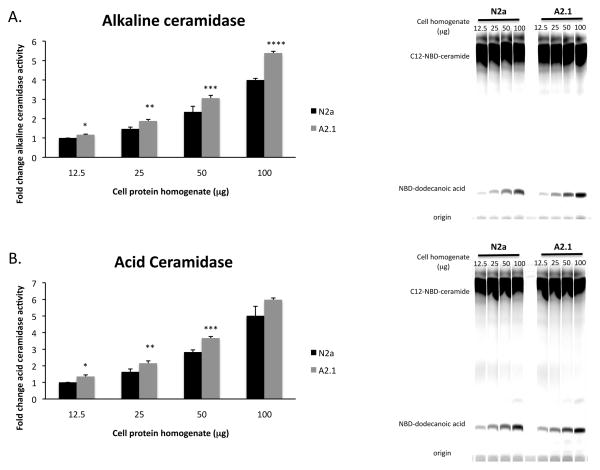
Ceramide can be deacylated to sphingosine by ceramidases (acidic, neutral, alkaline) that differ in subcellular localization, substrate specificity and pH optima [28]. Acid ceramidase, ASAH1, catalyzes the conversion of ceramide to sphingosine in the salvage/recycling pathway in late-endosomes. The neutral ceramidase, ASAH2, is localized to the plasma membrane and is an important regulator of the conversion of ceramide to sphingosine and sphingosine-1-phosphate. The alkaline ceramidase family includes three members, ACER1, 2, 3 that differ in subcellular localization and substrate specificity. Alkaline ceramidase-1 (ACER1) catalyzes the deacylation of unsaturated very long-chain C24:1 ceramide more efficiently than C24:0 ceramide. Alkaline ceramidase-2 (ACER2) is localized to the Golgi apparatus and has less substrate specificity than ACER1 or ACER3, metabolizing long-chain saturated and unsaturated ceramides. Alkaline ceramidase-3 (ACER3) is localized to the Golgi apparatus and endoplasmic reticulum and uses primarily phytoceramides and unsaturated long-chain ceramides/dihydroceramides as substrates [29]. To determine if ABCA2 overexpression modulates ceramidase activity, in vitro ceramidase activity assays were performed that measured the conversion of the fluorescent C12-NBD-ceramide substrate to NBD-dodecanoic acid in cell homogenates [26, 27]. ABCA2 overexpression increased alkaline ceramidase activity: 12.5 μg protein (*) 1.16-fold ± SD = 0.027 p < 0.008; 25 μg protein (**) 1.28-fold ± SD = 0.076 p < 0.004; 50 μg protein (***) 1.3-fold ± SD = 0.14 p < 0.031, 100 μg protein (****) 1.35-fold ± SD = 0.088 p < 0.001 (Fig. 2A). ABCA2 overexpression increased acid ceramidase activity: 12.5 μg protein: 12.5 μg protein (*) 1.35 ± SD = 0.023 p < 0.023; 25 μg protein (**) 1.32 ± SD = 0.095 p < 0.023; 50 μg protein (***) 1.28 ± SD = 0.015 p < 0.001; 100 μg protein: 1.19 ± SD = 0.095 p < 0.102 (Fig 2B). ABCA2 overexpression did not alter neutral ceramidase activity. These results indicate that ABCA2 overexpression increased in vitro acid and alkaline ceramidase activity and suggest a mechanism for the increased production of sphingosine from ceramide catabolism.
Figure 2. ABCA2 increases in vitro ceramidase activity.
In vitro alkaline and acid ceramidase activities were measured on cell protein homogenates using precursor C12-NBD-ceramide and the NBD-dodecanoic product was quantified by thin layer chromatography as described in Methods. (A) Alkaline ceramidase activity: change in the level of NBD-dodecanoic acid formation in A2 homogenates relative to N2a at each protein concentration. Data are expressed as fold-increase in densitometry units/mg protein/hour. (B) Acid ceramidase activity: change in the level of NBD-dodecanoic acid formation in A2 homogenates relative to N2a at each protein concentration. Data are expressed as fold-increase in densitometry units/mg protein/hour in A2 cells compared to N2a cells. Statistical significance was determined using the Student’s t test, p < 0.05.
Treatment with ceramidase inhibitor ceranib-1 decreases APP mRNA levels
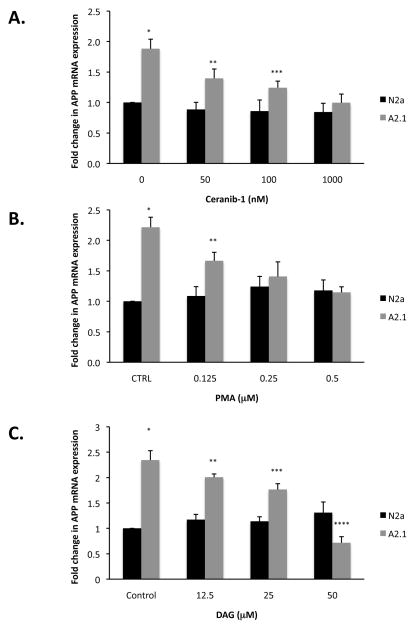
The ceramidase inhibitor ceranib-1 blocks the conversion of ceramide to sphingosine by the ceramidase enzymes [30]. To determine whether pharmacological inhibition of ceramidase reduces APP mRNA levels, cells were treated with increasing amounts of ceranib-1 and real-time reverse transcription-PCR with APP-specific primers was performed. Ceranib-1 treatment resulted in a dose-dependent fold-decrease in APP mRNA level in ABCA2 overexpressing cells relative to N2a cells: Untreated (*): 1.88 ± SD = 0.16 p < 0.01; 50 nM (**): 1.58 ± SD = 0.15 p < 0.009; 100 nM (***): 1.45 ± SD = 0.11 p < 0.05; 1 μM: 1.12 ± SD = 0.14 p = 0.26. (Fig. 3A). These results indicate that pharmacological inhibition of ceramidase activity, resulting in decreased catabolism of ceramide to sphingosine, negatively regulates APP mRNA level in ABCA2 overexpressing cells.
Figure 3. Treatment with ceramidase inhibitor ceranib-1, PKC activators 12-myristate 13-acetate (PMA) and diacylglycerol (DAG) decrease APP mRNA in ABCA2-overexpressing cells.
Cells were treated with increasing concentrations of ceranib-1 (A), PMA (B), or DAG (C) for 6 hours and total RNA was recovered from cell homogenates. Real-time PCR for relative APP mRNA was performed on total RNA and quantified as described in Methods. Results are the mean fold-change in APP mRNA expression in A2 cells compared to N2a cells ± SD of ≥ three experiments. Statistical significance was determined using the Student’s t test, p < 0.05.
PKC activators 12-myristate 13-acetate (PMA) and diacylglycerol (DAG) decrease APP mRNA in ABCA2 overexpressing cells
To investigate the signaling pathways that may mediate the increase in APP mRNA in cells overexpressing ABCA2, we hypothesized that protein kinase C may be involved, since it is negatively regulated by sphingosine [24]. We expected that pharmacological activation of PKC with the phorbol ester PMA would produce the opposite effect on APP mRNA transcription, i.e., reduce APP mRNA levels. Treatment with PMA generated a dose-dependent fold-decrease in APP mRNA levels in ABCA2 overexpressing cells relative to N2a cells: Untreated (*): 2.21 ± SD = 0.16 p < 0.005; 0.125 μM (**): 1.52 ± SD = 0.14 p < 0.008; 0.25 μM: 1.13 ± SD = 0.24 p = 0.386; 0.5 μM: 0.97 ± SD = 0.09 p = 0.802 (Fig. 3B). In a complementary approach, we evaluated the effects of treatment of cells with DAG, a physiological activator of PKC [18]. Similarly, DAG generated a dose-dependent fold-decrease in APP mRNA levels in ABCA2 overexpressing cells relative to N2a cells: Untreated (*): 2.34 ± SD = 0.16 p < 0.005, 12.5 μM (**): 1.71 ± SD = 0.185 p < 0.006, 25 μM (***): 1.54 ± SD = 0.115 p < 0.001; 50 μM (****): 0.546 ± SD = 0.119 p < 0.023 (Fig. 3C). These results indicate that pharmacological activation of PKC with PMA or treatment with DAG, a physiological activator of PKC, both reduce the level of APP mRNA in ABCA2 overexpressing cells.
Mass of protein kinase C isoforms PKCδ and PKCε is reduced in ABCA2 overexpressing cells
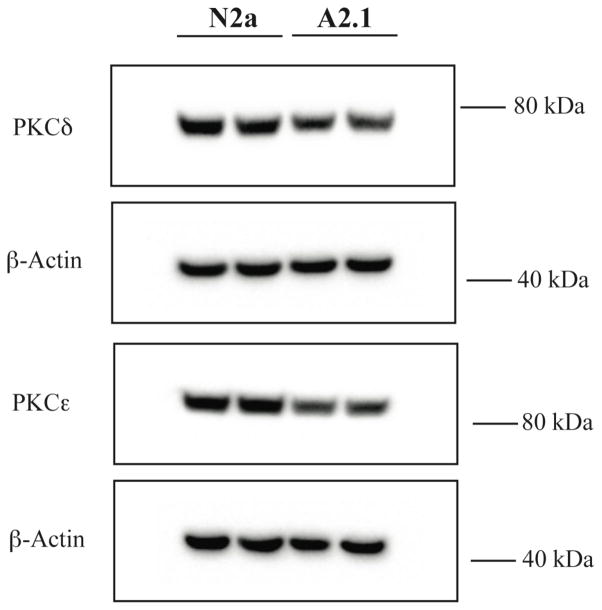
Experiments to evaluate the principal PKC isoforms in N2a cells indicated that the level of the PKCδ and PKCε species were significantly more abundant that other PKC isoforms evaluated (e.g. α, β). The mass of PKCδ declined ~ 17% (± SD 4.93) in ABCA2 overexpressing cells compared to N2a cells and PKCε mass declined ~ 39 % (± SD 0.65) in ABCA2 overexpressing cells compared to N2a cells (Fig. 4). These results are consistent with the hypothesis that a decrease in the mass of PKC isoforms may be contribute to the elevation of APP mRNA levels in ABCA2 overexpressing cells.
Figure 4. Mass of protein kinase C isoforms PKCδ and PKCε is reduced in ABCA2-overexpressing cells.
Protein lysates from N2a, A2 cells were fractionated on 4–12% NuPAGE gels transferred to nitrocellulose and probed by Western blot with the PKCδ antibody (78 kDa) and PKCε antibody (90 kDa). The results are the mean % change in protein mass in A2 cells compared to N2a cells ± SD of duplicate determinations.
Expression of the human APP promoter is regulated by PKC activity
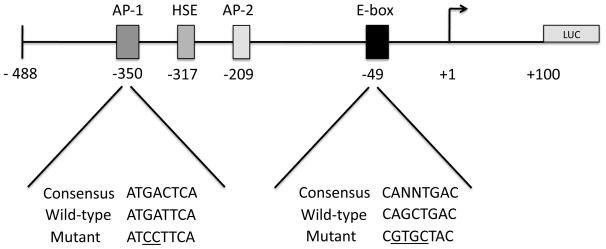
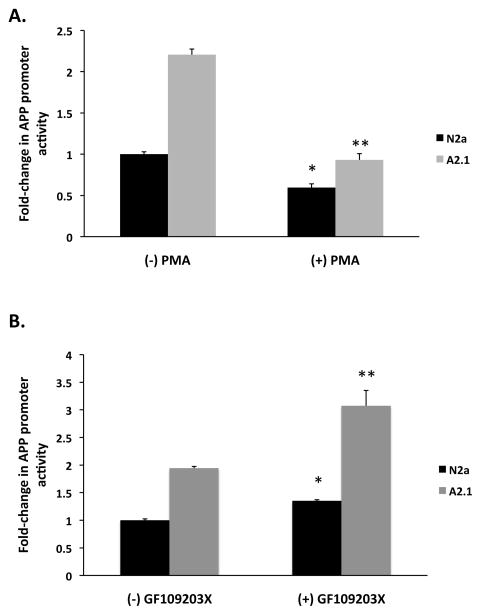
We investigated whether expression of a human APP luciferase promoter construct was modulated by PKC activity. We utilized an extensively characterized human APP promoter construct consisting of a region −488 base pairs to +100 base pairs relative to the transcription start site (Fig. 5) [25, 31–33]. This region of the human APP promoter has been demonstrated to direct high levels of APP promoter reporter gene activity in many cell lines and contains several regulatory elements, including an AP-1 site at position −350 base pairs and an E-box site at position −49 base pairs that bind multiple transcription factors including c-jun, and upstream stimulatory factor (USF) proteins. We treated cells with 125 nM PMA for 6 hours and assayed for luciferase activity in cell homogenates. PMA treatment reduced human APP promoter luciferase activity 0.4-fold in N2a cells, (*) ± SD 0.045, p < 0.001) and 0.58-fold in A2 cells, (**) ± SD 0.074, p < 0.001 (Fig. 6). We hypothesized that pharmacological inhibition of PKC activity would produce the opposite effect of PKC activation with PMA and increase APP promoter reporter gene activity. In these experiments we treated cells with the general PKC inhibitor, GF109203x (bisindoylmaleimide) [34]. Inhibition of PKC with GF109203x increased human APP promoter luciferase activity by 1.35-fold in N2a cells, (*) ± SD 0.024, p < 0.001 and by 1.13-fold in A2 cells, (**) ± SD 0.28, p < 0.019 (Fig. 6). These results indicate that modulation of PKC activity is sufficient to regulate transcription from the human APP promoter in N2a and A2 cells.
Figure 5. Model of human APP promoter construct consisting of a region −488 base pairs to +100 base pairs relative to the transcription start site.
Shown is a region of the human APP promoter subcloned in the pGL3 basic luciferase reporter vector used in these studies. DNA binding sites are depicted for Activator Protein(s)-1 (AP-1) at position −350 base pairs, Heat shock element (HSE) at position −317 base pairs, Activator Protein-2 (AP-2) at position −209 base pairs and E-box (USF binding site) at position −49 base pairs. Below the AP-1 and E-box binding sites are the DNA sequences for the consensus site, wild-type APP promoter site and mutant sites used in these studies.
Figure 6. The human APP promoter is regulated by PKC activity.
Cells were transiently transfected with the human APP luciferase promoter construct. Cells were treated with 125 nM PMA (A) during the last 6 hours of culture or (B) 10 μM GF109203X during last 24 hours of culture. Cell homogenates were assayed for APP promoter activity, as described in Methods. Results are the mean fold-change in APP promoter activity in A2 cells compared N2a cells ± SD of three determinations. Statistical significance was determined using the Student’s t test, p < 0.05.
AP-1 proteins mediate activation of APP promoter expression
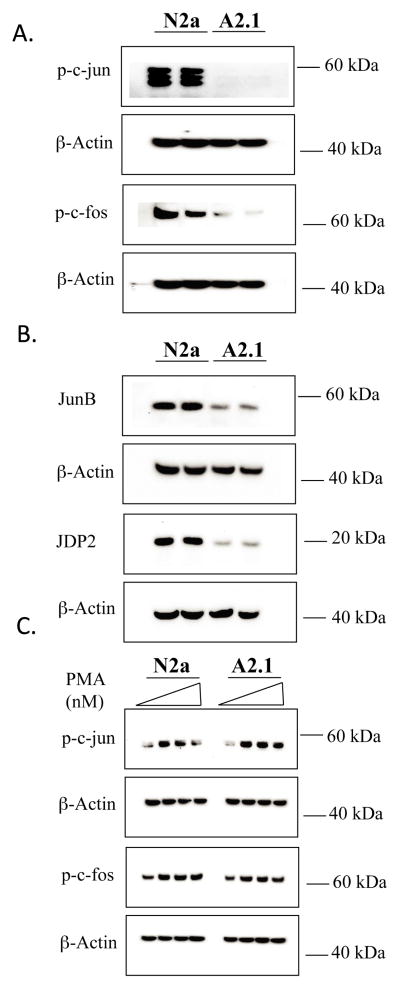
The APP promoter in mouse, rat and human contains an AP-1 regulatory element (TGATTCA) that binds a number of proteins including c-jun, c-fos, JunB, fra-2 that form homodimers or heterodimers to modulate transcriptional activity [35, 36]. The distal AP-1 element in the human APP promoter has been reported to bind c-jun as a homodimer in response to PMA and activate transcription in non-neuronal astroglial cells [32]. To determine if ABCA2 overexpression modulated the level of AP-1 proteins, we performed Western blot on cell homogenates. The steady-state mass of the transcriptionally active phosphorylated forms of c-jun and c-fos and JunB decreased in A2.1 cells relative to the level in N2a cells (c-jun: 37 % ± SD 7.0, p <0.001), (c-fos: 48.32% ± SD 19.2, p < 0.015) and (JunB: 41.72% ± SD 0.98, p < 0.001) (Fig. 7A). These results indicate that ABCA2 expression is sufficient to modulate the level of AP-1 proteins that regulate APP gene expression.
Figure 7. Western blot of AP-1 proteins in N2a and A2 cells.
Whole cell homogenates from N2a and A2 cells were fractionated on 4–12% NuPAGE gels transferred to nitrocellulose and probed by Western blot with antibodies to (A) phospho-c-jun (48 kDa), phospho-c-fos (62 kDa); (B) JunB (42 kDa), or JDP2 (19 kDa). (C) N2a and A2 cells were treated with increasing amounts of PMA for 6 hours, nuclear homogenates were prepared and Western blot was performed with antibodies to phospho-c-jun and phospho-c-fos. The results are the mean % change in protein mass in A2 cells compared to N2a cells ± SD ≥ 3 determinations. Statistical significance was determined using the Student’s t test, p < 0.05.
PMA induces the expression of the AP-1 proteins in many cell types [37, 38]. To evaluate if PMA induced AP-1 protein expression in N2a and A2 cells, PMA (125 nM to 500 nM) was administered for 6 hours and Western blot performed on cell homogenates. PMA treatment increased the expression of the transcriptionally active phosphorylated forms c-jun and c-fos in both N2a and A2 cells (Fig. 7C).
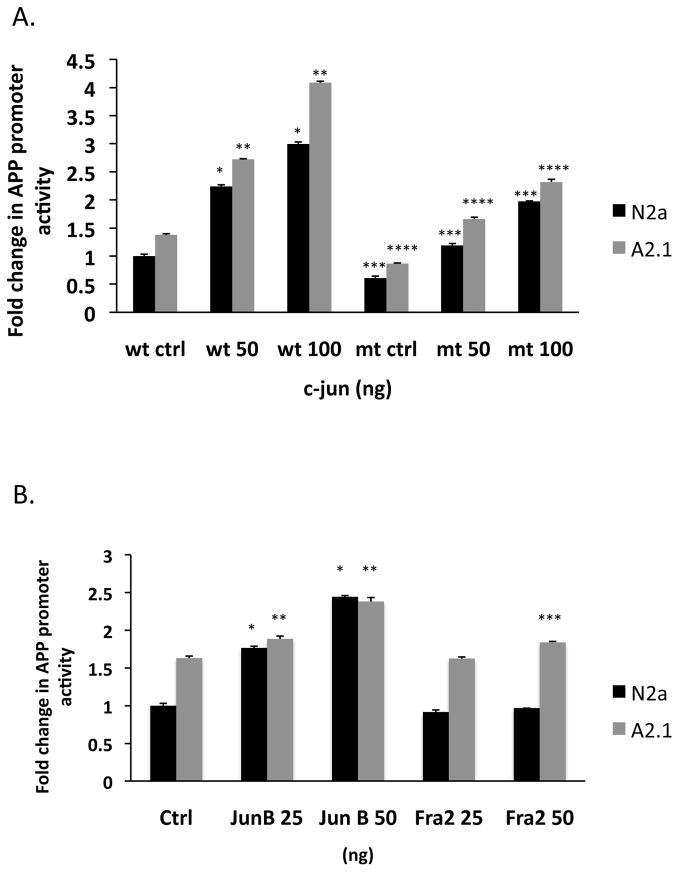
To determine whether the c-jun factor functioned as a transcriptional activator of the human APP promoter, we transiently transfected a c-jun expression construct into N2a and A2 cells and measured promoter activity. Transfection of c-jun dose-dependently increased the fold-expression of the APP promoter in both N2a (50 ng: 2.24 ± SD 0.027, * p < 0.001; 100 ng: 3.0 ± SD 0.039, * p < 0.001) and A2 cells (50 ng: 2.72 ± SD 0.014, ** p < 0.001; 100 ng: 4.09 ± SD 0.024, ** p < 0.001) (Fig. 8). In contrast, mutation of the AP-1 site, using the previously described mutation (TGATTCA to TCCTTCA) in the APP promoter that prevents AP-1 protein binding [32], reduced APP promoter activity by ~ 50 % in both N2a (ctrl: 0.609 ± SD 0.035, *** p < 0.001; 50 ng: 1.18 ± SD 0.037, *** p < 0.001; 100 ng: 1.97 ± SD 0.092, *** p < 0.001) and A2 cells (ctrl: 0.86 ± SD 0.013, **** p < 0.001; 50 ng: 1.66 ± SD 0.031, **** p < 0.001; 100 ng: 2.32 ± SD 0.048, **** p < 0.001). Transfection of a JunB expression construct also dose-dependently increased the fold-activation of the APP promoter in N2a cells (25 ng: 1.76 ± SD 0.024, * p < 0.001; 50 ng: 2.44 ± SD 0.014, * p < 0.001) and A2 cells (25 ng: 1.88 ± SD 0.036, ** p < 0.003; 50 ng: 2.38 ± SD 0.052, ** p < 0.001). Transfection of a fra-2 expression construct did not increase the fold-activation of the APP promoter in N2a cells (25 ng: 0.92 ± SD 0.026, p < 0.008; 50 ng: 0.97 ± SD 0.008, p < 0.072) but slightly increased expression A2 cells at higher concentrations (25 ng: 1.62 ± SD 0.022, p = 0.327; 50 ng: 1.84 ± SD 0.012, *** p < 0.001). These findings confirm that c-jun, JunB and fra2 can function as transcriptional activators of the human APP promoter in N2a and A2 cells.
Figure 8. AP-1 proteins modulate human APP promoter activity in N2a and A2 cells.
The AP-1 element, TGATTCA at position −350 base pairs upstream of the transcription start site was mutated to TCCTTCA by site-directed mutagenesis. (A) Cells were co-transfected with the wild-type human APP promoter or AP-1-site mutant APP promoter constructs and increasing concentrations of a c-jun expression construct. (B) Cells were transfected the wild-type human APP promoter with increasing concentrations of a JunB or Fra-2 expression constructs. Cell homogenates were assayed for APP promoter activity, as described in Methods. Results are the mean fold-change in APP promoter activity in A2 cells compared to N2a cells ± SD of four determinations. Statistical significance was determined using the Student’s t test, p < 0.05.
To resolve the apparent paradox in ABCA2 overexpressing cells, i.e., PMA activation of PKC mediating transcriptional repression of APP mRNA levels and human APP promoter activity, while increasing the expression level of the AP-1 transcriptional activators c-jun, and c-fos, we hypothesized that transcriptional repression may occur at the AP-1 site in control N2a cells that is reduced or absent in A2 cells. To investigate a possible mechanism for selective repression of transcription at the AP-1 site, we measured the expression level of the AP-1 repressor protein, jun-dimerization protein-2 (JDP2). JDP2 binds to the AP-1 site either as a homodimer or heterodimer with c-jun protein but does not bind c-fos and functions to repress AP-1-dependent transcriptional activity [35]. JDP2 can repress AP-1-dependent transcription by recruiting histone deacetylase complex, HDAC3 to the promoter [39] and inhibiting p300-mediated histone acetylation by histone acetyltransferase (HAT)[40]. JDP2 levels were reduced in A2 cells (39.52 % ± SD 3.96, p < 0.001) relative to N2a cells (Fig. 7). These results suggest that elevation of APP transcription in A2 cells may be due to a relief from repression mediated by JDP2 at the AP-1 site in the APP gene.
Chromatin immunoprecipitation of AP-1 site proteins indicates presence of transcriptional repression complex in vivo on APP gene in N2a cells
To determine whether a transcriptional repressive complex is assembled at the AP-1 site in the endogenous APP gene in vivo, we performed chromatin immunoprecipitation (CHIP) with antibodies to AP-1 transcription factors and regulators. CHIP analysis indicated that the levels of c-jun bound to the AP-1 site were elevated in A2 cells relative to N2a cells (Fig. 9). The levels of c-fos did not differ significantly between N2 and A2 and this is consistent with the previous report that c-jun binds and activates the distal AP-1 site primarily as c-jun-c-jun homodimers that do not contain c-fos. Importantly, the levels of JDP2 and HDAC3 bound to the AP-1 site were both increased in N2a cells relative to A2 cells. These findings are consistent with the hypothesis that a repressive complex of c-jun/JDP2/HDAC3 or JDP2/HDAC3 is formed over the AP-1 site in N2a cells that is reduced in ABCA2 overexpressing cells.
Figure 9. AP-1 and USF proteins bind the endogenous APP promoter in vivo.
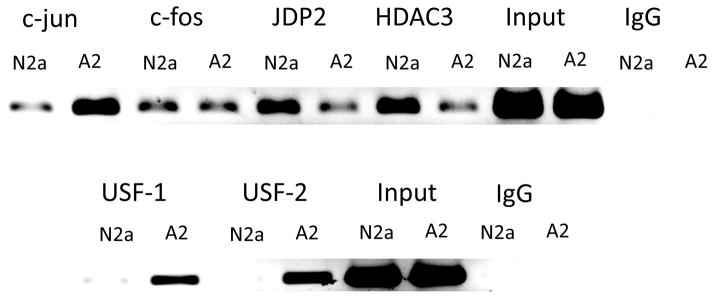
Chromatin immunoprecipitation for determination of in vivo binding of AP-1 and USF proteins to the endogenous APP promoter was performed as described in Methods. (A) CHIP of c-jun, c-fos, JDP2 and HDAC3. (B) CHIP of USF-1 and USF-2. The experiments were performed ≥ 2 times.
USF proteins positively regulate APP promoter activity through an E-box element in the APP promoter
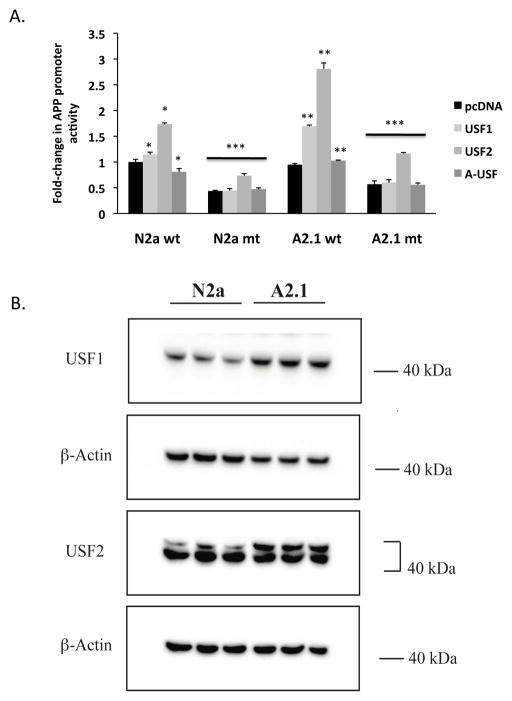
To investigate if the elevation of APP transcription in ABCA2 overexpressing cells is due to transcriptional activators binding to a positive regulatory element in the human APP promoter, we evaluated an E-box element CAGCTGA (consensus CANNTG) present at −49 base pairs upstream of the transcription start site and conserved in human and murine APP promoters that binds the positive regulators USF-1 and USF-2 [41–43]. Transient transfection of an USF-1 expression construct dose-dependently increased the fold-activation of the APP promoter in both N2a cells (1.055 ± SD 0.059, * p < 0.002) and A2.1 cells (2.25 ± SD 0.04, **p < 0.001) (Fig. 10A). Transient transfection of an USF-2 expression construct dose-dependently increased the fold-activation of the APP promoter in both N2a cells (1.537 ± SD 0.009, * p < 0.002) and A2.1 cells (3.855 ± SD 0.059, **p < 0.001). In contrast, transient transfection of the dominant negative A-USF factor that binds the E-box but does not form active heterodimers with USF-1 or USF-2 did not activate transcription in either N2a cells (0.765 ± SD 0.009, * p < 0.03) or A2 cells (1.78 ± SD 0.023, **p < 0.001). Mutation of the E-box element reduced the fold-activation of the APP promoter in both N2a cells (ctrl: 0.558 ± SD 0.014, *** p < 0.001; USF1: 0.572 ± SD 0.017, *** p < 0.001; USF2: 0.758 ± SD 0.068, *** p < 0.001; AUSF: 0.524 ± SD 0.06, *** p < 0.001) and A2 cells 1(ctrl: 0.827 ± SD 0.027, *** p < 0.001; USF1: 0.875 ± SD 0.092, *** p < 0.001; USF2: 1.324 ± SD 0.048, *** p < 0.001; AUSF: 0.868 ± SD 0.01, *** p < 0.001). These results indicate that the USF-1 and USF-2 transcription factors but not the dominant-negative A-USF factor transcriptionally activate the APP promoter through the E-box element in N2a and A2 cells.
Figure 10. (A) USF proteins positively regulate APP promoter activity through an E-box element in the APP promoter.
The E-box element, CAGCTGA (consensus CANNTG) at position −49 base pairs upstream of the transcription start site was mutated to CGTGCTAC by site-directed mutagenesis. Cells were co-transfected with the wild-type APP promoter or APP E-box mutant promoter constructs and USF-1, USF-2 or dominant-negative A-USF expression constructs. Cell homogenates were assayed for fold-change in APP promoter activity as described in Methods. Results are the mean ± SD of six determinations. Statistical significance was determined using the Student’s t test, p < 0.05. (B) ABCA2 overexpression increases mass of USF-1 and USF-2 transcription factors. Protein lysates from N2a, A2 cells were fractionated on 4–12% NuPAGE gels transferred to nitrocellulose and probed by Western blot with the USF-1 antibody (43 kDa) and USF-2 antibody (44 kDa). The results are the mean % change in protein mass in A2 cells compared to N2a cells ± SD ≥ 3 determinations. Statistical significance was determined using the Student’s t test, p < 0.05.
ABCA2 overexpression increases mass of USF-1 and USF-2 transcription factors
To determine whether ABCA2 overexpression modulated the steady-state expression level of USF-1 and USF-2 factors, Western blot was performed on cell homogenates. The mass of both USF-1 and USF-2 transcription factors were elevated in A2 cells compared to N2a cells (USF1: 146 % ± SD 7.9, p < 0.012) (USF2: 340% ± SD 39.2, p < 0.003) (Fig. 10B). For USF-2, the upper band at ~ 46 kDa represents the transcriptionally active phosphorylated form of the protein that was increased in A2 cells. These findings are consistent with the hypothesis that ABCA2 overexpression increases the level of transcription factors that positively regulate APP promoter expression at the E-box element.
USF-1 and USF-2 bind to the endogenous APP promoter in vivo
To determine whether the USF-1 and USF-2 factors bound the endogenous APP gene promoter in vivo, chromatin immunoprecipitation was performed with specific antibodies. The level of both USF-1 and USF-2, bound to the E-Box site in vivo, were increased in ABCA2 overexpressing cells (Fig. 9). These results indicate that ABCA2 overexpression elevates transcription of the human APP promoter by increasing the level of USF-1 and USF-2 protein binding in vivo to the promoter of the endogenous APP gene at the E-box site and function as transcriptional activators.
Model of ABCA2 regulation of APP transcription
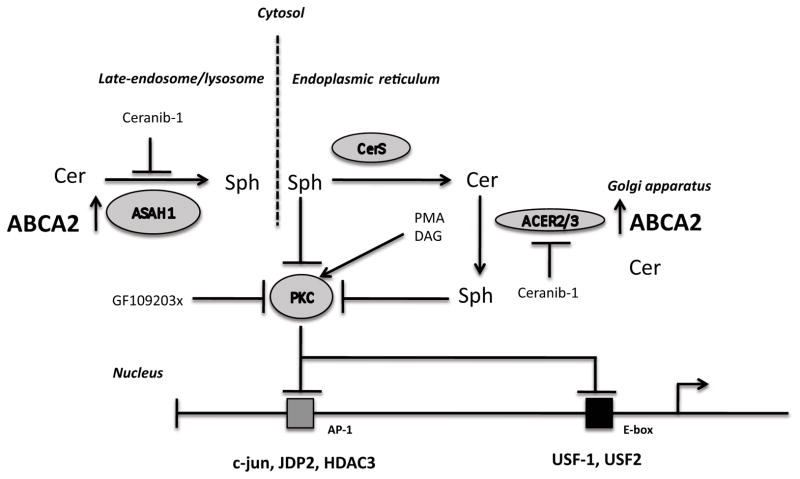
A model of ABCA2 overexpression positively regulating APP transcriptional activity is presented and described in the figure legend (Fig. 11).
Figure 11. Model of proposed mechanism for the elevation of APP mRNA in ABCA2-overexpressing N2a cells.
ABCA2 overexpression reduces the in vivo binding of JDP2 and HDAC3 at the AP-1 site in the APP promoter, which decreases formation of a transcription repressor complex. APP transcription is positively regulated in ABCA2 overexpressing cells by increased in vivo binding of the c-jun transcriptional activator at the AP-1 site, as well as by the increased in vivo binding of the USF-1 and USF-2 transcriptional activators at the E-box site. APP transcriptional regulation is mediated through PKC. ABCA2 overexpression increases the activity of alkaline and acidic ceramidase enzymes as well as the mass of sphingosine, which is a physiological inhibitor of PKC. Ceramidase inhibition with ceranib-1 or PKC activation with PMA or DAG decreases APP transcription, while inhibition of PKC with GF109203x elevates APP transcription.
4. Discussion
In this report, we hypothesized that ABCA2 modulation of sphingolipid metabolism activates a signaling pathway that regulates amyloid precursor protein transcription. ABCA2 functions to modulate intracellular lipid metabolism and trafficking. Many of the enzymes involved in sphingolipid homeostasis are localized to distinct intracellular organelles and organized within the membrane in specific topological orientations for interaction with their cognate substrates. Mechanistically, we believe ABCA2 alters the transbilayer distribution of ceramide in the lipid bilayer that brings the ceramide substrate into topological proximity to the respective ceramide metabolizing enzymes. Evidence for ABCA2 modulation of transbilayer distribution of ceramide was reported in Davis, 2011 [18] e.g., (1) a decrease in inner leaflet-specific ceramide kinase activity (CERK) in ABCA2 overexpressing cells (2) increased extraction of fluorescent NBD-ceramide from the outer leaflet of the lipid bilayer. We have presented novel mass spectrometry data that indicates reduced ceramide 1 phosphate production (decreased CERK activity) in ABCA2 overexpressing cells. Altered transbilayer distribution of ceramide, mediated by overexpression of ABCA2, may promote an increase in ceramidase activity and an increase in sphingosine mass.
We previously determined through analysis of sphingolipid profiles by electron spray ionization/mass spectrometry in N2a cells that ABCA2 overexpression decreased the mass of total ceramide and individual ceramide species [23]. In this report, we determined that the mass of sphingosine, a product of ceramide catabolism by the action of ceramidase enzymes was elevated in ABCA2 overexpressing cells. In addition we measured an increase in the in vitro activity of acidic and alkaline ceramidases that generate sphingosine from ceramide in cell homogenates of ABCA2 overexpressing A2 cells. We did not observe altered in vitro neutral ceramidase (ASAH2) activity in N2a and A2 cells. This enzyme is localized to the plasma membrane and is an important regulator of the conversion of ceramide to sphingosine and sphingosine-1-phosphate by sphingosine kinase. ABCA2 is not present in appreciable amounts at the plasma membrane and this may account for the absence of an effect of ABCA2 overexpression on neutral ceramidase activity. ABCA2 is localized to the late-endosomal/lysosomal compartment where acid ceramidase (ASAH1) resides [45]. ABCA2 has also been detected in the Golgi complex where the predominant forms of alkaline ceramidase are ACER2 and ACER3. Mechanistically, ABCA2 may function to alter the transbilayer distribution of the sphingolipid ceramide in internal organelle membranes and bring the ceramide substrate in proximity to the alkaline and acidic ceramidase enzymes to increase ceramidase activity to generate sphingosine [17]. Pharmacological inhibition of ceramidase activity with ceranib-1 decreased APP mRNA levels in ABCA2 overexpressing cells. Since ABCA2 overexpression in N2a cells did not affect APP mRNA turnover [15], this finding suggests that ABCA2 regulation of sphingolipid metabolism is a key locus of regulation of the steady-state levels of APP through transcription.
Sphingosine is a physiological inhibitor of protein kinase C [24]. Pharmacological activation of protein kinase C with phorbol ester PMA or addition of the physiological activator diacylglycerol dose-dependently decreased APP mRNA as well as the expression of a human APP promoter luciferase construct. Conversely, pharmacological inhibition of protein kinase C activity with GF109203x increased human APP promoter activity in both N2a and A2 cells. These findings suggest that modulation of PKC activity is sufficient to control APP expression through DNA control elements in the APP promoter.
We investigated the apparent paradox of PMA reducing expression of APP at the mRNA and promoter level but increasing the expression level of the AP-1 activator proteins c-jun and c-fos. Transfection of c-jun expression constructs dose-dependently increased expression of the APP promoter, while mutation of the AP-1 binding site reduced APP promoter expression, indicating that the AP-1 site is functional for activation by c-jun. Negative regulation of transcriptional activation at the AP-1 site in the APP promoter can be mediated by the JDP2 repressor protein, which binds AP-1 sites and represses transcriptional activation, either as a JDP2 homodimer or heterodimer with c-jun. The protein mass of JDP2 in cell homogenates was higher in N2a cells than A2 cells. In addition, chromatin immunoprecipitation experiments indicated that JDP2 in vivo binding to the AP-1 site was elevated in N2a cell compared to A2 cells. JDP2 can repress AP-1-dependent transcription by recruiting histone deacetylase HDAC3 to the promoter [39] and inhibiting p300-mediated histone acetylation and transcriptional activation by histone acetyltransferase (HAT) [40]. Consistent with our hypothesis, we determined that the in vivo binding of HDAC3 to the AP-1 site was also elevated in N2a cells relative to A2 cells. These finding suggest that in N2a cells, a repressive complex forms at the AP-1 site, consisting of JDP-JDP-HDAC3 or c-jun-JDP-HDAC3. In ABCA2-overexpressing cells, the formation of the repressive complex mediated by JDP-HDAC3 is reduced, allowing transcriptional activation by c-jun at the AP-1 site. Interestingly, JDP2 has been reported to potentiate and synergize with PKC activation [46] and perhaps this may be the mechanism for preventing spurious activation of APP expression in neural cells, which would be detrimental if toxic APP metabolite levels also increase.
An E-box element located at position −49 base pairs upstream of the transcription start site of the APP promoter binds the USF family of transcription factors, USF-1 and USF-2, to activate APP transcription. The steady-state masses of both USF-1 and USF-2 transcription factors were increased in ABCA2-overexpressing cells. Transfection of USF-1 and USF-2 transcription factor expression constructs elevated human APP promoter expression, while the dominant-negative A-USF protein did not activate the promoter. The in vivo binding of both USF-1 and USF-2 to the endogenous mouse APP gene was also increased in ABCA2-overexpressing cells. These findings suggest that elevation of APP expression in ABCA2-overexpressing cells may be due to a combination of relief of repression at the AP-1 site and activation at the E-box site.
ABCA2 has been genetically linked to AD but the mechanisms are unknown; however a prevalent hypothesis suggests that altered synthesis and metabolism of the amyloid precursor protein is centrally involved in the etiology. The occurrence of duplications of the amyloid precursor protein gene (APP) has been described in European and Japanese families with early-onset familial Alzheimer disease (EO-FAD) and cerebral amyloid angiopathy [44]. This suggests that tight regulation of the expression of APP is a key parameter to reduce the elaboration of neurotoxic Aβ peptides. To date, very few genes have been identified whose expression directly modulates APP expression. The recent finding that ABCA2 overexpression modulates sphingolipid metabolism in neural cells suggests a possible mechanistic link between ABCA2 and AD, consistent with the amyloid hypothesis of AD etiology. Dysregulation of sphingolipid metabolism has been reported in brain samples of human AD patients [45]. Interestingly, in these patients, the expression of acid ceramidase and sphingosine were elevated. An independent group has also detected elevated levels of acid ceramidase activity in human AD brain [46].
The finding that modulation of PKC activity alters ABCA2 regulation of APP transcription may be important, since activation of PKC has been suggested as a possible therapeutic regimen to reduce the accumulation of neurotoxic amyloid and tau protein hyperphosphorylation in the brain [47, 48]. Deficits in PKC signaling cascades in neurons represent one of the earliest changes in the brains of patients with Alzheimer’s disease (AD) and other types of memory impairment [49]. Targeting ABCA2 expression may represent a novel approach to regulate PKC signaling cascades in amelioration of AD pathology.
In summary, we have presented evidence of a possible mechanistic link between ABCA2 expression in neural cells, altered sphingosine levels, PKC activity and modulation of amyloid precursor protein expression at the level of transcription. Future studies will examine the effects of ABCA2 and APP metabolism in animal models of Alzheimer’s disease.
Acknowledgments
This research was supported by Grant Number 1K01NS062113-01A2 (Warren Davis) from the National Institute of Neurological Disorders and Stroke.
This research was supported in part by the Lipidomics Shared Resource, Hollings Cancer Center, Medical University of South Carolina (P30 CA138313) and the Lipidomics Core in the SC Lipidomics and Pathobiology COBRE (P20 RR017677).
References
- 1.Hardy J, Selkoe DJ. The amyloid hypothesis of Alzheimer’s disease: progress and problems on the road to therapeutics. Science. 2002;297(5580):353–6. doi: 10.1126/science.1072994. [DOI] [PubMed] [Google Scholar]
- 2.Carreiras MC, et al. The multifactorial nature of Alzheimer’s disease for developing potential therapeutics. Curr Top Med Chem. 2013;13(15):1745–70. doi: 10.2174/15680266113139990135. [DOI] [PubMed] [Google Scholar]
- 3.Higgins CF, Linton KJ. The ATP switch model for ABC transporters. Nat Struct Mol Biol. 2004;11(10):918–26. doi: 10.1038/nsmb836. [DOI] [PubMed] [Google Scholar]
- 4.Takahashi K, et al. ABC proteins: key molecules for lipid homeostasis. Med Mol Morphol. 2005;38(1):2–12. doi: 10.1007/s00795-004-0278-8. [DOI] [PubMed] [Google Scholar]
- 5.Kaminski WE, Piehler A, Wenzel JJ. ABC A-subfamily transporters: structure, function and disease. Biochim Biophys Acta. 2006;1762(5):510–24. doi: 10.1016/j.bbadis.2006.01.011. [DOI] [PubMed] [Google Scholar]
- 6.Wenzel JJ, Piehler A, Kaminski WE. ABC A-subclass proteins: gatekeepers of cellular phospho- and sphingolipid transport. Front Biosci. 2007;12:3177–93. doi: 10.2741/2305. [DOI] [PubMed] [Google Scholar]
- 7.Piehler AP, Ozcurumez M, Kaminski WE. A-Subclass ATP-Binding Cassette Proteins in Brain Lipid Homeostasis and Neurodegeneration. Front Psychiatry. 2012;3:17. doi: 10.3389/fpsyt.2012.00017. [DOI] [PMC free article] [PubMed] [Google Scholar]
- 8.Vulevic B, et al. Cloning and characterization of human adenosine 5′-triphosphate-binding cassette, sub-family A, transporter 2 (ABCA2) Cancer Res. 2001;61(8):3339–47. [PubMed] [Google Scholar]
- 9.Mace S, et al. ABCA2 is a strong genetic risk factor for early-onset Alzheimer’s disease. Neurobiol Dis. 2005;18(1):119–25. doi: 10.1016/j.nbd.2004.09.011. [DOI] [PubMed] [Google Scholar]
- 10.Wollmer MA, et al. Ethnicity-dependent genetic association of ABCA2 with sporadic Alzheimer’s disease. Am J Med Genet B Neuropsychiatr Genet. 2006;141B(5):534–6. doi: 10.1002/ajmg.b.30345. [DOI] [PubMed] [Google Scholar]
- 11.Minster RL, DeKosky ST, Kamboh MI. No association of DAPK1 and ABCA2 SNPs on chromosome 9 with Alzheimer’s disease. Neurobiol Aging. 2009;30(11):1890–1. doi: 10.1016/j.neurobiolaging.2008.01.006. [DOI] [PMC free article] [PubMed] [Google Scholar]
- 12.Chen ZJ, et al. Association of ABCA2 expression with determinants of Alzheimer’s disease. FASEB J. 2004;18(10):1129–31. doi: 10.1096/fj.03-1490fje. [DOI] [PubMed] [Google Scholar]
- 13.Michaki V, et al. Down-regulation of the ATP-binding cassette transporter 2 (Abca2) reduces amyloid-beta production by altering Nicastrin maturation and intracellular localization. J Biol Chem. 2012;287(2):1100–11. doi: 10.1074/jbc.M111.288258. [DOI] [PMC free article] [PubMed] [Google Scholar]
- 14.Abuznait AH, Kaddoumi A. Role of ABC transporters in the pathogenesis of Alzheimer’s disease. ACS Chem Neurosci. 2012;3(11):820–31. doi: 10.1021/cn300077c. [DOI] [PMC free article] [PubMed] [Google Scholar]
- 15.Li G, Gu HM, Zhang DW. ATP-binding cassette transporters and cholesterol translocation. IUBMB Life. 2013;65(6):505–12. doi: 10.1002/iub.1165. [DOI] [PubMed] [Google Scholar]
- 16.Javitt NB. Alzheimer’s disease: neuroprogesterone, epoxycholesterol, and ABC transporters as determinants of neurodesmosterol tissue levels and its role in amyloid protein processing. J Alzheimers Dis. 2013;35(3):441–50. doi: 10.3233/JAD-130044. [DOI] [PubMed] [Google Scholar]
- 17.Davis W, Jr, et al. Human ATP-binding cassette transporter-2 (ABCA2) positively regulates low-density lipoprotein receptor expression and negatively regulates cholesterol esterification in Chinese hamster ovary cells. Biochim Biophys Acta. 2004;1683(1–3):89–100. doi: 10.1016/j.bbalip.2004.04.009. [DOI] [PubMed] [Google Scholar]
- 18.Davis W., Jr The ATP-binding cassette transporter-2 (ABCA2) regulates cholesterol homeostasis and low-density lipoprotein receptor metabolism in N2a neuroblastoma cells. Biochim Biophys Acta. 2011;1811(12):1152–64. doi: 10.1016/j.bbalip.2011.07.010. [DOI] [PMC free article] [PubMed] [Google Scholar]
- 19.Davis W., Jr The ATP-binding cassette transporter-2 (ABCA2) increases endogenous amyloid precursor protein expression and Abeta fragment generation. Curr Alzheimer Res. 2010;7(7):566–77. doi: 10.2174/156720510793499002. [DOI] [PMC free article] [PubMed] [Google Scholar]
- 20.van Echten-Deckert G, Walter J. Sphingolipids: critical players in Alzheimer’s disease. Prog Lipid Res. 2012;51(4):378–93. doi: 10.1016/j.plipres.2012.07.001. [DOI] [PubMed] [Google Scholar]
- 21.Mack JT, et al. “Skittish” Abca2 knockout mice display tremor, hyperactivity, and abnormal myelin ultrastructure in the central nervous system. Mol Cell Biol. 2007;27(1):44–53. doi: 10.1128/MCB.01824-06. [DOI] [PMC free article] [PubMed] [Google Scholar]
- 22.Sakai H, et al. ABCA2 deficiency results in abnormal sphingolipid metabolism in mouse brain. J Biol Chem. 2007;282(27):19692–9. doi: 10.1074/jbc.M611056200. [DOI] [PubMed] [Google Scholar]
- 23.Davis W., Jr The ATP-binding cassette transporter-2 (ABCA2) regulates esterification of plasma membrane cholesterol by modulation of sphingolipid metabolism. Biochim Biophys Acta. 2014;1841(1):168–79. doi: 10.1016/j.bbalip.2013.10.019. [DOI] [PMC free article] [PubMed] [Google Scholar]
- 24.Hannun YA, Bell RM. Regulation of protein kinase C by sphingosine and lysosphingolipids. Clin Chim Acta. 1989;185(3):333–45. doi: 10.1016/0009-8981(89)90224-6. [DOI] [PubMed] [Google Scholar]
- 25.Quitschke WW. Two nuclear factor binding domains activate expression from the human amyloid beta-protein precursor promoter. J Biol Chem. 1994;269(33):21229–33. [PubMed] [Google Scholar]
- 26.Tani M, et al. Specific and sensitive assay for alkaline and neutral ceramidases involving C12-NBD-ceramide. J Biochem. 1999;125(4):746–9. doi: 10.1093/oxfordjournals.jbchem.a022345. [DOI] [PubMed] [Google Scholar]
- 27.Galadari S, et al. Identification of a novel amidase motif in neutral ceramidase. Biochem J. 2006;393(Pt 3):687–95. doi: 10.1042/BJ20050682. [DOI] [PMC free article] [PubMed] [Google Scholar]
- 28.Gault CR, Obeid LM, Hannun YA. An overview of sphingolipid metabolism: from synthesis to breakdown. Adv Exp Med Biol. 2010;688:1–23. doi: 10.1007/978-1-4419-6741-1_1. [DOI] [PMC free article] [PubMed] [Google Scholar]
- 29.Hu W, et al. Alkaline ceramidase 3 (ACER3) hydrolyzes unsaturated long-chain ceramides, and its down-regulation inhibits both cell proliferation and apoptosis. J Biol Chem. 2010;285(11):7964–76. doi: 10.1074/jbc.M109.063586. [DOI] [PMC free article] [PubMed] [Google Scholar]
- 30.Draper JM, et al. Discovery and evaluation of inhibitors of human ceramidase. Mol Cancer Ther. 2011;10(11):2052–61. doi: 10.1158/1535-7163.MCT-11-0365. [DOI] [PMC free article] [PubMed] [Google Scholar]
- 31.Pollwein P, Masters CL, Beyreuther K. The expression of the amyloid precursor protein (APP) is regulated by two GC-elements in the promoter. Nucleic Acids Res. 1992;20(1):63–8. doi: 10.1093/nar/20.1.63. [DOI] [PMC free article] [PubMed] [Google Scholar]
- 32.Trejo J, et al. A direct role for protein kinase C and the transcription factor Jun/AP-1 in the regulation of the Alzheimer’s beta-amyloid precursor protein gene. J Biol Chem. 1994;269(34):21682–90. [PubMed] [Google Scholar]
- 33.Vostrov AA, et al. USF binds to the APB alpha sequence in the promoter of the amyloid beta-protein precursor gene. Nucleic Acids Res. 1995;23(14):2734–41. doi: 10.1093/nar/23.14.2734. [DOI] [PMC free article] [PubMed] [Google Scholar]
- 34.Way KJ, Chou E, King GL. Identification of PKC-isoform-specific biological actions using pharmacological approaches. Trends Pharmacol Sci. 2000;21(5):181–7. doi: 10.1016/s0165-6147(00)01468-1. [DOI] [PubMed] [Google Scholar]
- 35.Halazonetis TD, et al. c-Jun dimerizes with itself and with c-Fos, forming complexes of different DNA binding affinities. Cell. 1988;55(5):917–24. doi: 10.1016/0092-8674(88)90147-x. [DOI] [PubMed] [Google Scholar]
- 36.Chiu R, et al. The c-Fos protein interacts with c-Jun/AP-1 to stimulate transcription of AP-1 responsive genes. Cell. 1988;54(4):541–52. doi: 10.1016/0092-8674(88)90076-1. [DOI] [PubMed] [Google Scholar]
- 37.Angel P, et al. Phorbol ester-inducible genes contain a common cis element recognized by a TPA-modulated trans-acting factor. Cell. 1987;49(6):729–39. doi: 10.1016/0092-8674(87)90611-8. [DOI] [PubMed] [Google Scholar]
- 38.Schonthal A, et al. Requirement for fos gene expression in the transcriptional activation of collagenase by other oncogenes and phorbol esters. Cell. 1988;54(3):325–34. doi: 10.1016/0092-8674(88)90195-x. [DOI] [PubMed] [Google Scholar]
- 39.Jin C, et al. JDP2, a repressor of AP-1, recruits a histone deacetylase 3 complex to inhibit the retinoic acid-induced differentiation of F9 cells. Mol Cell Biol. 2002;22(13):4815–26. doi: 10.1128/MCB.22.13.4815-4826.2002. [DOI] [PMC free article] [PubMed] [Google Scholar]
- 40.Pan J, et al. Sequence specific transcription factor, JDP2 interacts with histone and inhibits p300-mediated histone acetylation. Nucleic Acids Res Suppl. 2003;3:305–6. doi: 10.1093/nass/3.1.305. [DOI] [PubMed] [Google Scholar]
- 41.Hoffman PW, Chernak JM. DNA binding and regulatory effects of transcription factors SP1 and USF at the rat amyloid precursor protein gene promoter. Nucleic Acids Res. 1995;23(12):2229–35. doi: 10.1093/nar/23.12.2229. [DOI] [PMC free article] [PubMed] [Google Scholar]
- 42.Kovacs DM, et al. The upstream stimulatory factor functionally interacts with the Alzheimer amyloid beta-protein precursor gene. Hum Mol Genet. 1995;4(9):1527–33. doi: 10.1093/hmg/4.9.1527. [DOI] [PubMed] [Google Scholar]
- 43.Bourbonniere M, Nalbantoglu J. The helix-loop-helix transcription factor USF interacts with the basal promoter of human amyloid precursor protein. Brain Res Mol Brain Res. 1996;35(1–2):304–8. doi: 10.1016/0169-328x(95)00208-a. [DOI] [PubMed] [Google Scholar]
- 44.Kasuga K, et al. Identification of independent APP locus duplication in Japanese patients with early-onset Alzheimer disease. J Neurol Neurosurg Psychiatry. 2009;80(9):1050–2. doi: 10.1136/jnnp.2008.161703. [DOI] [PubMed] [Google Scholar]
- 45.He X, et al. Deregulation of sphingolipid metabolism in Alzheimer’s disease. Neurobiol Aging. 2010;31(3):398–408. doi: 10.1016/j.neurobiolaging.2008.05.010. [DOI] [PMC free article] [PubMed] [Google Scholar]
- 46.Huang Y, et al. Elevation of the level and activity of acid ceramidase in Alzheimer’s disease brain. Eur J Neurosci. 2004;20(12):3489–97. doi: 10.1111/j.1460-9568.2004.03852.x. [DOI] [PubMed] [Google Scholar]
- 47.Sun MK, Alkon DL. Protein kinase C pharmacology: perspectives on therapeutic potentials as antidementic and cognitive agents. Recent Pat CNS Drug Discov. 2006;1(2):147–56. doi: 10.2174/157488906777452721. [DOI] [PubMed] [Google Scholar]
- 48.Khan TK, et al. A cellular model of Alzheimer’s disease therapeutic efficacy: PKC activation reverses Abeta-induced biomarker abnormality on cultured fibroblasts. Neurobiol Dis. 2009;34(2):332–9. doi: 10.1016/j.nbd.2009.02.003. [DOI] [PMC free article] [PubMed] [Google Scholar]
- 49.Sun MK, Alkon DL. Activation of protein kinase C isozymes for the treatment of dementias. Adv Pharmacol. 2012;64:273–302. doi: 10.1016/B978-0-12-394816-8.00008-8. [DOI] [PubMed] [Google Scholar]


