Abstract
AIM
To evaluate the correlation among changes in fundus autofluorescence (AF) measured using infrared fundus AF (IR-AF) and short-wave length fundus AF (SW-AF) with changes in spectral-domain optical coherence tomography (SD-OCT) and fluorescein angiography (FA) in central serous chorioretinopathy (CSC).
METHODS
Two hundred and twenty consecutive patients with CSC were included. In addition to AF, patients were assessed by means of SD-OCT and FA. Abnormalities in images of IR-AF, SW-AF, FA were analyzed and correlated with the corresponding outer retinal alterations in SD-OCT findings.
RESULTS
Eyes with abnormalities on either IR-AF or SW-AF were found in 256 eyes (58.18%), among them 256 eyes (100%) showed abnormal IR-AF, but SW-AF abnormalities were present only in 213 eyes (83.20%). The hypo-IR-AF corresponded to accumulation of sub-retinal liquid, collapse of retinal pigment epithelium (RPE) or detachment of RPE with or without RPE leakage point in the corresponding area. The hyper-IR-AF corresponded to the area with loss of the ellipsoid portion of the inner segments and sub-sensory retinal deposits or focal melanogenesis under sensory retina. The hypo-SW-AF corresponded to accumulation of sub-retinal liquid or atrophy of RPE. The hyper-SW-AF associated with sub-sensory retinal deposits, detachment of RPE and focal melanogenesis.
CONCLUSION
IR-AF was more sensitive than SW-AF and FA for identifying pathological abnormalities in CSC. The characteristics of IR-AF in CSC were attributable to the modification of melanin in the RPE. IR-AF should be used as a common diagnostic tool for identifying pathological lesion in CSC.
Keywords: central serous chorioretinopathy, fluorescein angiography, fundus autofluorescence, optical coherence tomography
INTRODUCTION
Central serous chorioretinopathy (CSC) is a commonly encountered fundus disease, which appears to arise primarily from choroidal vascular abnormalities and subsequent dysfunction of the retinal pigment epithelium (RPE), resulting in detachment of the neurosensory retina or the RPE[1]–[2]. The symptoms induced by CSC including micropsia, metamorphopsia, decreased visual acuity, and central scotoma[3]. In most cases, CSC resolves spontaneously in 3-6mo, but there may be alterations in photoreceptors and RPE[4]. Although serous detachment may resolve completely, visual acuity and contrast sensitivity may not improve to the value prior to the episode because of photoreceptor and RPE/choriocapillaris complex damage[5]. Fluorescein angiography (FA) is the most popular way of detecting the abnormalities of RPE and choriod in CSC. Depending on FA, the leakage, depigmentation or atrophy in RPE can be comfirmed easily[6],[7]. Other than FA, fundus autofluorescence (AF) can now also be used to evaluate the pathological changes more and more commonly in CSC. AF images can be obtained conveniently and safely, no fluorescein sodium injection is needed. Several studies have shown that AF images provide more information about the condition of the retina in CSC than FA do[8],[9]. The AF used for examining ocular fundus includes 2 types, short-wavelength AF (SW-AF) and near-infrared AF (IR-AF), which produced by different materials under short-wavelength or near-infrared exciting light. SW-AF and IR-AF images are thought to originate from lipofuscin and melanin respectively[10]. In addition to FA and AF, to detect structural changes of the outer retinal layers related to CSC, optical coherence tomography (OCT) also be used extensively. OCT is the optical analog of ultrasound imaging and is emerging as a powerful imaging technique that enables non-invasive, in vivo, high resolution, speed, achieving the visualization of tissue architectural morphology in situ and in real time in vivo optical biopsy [11].
Our purpose in the present study was to compare abnormal AF images, including IR-AF and SW-AF images, with spectral-domain OCT (SD-OCT) and FA images to investigate the utility of IR-AF and SW-AF at predicting outer retinal structural changes in CSC, and to investigate the reasons why IR-AF and SW-AF have different expression correlations with anatomical abnormality in CSC.
SUBJECTS AND METHODS
Approval for this study was obtained from the Xijing Hospital Institutional Review Board. All research protocols and data collection complied with the Declaration of Helsinki.
IR-AF and SW-AF were performed using the Heidelberg spectralis HRA (Heidelberg Retina Angiograph; Heidelberg Engineering, Heidelberg, Germany). AF images were obtained after maximum pupillary dilation which was achieved with instillation of 0.5% tropicamide and 0.5% phenylephrine. For IR-AF images, an excitation wavelength of 787 nm (indocyanine green mode) was used, emitted light was detected with barrier filter at 815 nm. The image resolution was 768×768 pixels. After switching to 787 nm excitation, the sensitivity was increased until the retinal vessels and the disc were recognized. Averaging images were obtained using the HRA mean algebraic reconstruction technique algorithm to gain image contrast. For SW-AF imaging, a wavelength of 488 nm was used for excitation, and emitted light was detected above 500 nm with a barrier filter. SW-AF images were acquired in the same manner as the IR-AF images. After the acquisition of AF, FA was performed after fluorescein sodium injection.
SD-OCT (RTVue-100, Optovue Inc, California, USA; 3D-OCT-TM system Topcon, Tokyo, Japan) with single scan through the center of the fovea, routinely.
RESULTS
Four hundred and forty eyes of 220 patients with CSC were analyzed. The average patient age was 40.55±5.25y, and the male-to-female ratio was 180 (81.82%) to 40 (18.18%). The mean Snellen best-corrected visual acuity was 0.25±0.39.
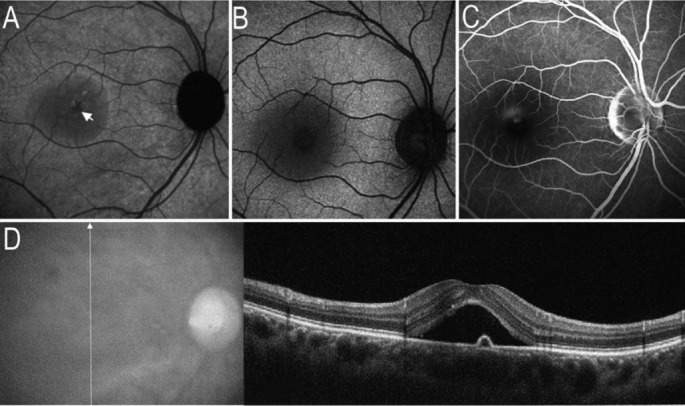
Eyes with abnormalities on either IR-AF or SW-AF were found in 256 eyes (58.18%), among which IR-AF abnormalities were found in all 256 eyes (100%). Ninety-seven of 256 eyes (37.89%) had decreased (hypo) IR-AF corresponding to the area of the serous retinal detachment, interestingly, the most prominent hypo-IR-AF corresponding to the RPE leakage point on FA images, where the SD-OCT demonstrated the local detachment of RPE. While 185 of the 256 eyes (72.27%) had decreased (hypo) SW-AF corresponding to the area of serous retinal detachment (Figure 1), 17 of 256 eyes (6.64%) had relatively normal SW-AF at the location of serous retinal detachment.
Figure 1. Serous retinal detachment and RPE leakage point on images of AF and SD-OCT.
A: On IR-AF image, a hypo-AF area corresponding to serous retinal detachment. Arrow indicated the most prominent location of hypo-IR-AF. B: On SW-AF image, a circular hypo-AF area corresponding to serous detachment; C: FA image revealed the RPE leakage point corresponding to the most prominent location of hypo-IR-AF; D: SD-OCT demonstrated the serous retinal detachment, a local RPE elevation (detachment) corresponding to RPE leakage point on FA image.
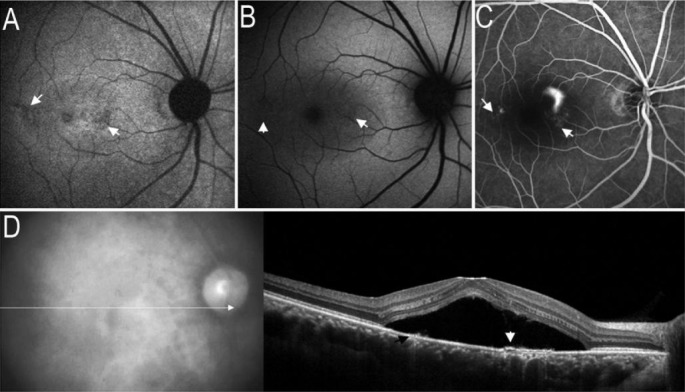
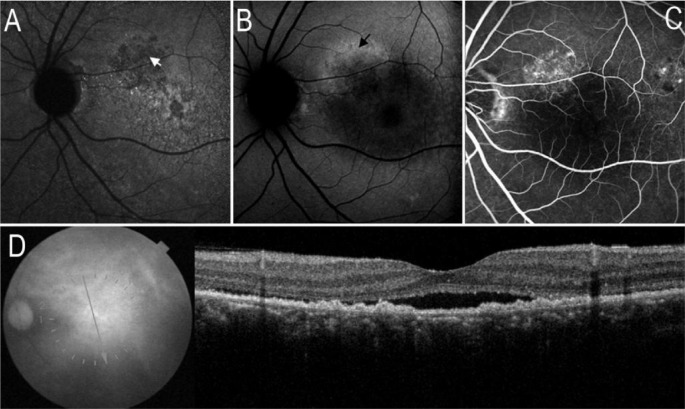
One hundred and seventy-five of 256 eyes (68.36%) had geographic hypo-IR-AF, the location of the hypo-IR-AF was consistent with that of the window defects on FA images, whereas the SW-AF image looked normal in 26 eyes (14.86%), geographic hypo-SW-AF corresponding to hypo-IR-AF in 149 eyes (58.20%), and RPE collapsed was noticed in the area with geographic hypo-IR-AF by OCT (Figure 2).
Figure 2. Collapsed RPE on images of AF and SD-OCT.
A: Arrow indicated the localized hypo-AF on IR-AF image; B: On SW-AF image, mild hypo-AF corresponding to the location of hypo-IR-AF; C: FA image revealed 2 areas with window defects corresponding to the location of hypo-IR-AF; D: SD-OCT demonstrated the serous retinal detachment and local RPE detachment (white arrow), some RPE appeared to have collapsed (black arrow), whereas corresponding to the hypo-IR-AF.
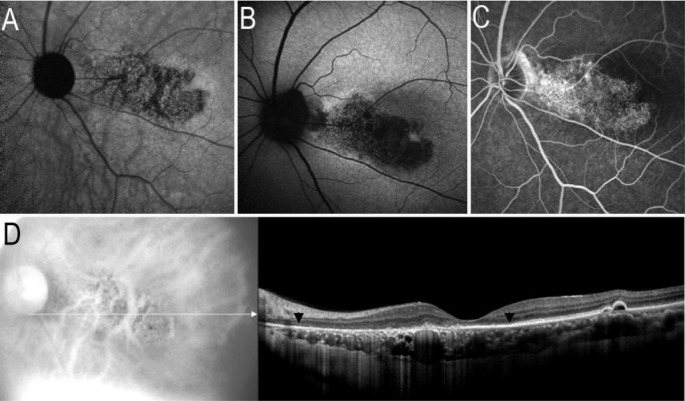
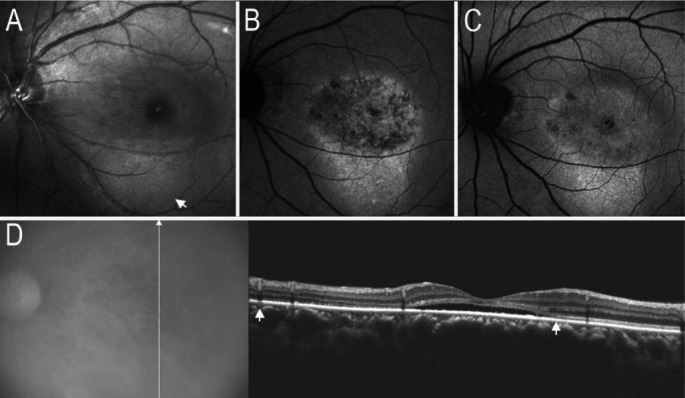
Twenty-one of 256 eyes (8.20%) with hypo-IR-AF appeared concurrently with the area of diffuse hypo-SW-AF, whereas the window defects were noticed in FA images. On SD-OCT images, the outer nuclear and ellipsoid portion of the inner segments layers, RPE and laminae choriocapillaris appeared to have atrophied (Figure 3).
Figure 3. Atrophied RPE and choriocapillaris on images of AF and SD-OCT.
A: IR-AF image showed map-like hypo-AF; B: SW-AF image showed a map-like area with hypo-AF; C: FA image revealed a window defect area corresponding to the abnormalities of hypo-IR-AF or hypo-SW-AF; D: SD-OCT image demonstrated the atrophied outer nuclear layer, ellipsoid portion of the inner segments layers, RPE and laminae choriocapillaris (black arrows).
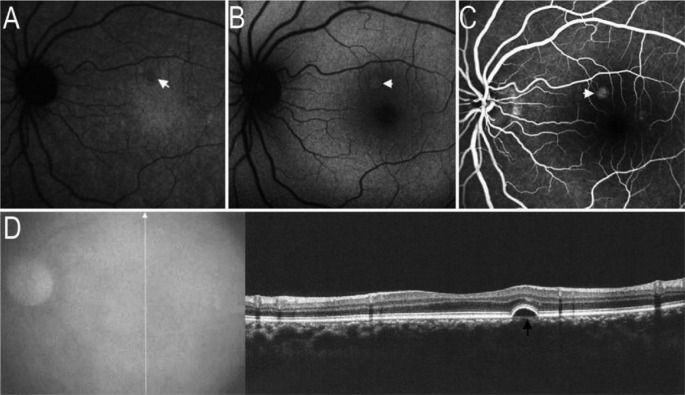
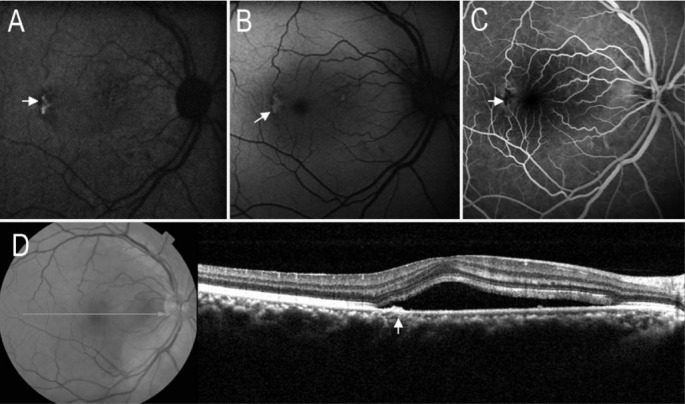
Thirty-nine of 256 eyes (15.23%) had localized detachment of RPE verified by SD-OCT. IR-AF images showed the location of RPE detachment presenting hypo-AF, whereas corresponding to focal hyper-AF on SW-AF images (Figure 4).
Figure 4. RPE detachment on images of AF and SD-OCT.
A: IR-AF image indicated the localized hypo-AF (white arrow); B: SW-AF image showed the localized hyper-AF (white arrow); C: FA image presented localized hype-fluorescence (white arrow); D: SD-OCT demonstrated the localized RPE detachment (black arrow) corresponding to the abnormalities of hypo-IR-AF, hyper-SW-AF and hype-fluorescence.
Sixteen eyes (6.25%) with deposits on RPE that showed hypo-IR-AF corresponding to homogenous hyper-SW-AF on SW-AF images, whereas the window defects were noticed on FA images compared with hyper-SW-AF (Figure 5).
Figure 5. RPE mass deposits on images of AF and SD-OCT.
A: IR-AF image showed a area with granular hypo-AF (white arrow); B: SW-AF image showed a area with granular hyper-AF (black arrow) corresponding to the area of hyper-SW-AF; C: FA image revealed a window defects area; D: SD-OCT showed irregular mass deposits on RPE corresponding to the abnormalities of hypo-IR-AF or hyper-SW-AF.
Forty-five of 256 eyes (17.58%) with diffuse hyper-IR-AF appeared concurrently with granular hyper-SW-AF. On SD-OCT images, the deposits appeared on the outer retinal surface or on the RPE, whereas the outer nuclear and ellipsoid portion of the inner segments layers appeared to have collapsed (Figure 6).
Figure 6. Dot-like deposits and collapsed outer nuclear and ellipsoid portion of the inner segments layers on images of AF and SD-OCT.
A: Red-free photograph showed multiple deposits within and outside the area of serous retinal detachment (white arrow); B: IR-AF image showed hyper-AF corresponding to the location of deposits; C: On SW-AF image, dense dot-like hyper-AF corresponding to the locations of dot-like hyper-IR-AF; D: On SD-OCT image, the outer nuclear and ellipsoid portion of the inner segments layers appeared to have collapsed (white arrows), some dot-like deposits on the retinal pigment epithelium.
In 26 eyes with CSC (10.16%), focal hyper-IR-AF appeared concurrently with focal hyper-SW-AF, and FA demonstrated the location of blocked fluorescence corresponding to focal hyper-SW-AF and hyper-IR-AF. SD-OCT image verified the focal thickening of RPE (melanogenesis) corresponding to the location of hyper-SW-AF, hyper-IR-AF and blocked fluorescence on FA images (Figure 7).
Figure 7. Thickening of RPE (melanogenesis) on images of AF and SD-OCT.
A: IR-AF image showed focal hyper-AF (white arrow); B: SW-AF image revealed focal circumscribed hyper-AF(white arrow); C: FA image revealed a blocked fluorescence area (white arrow); D: SD-OCT image showed focal thickening of retinal pigment epithelium (white arrow) corresponding to the location of hyper-IR-AF or hyper-SW-AF.
DISCUSSION
We compared the findings of IR-AF, SW-AF, FA and SD-OCT, to study the characteristics of IR-AF, SW-AF and SD-OCT in the eyes with CSC. We found that abnormal IR-AF abnormalities were detected in 256 eyes, but SW-AF abnormalities were present only in a subset of eyes (213 of 256 eyes, 83.20%). This implies that IR-AF is more sensitive than SW-AF in detecting retinal abnormalities in CSC. IR-AF is derived from melanin in the RPE and choroid excited by near infrared light. Melanin in the RPE plays an important role in the protection of eyes against phototoxicity that may be involved in age-related dysfunction of the fovea[12]. In a normal fundus, the optic disc and retinal vascular structures are hypo-IR-AF secondary to the lack of melanin, whereas the macula, especially the fovea has the increased IR-AF than that in other location, it is the reason that distribution of melanin is more dense in fovea[13].
In present study, we found that the RPE detachment with or without RPE leakage on FA images presenting as hypo-IR-AF, we hypothesized the reason was that serous accumulation under RPE blocking the AF from choroidal melanin. Ayata et al[14] had similar findings in acute CSC, also presenting hypo-IR-AF corresponding to the area of the serous retinal detachment and to the leakage point. Interestingly, on OCT images, all of the hypo-IR-AF spots at the leakage site corresponding to protrusion of the RPE (RPE detachment). Depending on this finding, we presumed that leakage from choroidal vessels accumulating under RPE at early stage of CSC. RPE leakage was a consequence after the break of tight junction of RPE cells induced by overmuch accumulation of serous under RPE.
Moreover, consistency in the location between hypo-IR-AF lesions and window defects on FA images was expected in this study, it is because the deficiency of melanin in the atrophic lesion of RPE and laminae choriocapillaris. Since the RPE contains melanin and lipofuscin[15], and the melanin produces IR-AF, lipofuscin produces SW-AF[14], hence the masses of RPE cells can generate hyper-IR-AF and hyper-SW-AF, as we observed in this study. SD-OCT revealed that the hyper-IR-AF appearance corresponded to the focal mound on the RPE, where FA images exhibited blocked fluorescein. We hypothesize that the focal mound on the RPE was the result of melanogenesis by aggregation of the RPE cells, where a focal hyper-IR-AF presenting.
SW-AF is another type of endogenous fluorescence derived mainly from lipofuscin excited by blue light. Lipofuscin is generated as a by-product of the retinoid cycle after the phagocytosis of photoreceptor outer segments[16],[17]. In a normal fundus, the optic disc and retinal vascular structures are hypo-SW-AF secondary to the lack of lipofuscin, whereas the macula, especially the fovea, displays a relative hypo-SW-AF due to the absorption of blue light by the luteal pigments[8],[18].
In CSC cases, hyper-SW-AF originates from increased accumulation of lipofuscin, which can be found at the location of subretinal deposits and RPE cells aggregation. SW-AF characteristics of subretinal deposits are dot-like and sporadic, these deposits are considered to be accumulations of photoreceptor outer segments or phagocytized outer segments by RPE cells. They may contribute to retinal degeneration in eyes with CSC[19]–[21].
For hypo-SW-AF, which mainly occurs secondary to the atrophy of the RPE layer, which presented on FA images as window defect[20],[21]. Increased melanin content in the RPE layer and sub-sensory retinal fluid also blockage of fundus SW-AF.
Although FA is still an important tool for investigating pathological changes of CSC, these findings acquired by FA may be useful in guiding the treatment, such as photocoagulating the location of leakage point[22],[23]. Except for FA, OCT and IR-AF may provide the location of RPE leakage point. Different pathological abnormalities in RPE may be interpreted by means of IR-AF in association with OCT[14],[24]. In contrast with FA, IR-AF are noninvasive, dye-free, especially matching with the treatment safety pursuit. Clinically, a few patients with CSC are not suitable for FFA for some reason, such as allergic reaction to fluorescein sodium or kidney failure. Depending on AF, especially IR-AF, the locations of RPE abnormalities including depigmentation, atrophy, focal detachment and melanogenesis can be found. Depending on OCT, the high resolution, cross-sectional imaging of retinal abnormalities including localized detachment of sensory retina, melanogenesis, atrophy or detachment of RPE can be acquired. In our opinion, IR-AF and OCT finds may be helpful in guiding the laser photocoagulation to seal the RPE leakage point, refering to the locations of RPE detachment on images of IR-AF and OCT.
Nevertheless, this was a retrospective, not controlled or randomized study. A larger sampled study, including acute and chronic CSC cases, is warranted to confirm these preliminary results.
Acknowledgments
Conflicts of Interest: Zhang P, None; Wang HY, None; Zhang ZF, None; Sun DJ, None; Zhu JT, None; Li J, None; Wang YS, None
REFERENCES
- 1.Yannuzzi LA, Shakin JL, Fisher YL, Altomonte MA. Peripheral retinal detachments and retinal pigment epithelial atrophic tracts secondary to central serous pigment epitheliopathy. Ophthalmology. 1984;91(12):1554–1572. doi: 10.1016/s0161-6420(84)34117-3. [DOI] [PubMed] [Google Scholar]
- 2.Guyer DR, Yannuzzi LA, Slakter JS, Sorenson JA, Ho A, Orlock D. Digital indocyanine green videoangiography of central serous chorioretinopathy. Arch Ophthalmol. 1994;112(8):1057–1062. doi: 10.1001/archopht.1994.01090200063023. [DOI] [PubMed] [Google Scholar]
- 3.Robertson DM. Argon laser photocoagulation treatment in central serous chorioretinopathy. Ophthalmology. 1986;93(7):972–974. doi: 10.1016/s0161-6420(86)33652-2. [DOI] [PubMed] [Google Scholar]
- 4.Baran NV, Gürlü VP, Esgin H. Long-term macular function in eyes with central serous chorioretinopathy. Clin Experiment Ophthalmol. 2005;33(4):369–372. doi: 10.1111/j.1442-9071.2005.01027.x. [DOI] [PubMed] [Google Scholar]
- 5.Yap EY, Robertson DM. The long-term outcome of central serous chorioretinopathy. Arch Ophthalmol. 1996;114(6):689–692. doi: 10.1001/archopht.1996.01100130681007. [DOI] [PubMed] [Google Scholar]
- 6.Bujarborua D, Nagpal PN, Deka M. Smokestack leak in central serous chorioretinopathy. Graefes Arch Clin Exp Ophthalmol. 2010;248(3):339–351. doi: 10.1007/s00417-009-1212-5. [DOI] [PubMed] [Google Scholar]
- 7.Bujarborua D, Chatterjee S, Choudhury A, Bori G, Sarma AK. Fluorescein angiographic features of asymptomatic eyes in central serous chorioretinopathy. Retina. 2005;25(4):422–429. doi: 10.1097/00006982-200506000-00005. [DOI] [PubMed] [Google Scholar]
- 8.Spaide RF, Klancnik JM., Jr Fundus autofluorescence and central serous chorioretinopathy. Ophthalmology. 2005;112(5):825–833. doi: 10.1016/j.ophtha.2005.01.003. [DOI] [PubMed] [Google Scholar]
- 9.Imamura Y, Fujiwara T, Spaide RF. Fundus autofluorescence and visual acuity in central serous chorioretinopathy. Ophthalmology. 2011;118(4):700–705. doi: 10.1016/j.ophtha.2010.08.017. [DOI] [PubMed] [Google Scholar]
- 10.Kim SK, Kim SW, Oh J, Huh K. Near-infrared and short-wavelength autofluorescence in resolved central serous chorioretinopathy: association with outer retinal layer abnormalities. Am J Ophthalmol. 2013;156(1):157–164. doi: 10.1016/j.ajo.2013.02.016. [DOI] [PubMed] [Google Scholar]
- 11.Swanson EA, Izatt JA, Hee MR, Huang D, Lin CP, Schuman JS, Puliafito CA, Fujimoto JG. In vivo retinal imaging by optical coherence tomography. Opt Lett. 1993;18(21):1864–1846. doi: 10.1364/ol.18.001864. [DOI] [PubMed] [Google Scholar]
- 12.Ueda-Consolvo T, Miyakoshi A, Ozaki H, Houki S, Hayashi A. Near-infrared fundus autofluorescence-visualized melanin in the choroidal abnormalities of neurofibromatosis type 1. Clin Ophthalmol. 2012;6:1191–1194. doi: 10.2147/OPTH.S35321. [DOI] [PMC free article] [PubMed] [Google Scholar]
- 13.Bone RA, Brener B, Gibert JC. Macular pigment, photopigments, and melanin: distributions in young subjects determined by four-wavelength reflectometry. Vision Res. 2007;47(26):3259–3268. doi: 10.1016/j.visres.2007.09.002. [DOI] [PMC free article] [PubMed] [Google Scholar]
- 14.Ayata A, Tatlipinar S, Kar T, Unal M, Ersanli D, Bilge AH. Near-infrared and short-wavelength autofluorescence imaging in central serous chorioretinopathy. Br J Ophthalmol. 2009;93(1):79–82. doi: 10.1136/bjo.2008.141564. [DOI] [PubMed] [Google Scholar]
- 15.Chew EC, Liew CT, Chew SB, Lee JC, Hou HJ, Yam HF, Ho PC, Ip SM. The growth and behaviour of pig retinal pigment epithelial cells in culture. In Vivo. 1993;7(5):425–429. [PubMed] [Google Scholar]
- 16.Delori FC, Dorey CK, Staurenghi G, Arend O, Goger DG, Weiter JJ. In vivo fluorescence of the ocular fundus exhibits retinal pigment epithelium lipofuscin characteristics. Invest Ophthalmol Vis Sci. 1995;36(3):718–729. [PubMed] [Google Scholar]
- 17.Peters S, Kayatz P, Heimann K, Schraermeyer U. Subretinal injection of rod outer segments leads to an increase in the number of early-stage melanosomes in retinal pigment epithelial cells. Ophthalmic Res. 2000;32(2–3):52–56. doi: 10.1159/000055589. [DOI] [PubMed] [Google Scholar]
- 18.von Rückmann A, Fitzke FW, Bird AC. Distribution of pigment epithelium autofluorescence in retinal disease state recorded in vivo and its change over time. Graefes Arch Clin Exp Ophthalmol. 1999;237(1):1–9. doi: 10.1007/s004170050186. [DOI] [PubMed] [Google Scholar]
- 19.Sparrow JR, Boulton M. RPE lipofuscin and its role in retinal pathobiology. Exp Eye Res. 2005;80(5):595–606. doi: 10.1016/j.exer.2005.01.007. [DOI] [PubMed] [Google Scholar]
- 20.Oh J, Kim SW, Kwon SS, Oh IK, Huh K. Correlation of fundus autofluorescence gray values with vision and microperimetry in resolvedcentral serous chorioretinopathy. Invest Ophthalmol Vis Sci. 2012;53(1):179–184. doi: 10.1167/iovs.11-8704. [DOI] [PubMed] [Google Scholar]
- 21.Sekiryu T, Iida T, Maruko I, Saito K, Kondo T. Infrared fundus autofluorescence and central serous chorioretinopathy. Invest Ophthalmol Vis Sci. 2010;51(10):4956–4962. doi: 10.1167/iovs.09-5009. [DOI] [PubMed] [Google Scholar]
- 22.Gupta B, Elagouz M, McHugh D, Chong V, Sivaprasad S. Micropulse diode laser photocoagulation for central serous chorio-retinopathy. Clin Experiment Ophthalmol. 2009;37(8):801–805. doi: 10.1111/j.1442-9071.2009.02157.x. [DOI] [PubMed] [Google Scholar]
- 23.Sturm V. Early laser photocoagulation treatment as an option in central serous chorioretinopathy. Ophthalmic Surg Lasers Imaging. 2009;40(5):453–460. doi: 10.3928/15428877-20090901-03. [DOI] [PubMed] [Google Scholar]
- 24.Spaide RF, Curcio CA. Anatomical correlates to the bands seen in the outer retina by optical coherence tomography: literature review and model. Retina. 2011;31(8):1609–1619. doi: 10.1097/IAE.0b013e3182247535. [DOI] [PMC free article] [PubMed] [Google Scholar]


