

Abstract
AIM
To evaluate the value of quantitative diffusion tensor imaging (DTI) in assessing the axonal and myelin damage of the optic nerves and optic radiations in patients with chronic primary angle-closure glaucoma (PACG) by using high-field magnetic resonance (MR) imaging (3T).
METHODS
Twenty patients with bilateral chronic PACG and twenty age- and sex matched disease-free control subjects were enrolled. Conventional MRI and DTI were performed on all subjects using 3T MR scanner. Mean diffusivity (MD), fractional anisotropy (FA), axial diffusivities (AD) and radial diffusivities (RD) of each optic nerve and each optic radiation were measured by using post-processing software of DTI studio 2.3, and then compared between left eyes and right eyes and between patients group and control group. The paired-sample t- test were used.
RESULTS
There was no abnormality in the shape and signal intensity of the optic nerves and optic radiations in patients group and control group on the conventional MRI. No significant differences were observed in the FA, MD, AD and RD between the right and left optic nerves and optic radiations within patients group and control group (P>0.05). The optic nerves and optic radiations of patients with chronic PACG, as compared with control subjects, had significantly higher MD, AD, RD and significantly lower FA (P<0.05).
CONCLUSION
The diffusivity of optic nerves and optic radiations in chronic PACG group showed abnormal and diffusivity parameters could be used markers of axonal and myelin injury in glaucoma.
Keywords: primary angle-closure glaucoma, chronic, optic nerve and optic radiation, diffusion tensor imaging, magnetic resonance imaging
INTRODUCTION
Glaucoma has been estimated the second leading cause of blindness throughout the world, according to the World Health Organization[1]. Glaucoma is characterized by retinal ganglion cell death associated with reductions in the total number of axonal fibers that make up the optic nerve. These changes are progressive and lead to optic nerve head cupping, defects of the retinal nerve fibre layer and corresponding visual field defects[2]. Glaucoma is classified on the basis of the morphology of the anterior chamber angle as primary open angle glaucoma (POAG) or primary angle-closure glaucoma (PACG). The prevalence of PACG was approximately double that of POAG in adult Chinese[3].
Recently some studies have demonstrated that glaucoma is a degenerative disease involving all parts of the central visual pathways[4]–[7]. Conventional magnetic resonance (MR) imaging have been used in the evaluation of POAG and have demonstrated atrophy of the retrobulbar optic nerve in patients with POAG and a decrease of the magnetization-transfer ratio suggestive of degeneration in the chiasma and the visual cortex[8]. The discovery that glaucoma has an extraretinal component has prompted an increased need for neuroimaging technologies which can be used to detect the early changes in vivo and assess the therapeutic efficacy of treatment strategies.
Diffusion tensor imaging (DTI) is a noninvasive MR technique used to study the connectivity and integrity of white matter (WM) in the central nervous system (CNS) tissues by measuring molecular diffusion. Quantitative information about water diffusion include water's preferential direction within a voxel, or fractional anisotropy (FA), and its magnitude independent of directionality, or mean diffusivity (MD), which can be used to characterize axonal architecture and it has been found useful in the differential diagnosis between primary and wallerian (secondary) degeneration[9]. In an experimental rat model, glaucoma was found to be associated with alterations in DTI diffusivity parameters,including FA and radial diffusivities (RD) at the level of the optic nerves[10].
The aim of our study was to evaluate the value of quantitative DTI in assessing the axonal and myelin damage of the optic nerves and optic radiations in chronic PACG by using high-field MR imaging (3T).
SUBJECTS AND METHODS
Subjects
Twenty patients (8 men, 12 women; median age, 55 years old; range, 40-70 years old) with bilateral chronic PACG and twenty age- and sex matched disease-free control subjects (9 men, 11 women; median age, 52.5 years old; range, 38-67 years old) were recruited for this study from September 2012 to October 2013. Diagnosis of chronic PACG was made according to the following criteria: 1) intraocular pressure >21 mm Hg; 2) occludable anterior chamber angle without characteristics of congenital or secondary glaucoma; 3) visual field defects typical of glaucoma. Exclusion criteria as followed: 1) other diseases causing ocular hypertension (e.g. iridocyclitis, eye trauma); 2) optic neuropathy (e.g. infection, inflammation, ischemic disease, compressive lesions); 3) history of intraocular surgery and other intraocular eye diseases; 4) other diseases that affect the visual field (e.g. pituitary lesions, demyelinating diseases, human immunodeficiency virus infection or AIDS, diabetic retinopathy, age-related macular degeneration); 5) patients with strokes, microhemorrhages, demyelination, and small-vessel diseases, which can have marked impact on DTI parameters, were ruled out.
Informed and written consent was obtained from all individuals, and the study was approved by the local ethical review boards in accordance with the Declaration of Helsinki.
Imaging Protocol
All MR examinations were performed with a 3T scanner (GE, Signa HDxt). A dedicated eight-element head coil was used for radiofrequency signal transmission and reception. Subjects were instructed to focus their vision on a fixation point during MR imaging to reduce motion artifacts. Routine MR imaging of the brain, including axial T1 weigthed images (T1WI), axial T2 weigthed images (T2WI) and sagittal fluid attenuated inversion recovery (FLAIR), were performed to exclude intracranial diseases. DTI of the visual pathway was obtained by using an single-shot spin-echo echo planar imaging (SS SE-EPI) sequence with the following parameters: repetition time (TR), 10600 ms; echo time (TE), 86 ms; field of view (FOV), 240×240-mm; matrix size, 130×128; b=1000 s/mm2; section thickness, 2 mm; no intersection gap; number of excitations (NEX) =2 and 12 diffusion-gradient directions. A baseline image with no diffusion weighting (b=0) was also acquired. The acquisition time was 256s.
Data Processing
Two radiologists, who were blinded to the patients' clinical data, processed the data in consensus by using DTI studio 2.3 (Hopkins University). We created DT trace images by averaging all 12 diffusion weighted images, and FA, λ1, λ2 and λ3 maps were automatically created. Three regions of interest (ROIs) of approximately 5 mm2 (range, 4-6 mm2) were manually drawn on the directional encoded color (DEC) images at the level of the middle part of the orbital optic nerve (to avoid the eye movement artifact and the effect of the posterior optic chiasma, bone and gas; Figure 1). The ROIs were then electronically superimposed over the FA, λ1, λ2 and λ3 maps. For each optic nerve, we calculated the mean FA, λ1, λ2 and λ3 value, which represented the averages of values calculated for each of the three ROIs. Mean diffusivites (MD) and enginvalue (λ‖, λ⊥) were obtained by calculating: MD= [(λ1, λ2, λ3)/3],axial diffusivities (AD, λ‖)=λ1, radial diffusivities (RD, λ⊥)= [(λ2+λ3)/2]. ROIs were also manually drawn on the reference DEC images at the level of the middle part of the radiation of trigone of bilateral lateral ventricle (Figure 2). The same method was used to evaluate the FA, MD, AD and RD values of optic radiations.
Figure 1. Three ROIs in the middle of bilateral optic nerve.
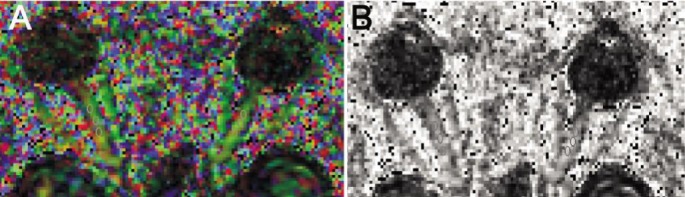
A: DEC map of bilateral optic nerve; B: FA map of bilateral optic nerve.
Figure 2. Three ROIs in the middle of bilateral optic nerve radiation.

A: DEC map of bilateral optic radiation; B: FA map of bilateral optic radiation.
Statistical Analysis
Statistical analyses were performed by using the Statistical Package for the Social Sciences, Version 13.0 for Windows. Differences between the left eyes and right eyes within groups were explored by using the paired t test, and differences between patients and controls were evaluated by using the paired-sample t test. P<0.05 was considered to indicate a significant difference.
RESULTS
Ophthalmological Examination
There was no significant difference between the left and right sides, so the data on the IOP and c/d ratio from both sides were combined. The mean IOP was significantly higher in the patients (30.6±7.56) than in the control subjects (15.45±2.87; t=11.15, P=0.000), and the mean c/d ratio was significantly higher in the patients (0.67±0.08) than in the control subjects (0.23±0.06; t= 17.87, P= 0.000).
Routine Magnetic Resonance Imaging
There was no abnormality in the shape and signal intensity of the optic nerve and optic radiations in patients group and control group on routine brain MR imaging.
Diffusion Tensor Imaging Parameters Differences Between Left and Right Optic Nerve and Optic Radiation Within Group
No significant differences were observed in the FA, MD, AD and RD between the right and left optic nerve and optic radiation within patients group and control group (P>0.05; Table 1).
Table 1. Comparison of DTI parameters between the right and left optic nerves and optic radiations within patients and control group.
| Parameters | Bilateral optic nerve |
Bilateral optic radiation |
||||||
| LON | RON | t | P | LOR | ROR | t | P | |
| FA-P | 0.246±0.031 | 0.258±0.047 | -1.424 | 0.158 | 0.419±0.056 | 0.428±0.177 | -1.484 | 0.153 |
| MD-P | 1.630±0.069 | 1.596±0.064 | 0.456 | 0.670 | 0.960±0.049 | 0.976±0.065 | 0.434 | 0.677 |
| AD-P | 2.229±0.056 | 2.330±0.069 | 0.392 | 0.697 | 1.829±0.026 | 1.830±0.043 | 0.492 | 0.660 |
| RD-P | 1.528±0.049 | 1.631±0.065 | 0.562 | 0.471 | 1.528±0.032 | 1.534±0.012 | 0.456 | 0.670 |
| FA-C | 0.559±0.046 | 0.561±0.047 | -0.784 | 0.436 | 0.610±0.019 | 0.598±0.467 | 0.494 | 0.658 |
| MD-C | 1.178±0.089 | 1.224±0.024 | -0.456 | 0.670 | 0.830±0.059 | 0.846±0.014 | 0.626 | 0.529 |
| AD-C | 1.929±0.096 | 2.032±0.019 | 0.493 | 0.599 | 1.529±0.067 | 1.530±0.099 | -0.342 | 0.721 |
| RD-C | 0.728±0.069 | 0.731±0.045 | 0.612 | 0.533 | 0.538±0.039 | 0.531±0.056 | 0.425 | 0.680 |
LON: Left optic nerve; RON: Right optic nerve; LOR: Left optic radiation; ROR: Right optic radiation; FA: Fractional anisotropy; MD: Mean diffusivity; AD:Axial diffusivity; RD: Radial diffusivity; P: Patients; C: Control (MD value, AD, RD)×10−3-mm2/s.
Diffusion Tensor Imaging Parameters Differences Between Patient and Control Group
Mean FA values of optic nerves and optic radiations in the patient group were significantly lower than those in the control group (P<0.01), and mean MD, AD, RD values of optic nerves and optic radiations in the patient group were significantly higher than those in the control group (P<0.01; Table 2).
Table 2. Comparison of DTI parameters of optic nerve and optic radiation between patient and control group.
| Parameters | Patient group | Control group | t | P |
| Optic nerve | ||||
| FA | 0.252±0.062 | 0.555±0.054 | -11.66 | 0.000 |
| MD | 1.613±0.275 | 1.201±0.236 | 4.534 | 0.000 |
| AD | 2.279±0.461 | 1.980±0.323 | 2.276 | 0.035 |
| RD | 1.579±0.235 | 0.729±0.159 | 11.475 | 0.000 |
| Optic radiation | ||||
| FA | 0.424±0.052 | 0.604±0.0465 | -15.046 | 0.000 |
| MD | 0.968±0.076 | 0.838±0.104 | 2.515 | 0.021 |
| AD | 1.829±0.098 | 1.529±0.180 | 3.176 | 0.005 |
| RD | 1.531±0.134 | 0.534±0.072 | 19.516 | 0.000 |
FA: Fractional anisotropy; MD: Mean diffusivity; AD: Axial diffusivity; RD: Radial diffusivity; Control group: (MD value, AD, RD)×10−3-mm2/s.
DISCUSION
DTI is widely recognized imaging modality to study the connectivity and integrity of WM in CNS tissues. To accurately assess axonal and myelin damage, directional diffusivities derived from DTI have been proposed to serve as biomarkers of axonal and myelin damage[11]. In DTI, MD is a widely used parameter that measures the magnitude of diffusion of water molecules within cerebral tissue. FA measures the fraction of the magnitude of diffusivity that can be ascribed to anisotropic diffusion, which is thought to reflect fiber attenuation, axonal diameter, and myelination in WM. FA is calculated from the 3 eigenvalues (λ1, λ2, λ3) of the diffusion tensor. MD and FA, as the secondary parameters are reference frame independent and prove to be sensitive to pathology[12]. However, despite being sensitive, the lack of specificity to the underlying CNS pathology limits the use of these measures when differentiating the pathologies is clinically important. For example, reduced FA and elevated MD, as often observed at pathological regions in CNS WM from MS patients, do not always discriminate axonal damage from myelin pathology[13],[14].
In our study, mean FA values of optic nerves and optic radiations in the patient group were significantly lower than those in the control group (P<0.05), and mean MD, AD, RD values of optic nerves and optic radiations in the patient group were significantly higher than those in the control group (P<0.05).Our data suggest that in chronic PACG there are axonal and myelin damage in the optic nerves and optic radiations, which were consistent with Garaci et al[15] study. Their results showed that alterations in MD and FA are present in the optic nerves and optic radiations of patients with POAG. Some studies conducted have revealed that glaucoma is an optic neuropathy that also involves brain stations in the visual pathway[4],[16]. Increased MD and decreased FA have been reported to reflect axonal disruption[17],[18], and progressive increases in MD and progressive decreases in FA have been confirmed in the optic nerves of rats with experimentally induced glaucoma[19].
Additionally, in our study, significant differences in AD and RD of the optic nerve and optic radiation were observed between the patients with chronic PACG and the control. FA is the most widely used measure of anisotropy in DTI. However, FA does not describe the full tensor shape or distribution because different eigenvalue combinations can generate the same FA values[20]. Thus eigenvalues may be more sensitive than FA in quantifying pathology. Several studies have also suggested that the eigenvalue amplitudes or combinations of the eigenvalues (e.g. λ⊥) demonstrate more specific relationships to WM pathology[12]. The mean of the orthogonal eigenvalues, λ⊥, reflects diffusion orthogonal to the axis of optic nerve and optic radiation, whereas λ‖ represents the diffusion coefficient along the principal direction of diffusion parallel to the nerve. In the rat glaucoma model RD ( λ⊥) of the optic nerve was increasing with time after glaucoma induction, whereas there was no significant change in the axial diffusivity (λ‖), which were attributed to the 10% decrease in the axonal density in the histological staining of the optic nerve[11]. Our data showed that not only RD but also AD of the optic nerve and optic radiation in the patients with chronic PACG significantly increased compared to the control, which suggested there occur axon and myelin degeneration in optic nerve and optic radiation. Garaci et al[15] study showed in the patients with POAG there was a correlation between DTI parameters, including FA and MD of the optic nerves and glaucoma severity and glaucoma stages. On the basis of these studies we suggest that DTI could be useful for quantifying glaucoma-induced neuromorphologic damage and thus establishing disease severity, particularly in patients who have functional conditions, such as impaired fixation and stability, which challenge the reliability of their visual field. However, further and more comprehensive studies in PACG patients are needed to determine whether there is a correlation between DTI parameters of the visual pathways and glaucoma severity
Our analysis of the DTI parameter was based on an ROI approach that was highly dependent on the observer and the anatomic cues used in ROI positioning. However, in our study the ROIs were positioned on the reference DEC images and then electronically superimposed over the MD, FA, RD and AD maps. In DEC images different fiber directions were encoded by different color, so ROIs setting on DEC images can increase the accuracy of the ROI placements.
Our study had limitations: the relatively small sample size resulted in a lack of correlation analysis between optic nerve and optic radiation diffusivity features and the different glaucoma stages, which are needed to study further in a large sample size. Another limitation of our study was the difficulty in identifying the optic radiations. When the optic radiations traverse the parietal lobe, they lie lateral to the posterior horn of the lateral ventricle, close to the tapetum of the corpus callosum and the inferior occipitofrontal and longitudinal fasciculi. Although we cannot exclude the possibility that some of these fibers were included in our ROI analysis, we assumed that the majority of the fibers belonged to the optic radiations because multiple ROI DT tractography was performed to increase the accuracy of ROI placement.
In conclusion, the diffusivity of optic nerve and optic radiations in primary chronic angle-closure glaucoma group showed abnormal and diffusivity parameters could be used markers of axonal and myelin injury in glaucoma, which cannot be detected by conventional MRI.
Acknowledgments
The authors wish to thank Dr. Xiong Lei from Department of Ophthalmology for referral of patients.
Conflicts of Interest: Zhang QJ, None; Wang D, None; Bai ZL, None; Ren BC, None; Li XH, None.
REFERENCES
- 1.Quigley HA, Broman AT. The number of people with glaucoma worldwide in 2010 and 2020. Br J Ophthalmol. 2006;90(3):262–267. doi: 10.1136/bjo.2005.081224. [DOI] [PMC free article] [PubMed] [Google Scholar]
- 2.Nucci C, Martucci A, Cesareo M, Mancino R, Russo R, Bagetta G, Cerulli L, Garaci FG. Brain involvement in glaucoma: advanced neuroimaging for understanding and monitoring a new target for therapy. Curr Opin Pharmacol. 2013;13(1):128–133. doi: 10.1016/j.coph.2012.08.004. [DOI] [PubMed] [Google Scholar]
- 3.Cheng JW, Cheng SW, Ma XY, Cai JP, Li Y, Wei RL. The prevalence of primary glaucoma in mainland China: a systematic review and meta-analysis. J Glaucoma. 2013;22(4):301–306. doi: 10.1097/IJG.0b013e31824083ca. [DOI] [PubMed] [Google Scholar]
- 4.Gupta N, Yucel YH. Glaucoma as a neurodegenerative disease. Curr Opin Ophthalmol. 2007;18(2):110–114. doi: 10.1097/ICU.0b013e3280895aea. [DOI] [PubMed] [Google Scholar]
- 5.Chen Z, Wang J, Lin F, Dai H, Mu K, Zhang H. Correlation between lateral geniculate nucleus atrophy and damage to the optic disc in glaucoma. J Neuroradiol. 2013;40(4):281–287. doi: 10.1016/j.neurad.2012.10.004. [DOI] [PubMed] [Google Scholar]
- 6.Gupta N, Greenberg G, de Tilly LN, Gray B, Polemidiotis M, Yücel YH. Atrophy of the lateral geniculate nucleus in human glaucoma detected by magnetic resonance imaging. Br J Ophthalmol. 2009;93(1):56–60. doi: 10.1136/bjo.2008.138172. [DOI] [PMC free article] [PubMed] [Google Scholar]
- 7.Gupta N, Ang LC, Noel de Tilly L, Bidaisee L, Yucel YH. Human glaucoma and neural degeneration in intracranial optic nerve, lateral geniculate nucleus, and visual cortex. Br J Ophthalmol. 2006;90(6):674–678. doi: 10.1136/bjo.2005.086769. [DOI] [PMC free article] [PubMed] [Google Scholar]
- 8.Kitsos G, Zikou AK, Bagli E, Kosta P, Argyropoulou MI. Conventional MRI and magnetisation transfer imaging of the brain and optic pathway in primary open-angle glaucoma. Br J Radiol. 2009;82(983):896–900. doi: 10.1259/bjr/55866125. [DOI] [PubMed] [Google Scholar]
- 9.Qin W, Zhang M, Piao Y, Guo D, Zhu Z, Tian X, Li K, Yu C. Wallerian degeneration in central nervous system: dynamic associations between diffusion indices and their underlying pathology. PLoS One. 2012;7(7):e41441. doi: 10.1371/journal.pone.0041441. [DOI] [PMC free article] [PubMed] [Google Scholar]
- 10.Hui ES, Fu QL, So KF, Wu EX. Diffusion tensor MR study of optic nerve degeneration in glaucoma. Conf Proc IEEE Eng Med Biol Soc. 2007;2007:4312–4315. doi: 10.1109/IEMBS.2007.4353290. [DOI] [PubMed] [Google Scholar]
- 11.Budde MD, Kim JH, Liang HF, Schmidt RE, Russell JH, Cross AH, Song SK. Toward accurate diagnosis of white matter pathology using diffusion tensor imaging. Magn Reson Med. 2007;57(4):688–695. doi: 10.1002/mrm.21200. [DOI] [PubMed] [Google Scholar]
- 12.Tuor UI, Morgunov M, Sule M, Qiao M, Clark D, Rushforth D, Foniok T, Kirton A. Cellular correlates of longitudinal diffusion tensor imaging of axonal degeneration following hypoxic–ischemic cerebral infarction in neonatal rats. Neuroimage Clin. 2014;6(7):32–42. doi: 10.1016/j.nicl.2014.08.003. [DOI] [PMC free article] [PubMed] [Google Scholar]
- 13.Goldberg-Zimring D, Mewes AU, Maddah M, Warfield SK. Diffusion tensor magnetic resonance imaging in multiple sclerosis. J Neuroimaging. 2005;15(4 Suppl):68S–81S. doi: 10.1177/1051228405283363. [DOI] [PubMed] [Google Scholar]
- 14.Boretius S, Escher A, Dallenga T, Wrzos C, Tammer R, Brück W, Nessler S, Frahm J, Stadelmann C. Assessment of lesion pathology in a new animal model of MS by multiparametric MRI and DTI. Neuroimage. 2012;59(3):2678–2688. doi: 10.1016/j.neuroimage.2011.08.051. [DOI] [PubMed] [Google Scholar]
- 15.Garaci FG, Bolacchi F, Cerulli A, Melis M, Spano A, Cedrone C, Floris R, Simonetti G, Nucci C. Optic nerve and optic radiation neurodegeneration in patients with glaucoma: in vivo analysis with 3-T diffusion-tensor MR imaging. Radiology. 2009;252(2):496–501. doi: 10.1148/radiol.2522081240. [DOI] [PubMed] [Google Scholar]
- 16.Gupta N, Yucel YH. What changes can we expect in the brain of glaucoma patients? Surv Ophthalmol. 2007;52(Suppl. 2):S122–S126. doi: 10.1016/j.survophthal.2007.08.006. [DOI] [PubMed] [Google Scholar]
- 17.Trip SA, Wheeler-Kingshott C, Jones SJ, Li WY, Barker GJ, Thompson AJ, Plant GT, Miller DH. Optic nerve diffusion tensor imaging in optic neuritis. Neuroimage. 2006;30(2):498–505. doi: 10.1016/j.neuroimage.2005.09.024. [DOI] [PubMed] [Google Scholar]
- 18.Kolbe S, Bajraszewski C, Chapman C, Nguyen T, Mitchell P, Paine M, Butzkueven H, Johnston L, Kilpatrick T, Egan G. Diffusion tensor imaging of the optic radiations after optic neuritis. Hum Brain Mapp. 2012;33(9):2047–2061. doi: 10.1002/hbm.21343. [DOI] [PMC free article] [PubMed] [Google Scholar]
- 19.Zhang X, Sun P, Wang J, Wang Q, Song SK. Diffusion tensor imaging detects retinal ganglion cell axon damage in the mouse model of optic nerve crush. Invest Ophthalmol Vis Sci. 2011;52(9):7001–7006. doi: 10.1167/iovs.11-7619. [DOI] [PMC free article] [PubMed] [Google Scholar]
- 20.Alexander AL, Hasan K, Kindlmann G, Parker DL, Tsuruda JS. A geometric analysis of diffusion tensor measurements of the human brain. Magn Reson Med. 2000;44(2):283–291. doi: 10.1002/1522-2594(200008)44:2<283::aid-mrm16>3.0.co;2-v. [DOI] [PubMed] [Google Scholar]