

We were recently made aware of an error in the equation that we used to estimate acetylation stoichiometry in the above-mentioned article. While this error does not have a major impact on our results or their interpretation, some of the numbers are changed slightly and here we provide updated figures and tables, the equation used, and the revised stoichiometry estimates for individual sites.
To calculate initial stoichiometry (SI), we previously divided the degree of partial chemical acetylation (C) by the SILAC ratio (R) of increased acetylation after partial chemical acetylation, SI = C/R. However, in the correct equation, the SILAC ratio should be subtracted by (1−C), SI = C/(R−(1−C)). This equation was derived as follows. If the final stoichiometry is (SF) = SI + C(1−SI) and the acetylated peptide SILAC ratio (R) = SF/SI, then solving the above equation for SI in terms of SF/SI yields SI = C/((SF/SI) −(1−C)) = C/(R−(1−C)). We determined that C was < 1%, and we estimated stoichiometry using the conservative assumption that C = 1% (0.01); therefore, we previously calculated stoichiometry using the equation S = 0.01/R, while the correct equation is S = 0.01/(R−0.99). We further realized that we could use a previously published equation (Olsen et al, 2010) for calculating stoichiometry and this equation yielded results identical to the revised formula presented above. We now include both equations and the updated stoichiometry estimates in Supplementary Table S9. The new equation had a very small impact on our stoichiometry estimates. Regardless, we have updated Figure5D and 5H (see below), which were based on our stoichiometry estimates. Most of our other analyses were based on the SILAC ratio after chemical acetylation; therefore, these results were independent of the stoichiometry calculation.
Figure 5.
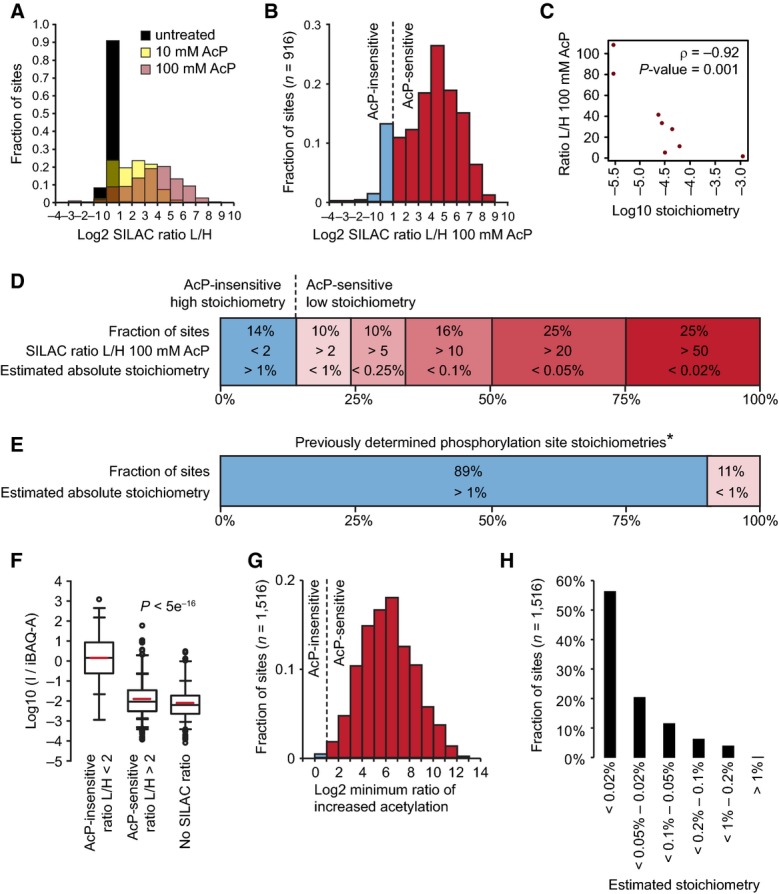
- The majority of yeast acetylation sites are highly sensitive to partial chemical acetylation by AcP. The histogram shows the distribution of SILAC L/H ratios for the indicated samples.
- AcP caused substantially increased acetylation at a majority of sites. The histogram shows acetylation changes induced by 100 mM AcP in two experimental replicates, and only sites that were independently identified in cells without AcP treatment are shown.
- Acetylation stoichiometry is inversely proportional to AcP sensitivity. The scatterplot shows the relationship between AcP sensitivity (SILAC ratio L/H 100 mM AcP) and acetylation stoichiometry (Log10 stoichiometry) as determined by AQUA analysis (Table 1). The Spearman's correlation (ρ) and the significance by two-tailed test (P-value) are shown.
- Most acetylation occurs with a low stoichiometry. Absolute acetylation site stoichiometries were estimated based on relative abundance changes (SILAC ratio L/H) after treatment with 100 mM AcP and using an estimate that AcP treatment caused < 1% chemical acetylation.
- For comparison, previously determined phosphorylation site stoichiometries are shown *(Wu et al, 2011).
- iBAQ-based abundance corrected acetylated peptide intensity (I/iBAQ-A) is proportional to AcP sensitivity. The box plots show the distributions of I/iBAQ-A values for the indicated classes of acetylation sites. AcP-insensitive sites had a significantly (P) higher distribution of I/iBAQ-A values by Wilcoxon test.
- Sites without SILAC ratios are highly sensitive to AcP. The minimum ratio of increased acetylation was determined by calculating the increased intensity of AcP-treated “light” peptides relative to an empirically determined detection limit for “heavy” SILAC peptides.
- Absolute acetylation stoichiometry of sites without SILAC ratios was estimated to be very low. Stoichiometry was estimated by the same method used to estimate stoichiometry of sites with SILAC ratios in (D) using the minimum ratios of increased acetylation shown in (G).
An additional issue is that several of the sites we previously classified as having a high stoichiometry (SILAC ratio L/H < 2) were quantified on doubly acetylated peptides. However, we cannot accurately estimate the degree of partial chemical acetylation at individual sites on doubly acetylated peptides, and for this reason, we could not accurately estimate stoichiometry of acetylation sites occurring on such peptides. In our dataset, doubly acetylated peptides accounted for 20 sites, 14 of which were estimated to have high stoichiometry. These 14 sites included histone H4 (Hhf1) lysines 6, 9, 13, and 17; histone H2AZ (Htz1) lysines 4, 9, and 11; histone H2B (Htb2) lysine 17; Esa1 lysines 6 and 13; Ahc1 lysines 532 and 538; Sgf73 lysine 199; and Snf2 lysine 1494. Sites quantified on doubly acetylated peptides are likely to have a high stoichiometry (the presence of two acetylation sites on the same peptide suggests as much); however, we cannot confidently estimate the stoichiometry of sites that were quantified on these peptides. Sites quantified using doubly acetylated peptides are now indicated in Supplementary Table S9 and we re-analyzed our data excluding these sites, which resulted in changes to Figure6A, 6B, and 6D. In addition, to reflect the new analysis excluding sites quantified on doubly acetylated peptides, two portions of the section entitled “Functional analysis of proteins with high stoichiometry acetylation sites” should read as follows (changes are underlined):
– “Half of the AcP-insensitive sites occurred on histones, proteins present in histone deacetylase (HDAC) or histone acetyltransferase (HAT) complexes, and on transcription factors. We compared the effect of AcP-treatment on proteins present in different subcellular compartments (Figure6B). Consistent with GO term analysis, 68% of the high-stoichiometry, AcP-insensitive sites occurred on nuclear proteins. In contrast, 97% of mitochondrial and 94% of cytoplasmic acetylation sites were AcP-sensitive, indicating that the vast majority of acetylation sites in these subcellular compartments were acetylated at a low stoichiometry.”
– “Acetylated sites with high stoichiometry are likely to be important for protein function. Many previously known regulatory acetylation sites were AcP-insensitive, including Smc3 lysines 112 and 113(Zhang et al, 2008), Sas2 (MYST homolog) lysine 168 (Yuan et al, 2012), Yng2 lysine 170 (Lin et al, 2008), RTT109 lysine 290 (Albaugh et al, 2011b), SNF2 lysine 1498(Kim et al, 2010), histone H2AZ (Htz1) lysine 15 (Babiarz et al, 2006; Lin et al, 2008; Millar et al, 2006), histone H3 (Hht1) lysines 19, 24, and 57 (Hyland et al, 2005; Suka et al, 2001; Zhang et al, 1998), and histone H2B (Htb2) lysines 16. These 11 sites constitute 11% of the 97 AcP-insensitive sites that we identified, indicating that AcP-insensitivity is a good predictor of functionally important acetylation sites. The enrichment of functionally characterized sites within the group of AcP-insensitive sites is highly significant (P = 1e-11, Fisher exact test).”
Figure 6.

- AcP-insensitive acetylation sites occur on proteins associated with nuclear processes. Gene Ontology (GO) term enrichment was performed by comparing proteins with AcP-insensitive acetylation sites (ratio L/H < 2) to all acetylated proteins. The bar graph shows the percentage of AcP-insensitive sites occurring on proteins associated with the indicated GO terms. P-values (P) indicate the statistical significance of GO term enrichment by Fishers exact test.
- AcP-insensitive acetylation sites occur on nuclear proteins. The histogram shows the distribution of SILAC L/H ratios occurring on proteins localized to the indicated subcellular compartments.
- Acetylated peptides from mitochondrial proteins have a significantly higher median I/iBAQ-A value compared to acetylated peptides from cytoplasmic proteins. The box plots show the iBAQ-based abundance-corrected peptide intensity (I/iBAQ-A) distributions for the indicated classes of peptides occurring on mitochondrial (Mito.) or cytoplasmic (Cyto.) proteins. Significance (P) was determined by Wilcoxon test.
- AcP-insensitive sites (SILAC Ratio < 2) have a significantly different subcellular distribution. Sites without SILAC ratios (No ratio) have a similar subcellular distribution to AcP-sensitive sites (SILAC Ratio > 2). The bar graph shows the fraction of sites localized to the indicated subcellular compartments: mitochondria (Mito.), cytoplasm (Cyto.), or nucleus (Nuc.). Significance (P) was calculated by Fisher exact test.
- Detection of acetylation sites is biased to occur on abundant proteins, and this bias is more pronounced for sites with the lowest estimated stoichiometries. The histograms show the distributions of iBAQ protein abundances for observed proteins (n = 3,104). The distributions of the indicated classes of acetylation sites occurring exclusively in the indicated subcellular compartments are shown in red. The numbers of acetylated proteins are shown in parenthesis, and the median Log10 iBAQ abundance for these acetylated proteins is shown.
The authors apologize for these errors and for any inconvenience caused.
Supporting Information
Table S9
Reference
- Olsen JV, Vermeulen M, Santamaria A, Kumar C, Miller ML, Jensen LJ, Gnad F, Cox J, Jensen TS, Nigg EA, Brunak S, Mann M. Quantitative phosphoproteomics reveals widespread full phosphorylation site occupancy during mitosis. Science Signaling. 2010;3:ra3. doi: 10.1126/scisignal.2000475. [DOI] [PubMed] [Google Scholar]
Associated Data
This section collects any data citations, data availability statements, or supplementary materials included in this article.
Supplementary Materials
Table S9