Abstract
Gefitinib is a tyrosine kinase inhibitor that has been used for the treatment of non-small-cell lung carcinoma (NSCLC). The ability of miR-7 to enhance gefitinib-induced cytotoxicity in NSCLC cells was evaluated in this study. We found that miR-7 significantly decreased the IC50 of gefitinib and inhibited cell growth. G0/G1 cell cycle arrest and cell apoptosis were increased after the treatment of gefitinib coupled with miR-7 transfection. In addition, levels of Raf1, IGF1R, and PI3K and phosphorylation levels of Akt and ERK were also significantly decreased. Our results suggest that miR-7 may provide a novel therapeutic target for the treatment of NSCLCs.
Keywords: non-small-cell lung carcinoma, gefitinib, miR-7, epidermal growth factor receptor
Introduction
Lung cancer is one of the leading causes of cancer-related death worldwide. Non-small cell lung cancers (NSCLCs) account for approximately 80% of all cases of lung cancer [1, 2]. Although NSCLC is a remarkably heterogeneous disease, activation of the epidermal growth factor receptor (EGFR) is found in 40 to 80 per cent of NSCLCs. The tyrosine kinase inhibitor gefitinib is a typical targeted therapy drug that inhibits EGFR in individuals with NSCLC. EGFR mutation related to tyrosine kinase inhibitor (TKI) responsiveness in NSCLC has become an important issue for therapeutic decision-making in NSCLC patients [3, 4]. Recently a number of research projects have indicated that activation of the insulin-like growth factor-1 receptor (IGF1R) induces resistance to EGFR antagonism in several cancers [5–7].
Emerging as key regulators in the pathogenesis of cancer, microRNAs (miRNAs) are short, endogenous, non-coding RNA molecules that bind with imperfect complementarity to the 3’-untranslated regions (3’-UTRs) of target mRNAs, causing translational repression or degradation of the target mRNA [8–11]. By regulating the expression of their target genes, miRNAs profoundly influence a wide variety of pathways, thereby acting as oncogenes or tumour suppressors [12, 13]. Indeed, a number of differentially regulated miRNAs, such as miR-155 [14, 15], let-7a [16], miR-21 [14], miR-34a [17], and miR-7 [18–22], have been identified as functionally associated with cancer cell proliferation, invasion, and metastasis. Among them, miR-7 is suggested to be a putative tumour suppressor in breast cancer and glioblastoma [18, 19, 21], and the level of miR-7 is reduced in several NSCLC cell lines [22]. However, the biological function of miR-7 in lung cancer, especially in NSCLC, and the underlying mechanisms remain to be further elucidated.
In this study, we evaluated the ability of miR-7 to overcome cellular resistance and enhance gefitinib-induced cytotoxicity in human lung adenocarcinoma A549 cells, which have a reduced level of miR-7. Cell viability, cell cycle, and apoptosis were measured for A549 cells treated with a low concentration of gefitinib and transfected with miR-7 mimics. Finally, we evaluated the basal protein expression and activation status of the IGF1R/PI3K and EGFR/Raf1 pathway components in an effort to reveal the underlying mechanism of miR-7 effects. This study provides an important insight into the functions of tumour-suppressive miRNA in lung cancer, and might lead to novel approaches for the improvement of chemotherapy.
Material and methods
Cell culture and reagents
The human adenocarcinoma lung cells (A549 cells) were obtained from the central laboratory of China Medical University. All cell culture reagents were purchased from Invitrogen Corporation. Cells were cultured in RPMI-1640 supplemented with 10% foetal bovine serum at 37°C and 5% CO2. Cells in exponential growth were used in all experiments. The miR-7 sequence was from mirBase (www.mirbase.com). Synthetic miRNA mimics, FAM-labelled miRNA were purchased from Ambion (Austin, TX). Lipofectamine 2000 was purchased from Invitrogen. The MiRNA reverse transcription Kit was purchased from TAKALA. Gefitinib (IRESSA) from AstraZeneca was diluted in dimethyl sulfoxide (DMSO). Antibodies used for western blotting were purchased from Santa Cruz Biotechnology, Inc.
Transfection efficiencies
The transfection efficiencies were estimated using a fluorescence microscope. A549 cells in 24-well plates (2 × 10⁵ cells/well) were transfected with 25 nM of FAM-labelled miRNA. The culture medium was changed six hours after transfection. Fluorescent cells were counted 48 hours or 72 hours after transfection. The transfection efficiency = number of fluorescent cells / total cell number × 100%. The experiments were performed in triplicate, and average values were reported.
Real-time quantitative reverse transcription polymerase chain reaction (qRT-PCR)
A549 cells in 24-well plates (2 × 10⁵ cells/well) were transfected with 25 nM of miR-7 precursor molecules or a negative control. Total RNA was prepared using Trizol 48 or 72 hours after transfection. cDNA was synthesised using the One Step PrimeScriptTM miRNA cDNA Synthesis Kit (TAKALA), according to the manufacturer's instructions. The cycle number at which the reaction crossed an arbitrarily placed threshold (Ct) was determined for each gene, and the relative amount of mir-7 to U6 snRNA was calculated using the equation 2–ΔΔCt, where ΔΔCt = (CtmiRNA –CtU6 snRNA)transfected - ( CtmiRNA – CtU6 snRNA)control [23].
Growth inhibition assay
A549 cells were transfected with 25 nM of miR-7 mimics in 96-well plates. 48 or 72 hours post-transfection, gefitinib was added in five different concentrations (0 µM, 2.5 µM, 5 µM, 2,5 µM, 25 µM), with five replicate plate columns per treatment. Cell growth was detected by 3-(4,5-dimethylthiazol-2-yl)-2,5-diphenyl-2H-tetrazolium bromide (MTT) kit (SIGMA), according to the manufacturer's instructions. Briefly, 48 hours after gefitinib treatment, culture medium in each well was replaced with 100 µl of fresh serum-free medium with 0.5 g/l MTT. After incubation at 37°C for 4 hours, the MTT medium was removed by aspiration and 50 µl of DMSO was added to each well. After incubation at 37°C for another 10 minutes, the A540 of each sample was measured using a plate reader. The growth inhibition rate was calculated using the following formula growth inhibiting rate (IR) = (Dcontrol – Dtarget) / Dcontrol × 100%. The IC50 value for gefitinib was calculated by performing dose response experiments. All experiments were performed in triplicate.
Flow cytometry-based apoptosis and cell cycle analysis
Cells were grown in 6-well plates to approximately 60% confluence and transiently transfected with miR-7. 48 or 72 hours after transfection, the cells were treated with 2.5 µM of gefitinib for 24 hours and then harvested for apoptosis and cell cycle analyses. For the apoptosis assay, cells were resuspended in 1× binding buffer (Clontech). 5 µl of annexin-FITC conjugate and 10 µl of propidium iodide solution were added to each cell suspension separately. For cell cycle analysis, cells were resuspended in PBS and then fixed in ethanol at -20°C overnight. Cells were washed with PBS and resuspended in staining solution (50 µg/ml propidium iodide, 1 mg/ml RNase A, and 0.1% Triton X-100 in PBS). The stained cells (1 × 10⁵) were then analysed with a flow cytometer (FACScalibur; Becton Dickinson).
Western blotting
A549 cells were transfected with 25 nM miR-7 mimics or negative control in 6-well plates (1.0 × 10⁶ cells/well). At 48 or 72 hours post-transfection, gefitinib was added at a concentration of 2.5 µM. After another two hours of incubation, total cell lysates were prepared by lysing cells in RIPA buffer supplemented with phenylmethylsulphonyl fluoride (PMSF, 1: 100) at 4°C for 30 minutes. The total protein of the clarified supernatants was quantified using a bicinchoninic acid assay (BCA) kit. Equal amounts of protein were separated on SDS-polyacrylamide gels and transferred to membranes. For the analysis of protein levels, blots were blocked with 5% milk in TTBS (0.05% Tween-20 in TBS), then probed with antibodies against Raf1, IGF1R, PI3K, ERK, Akt, p-ERK, p-Akt, and β-actin (1: 2000 SANTA), and detected with horseradish peroxidase-conjugated secondary antibody (1: 5000). The signals were visualised using an ECL luminescence instrument, and image densitometry was performed with GENE SNAPTM.
Statistical analysis
The differences between the two groups were evaluated using unpaired Student's t-test. Analyses were performed using GraphPad Prism version 5.0 for Windows (GraphPad Software, San Diego, CA).
Results
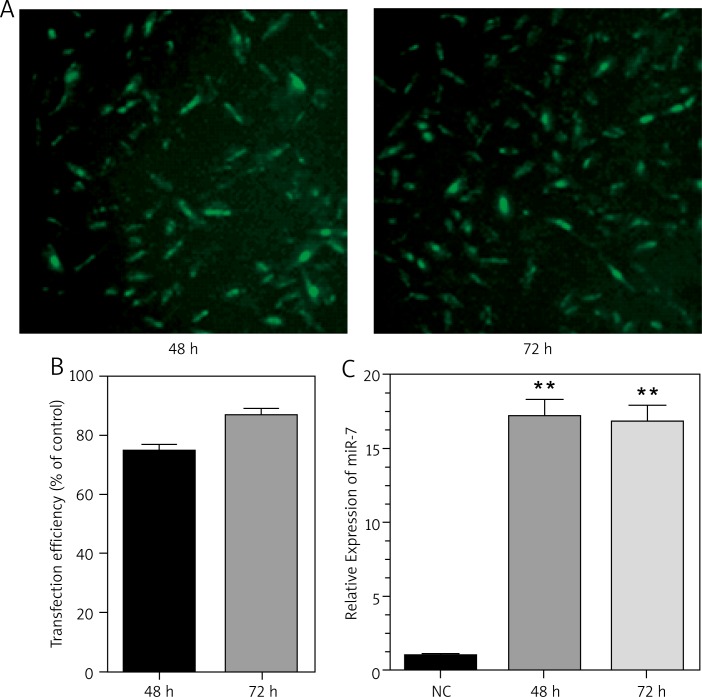
In order to investigate the time-dependent effect of miR-7 in A549 cells, cells were analysed after being transfected with 25 nM of miR-7 mimics for various times. Using FAM-labelled RNA, the transfection efficiency was estimated to be 76.7% at 48 hours after transfection and 86.2% at 72 hours after transfection (Fig. 1A and B). We also measured the expression levels of mir-7 in A549 cells by qRT-PCR. Compared to cells transfected with the control mimics, mir-7 expression level in A549 cells transfected with the miR-7 mimics was increased at both 48 hours and 72 hours after transfection (Fig. 1C). miR-7 expression level at 48 hours appeared to be higher than 72 hours. These results indicated that transfection of mir-7 mimics increased mir-7 expression level in cells.
Fig. 1.
Transfection efficiency and miR-7 levels in A549 cells. Transfection efficiency was determined using fluorescence microscopy (A and B), and MiR-7 levels were measured by qRT-PCR (C)
Experiments were performed in triplicate, and data were shown as mean ± SD
**significantly different from the control (NC) (p < 0.005)
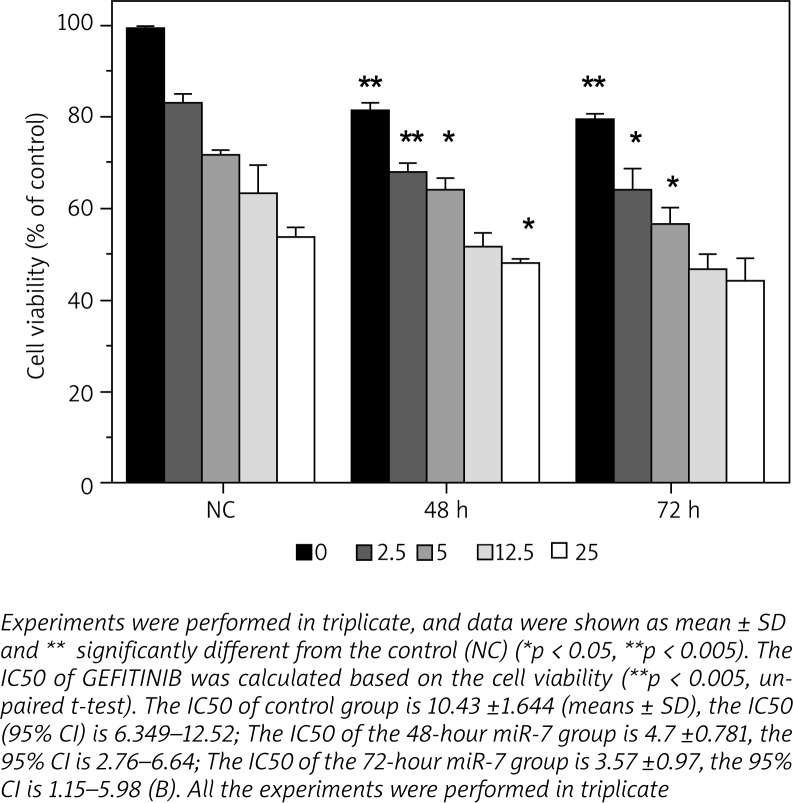
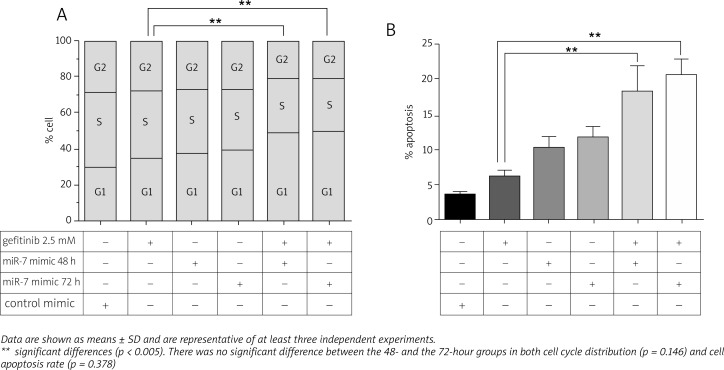
To test whether mir-7 in combination with an anti-EGFR inhibitor results in enhanced cytotoxic effect in A549 cells, cells were transfected with either the negative control or the mir-7 mimics, and then treated with various concentrations of GEFITINIB. Growth inhibition rates for each group were measured. For all the five concentrations of GEFITINIB tested, miR-7 and GEFITINIB co-treatment resulted in enhanced inhibition of A549 cell growth as compared to the single agent treatment (Fig. 2). This enhanced inhibitory effect was most noticeable in the group where GEFITINIB was added 72 hours after transfection of miR-7 mimics. Because serum can activate growth factor pathways parallel to the EGFR pathway, thus bypassing the inhibition of EGFR, growth inhibition assays were carried out under low serum conditions (0.5%). The IC50 of GEFITINIB was calculated based on the cell viability, which showed that miR-7 elevated GEFITINIB sensitivity five fold in A549 cells treated with GEFITINIB 48 hours after transfection (p < 0.05) and six fold in cells treated with GEFITINIB 72 hours after transfection (p < 0.05) (Table 1). Cell cycle was also affected by mir-7 and/or GEFITINIB (Fig. 3). As shown in Fig. 4, miR-7 resulted in G0/G1 cell cycle arrest (Fig. 4C) and induced cell apoptosis in A549 cells (Figure 3A and B). In addition, mir-7 co-treatment with GEFITINIB resulted in more cells to be arrested in the G0/G1 phase and increased the percentage of apoptotic cells. There was no significant difference in cell apoptosis between the 48-hour and 72-hour groups.
Fig. 2.
Effect of miR-7 on the sensitivity of GEFITINIB in H460 and A549 cells. After transfected with miR-7 for 24 hours, A549 cells were exposed to different concentrations of GEFITINIB (0, 2.5, 5, 12.5, and 25 μM) for 48 hours.
Table 1.
IC50 (µmol/l) of control and treatment group
| Groups | IC50 | 95% CI |
|---|---|---|
| NC group | 10.43 ±1.64 | 6.35-12.52 |
| 48-hour group | 4.70 ±0.78 | 2.76-6.64 |
| 72-hour group | 3.63 ±0.86 | 1.15-5.98 |
The IC50 of GEFITINIB was calculated based on cell viability and shown as mean ± SD. All experiments were performed in triplicate
Fig. 3.
Cell cycle distribution and cell apoptosis rate. A549 cells were treated with GEFITINIB, transfected with miR-7 mimic or control mimic for 48 and 72 hours or co-treated with miR-7 and GEFITINIB. Co-treatment of miR-7 and GEFITINIB induced G0/G1 cell cycle arrest (A) and enhanced cell apoptosis (B)
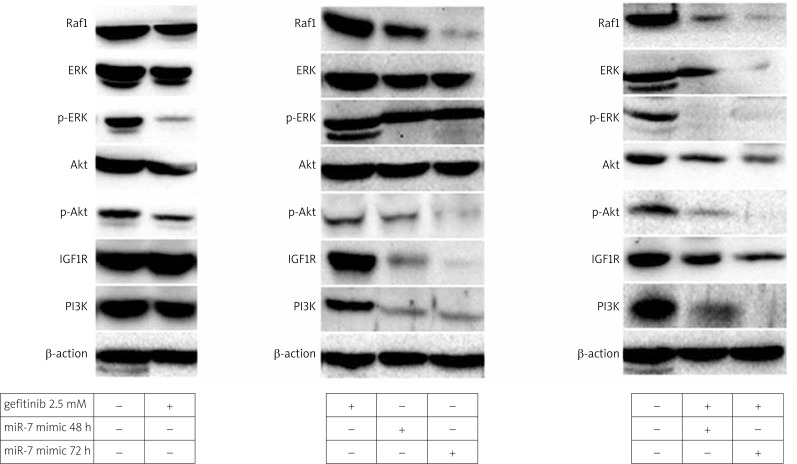
Fig. 4.
Effect of GEFITINIB, miR-7, or miR-7/ GEFITINIB combination on the activation of Akt or ERK in A549 cells. After transfection with miR-7 for 48 or 72 hours, A549 were exposed to GEFITINIB (2.5 μM) for 2 hours. Cell lysates were prepared and protein levels of Raf1, IGF1R, PI3K, total and phosphorylated (p) Akt, and ERK were then determined using western blotting
To investigate the mechanism by which miR-7 enhances GEFITINIB-induced cytotoxicity, we analysed basal expression levels and activation status of the IGF1R/PI3K and EGFR/Raf1 pathway components. We found that Ralf1 protein level and ERK phosphorylation were significantly decreased by GEFITINIB, Akt phosphorylation was decreased slightly by GEFITINIB, but total ERK and Akt levels remained unchanged (Fig. 4A). Since IGF1R/PI3K pathway is a major bypass pathway in the activation of Akt, we investigated the activation status of the IGF1R/PI3K pathway components. Levels of IGF1R and PI3K remained unchanged or were even increased after GEFITINIB treatment (Fig. 4A). After restoring miR-7 by transfection of the miR-7 mimics, IGF1R and PI3K were both decreased (Fig. 4B). Although the total Akt level remained constant, the level of p-Akt was reduced (Fig. 4B). In contrast, the level of p-ERK was not significantly altered after miR-7 mimic transfection (Fig. 4B, lane 3). We subsequently tested whether GEFITINIB in combination with miR-7 results in stronger inhibition of Akt and ERK phosphorylation. Compared to the control group, we observed that miR-7 and GEFITINIB co-treatment significantly decreased the phosphorylation levels of Akt and ERK. Additionally, treatment of GEFITINIB after cells were transfected with miR-7 for 72 hours decreased the levels of both p-Akt and p-ERK to an almost undetectable level (Fig. 4C). Together with the observed miR-7 and GEFITINIB effects on EGFR and IGF1R pathways, these results suggest that miR-7 enhances the cytotoxicity induced by GEFITINIB in NSCLC cells by facilitating GEFITINIB in blocking EGFR and its bypass signalling pathways.
Discussion
Abnormal expression of miRNAs often occurs in tumour generation [24]. We focused on miR-7 in this study because previous studies have indicated that miR-7 might be a potential tumour suppressor. MiR-7 is an ancient miRNA, and its mature sequence is conserved from Annelida to human [25]. Previous studies have shown that the Drosophila melanogaster miR-7 is found in several feedback loops that serve to buffer the shock of environmental changes and maintain the stability of the organism [26]. miR-7 expression pattern has revealed a possible link between miR-7 and several cancers of the nervous system, such as hypophyseal adenoma and central nerve carcinoma [27–31]. These studies indicated that miR-7 might be a keeper of the internal environment, and that abnormal expression of miR-7 destabilises the internal environment and eventually leads to tumorigenesis.
In our experiment, transfection efficiency reached 75% or above at either 48 or 72 hours after transfection. qRT-PCR results showed that miR-7 expression was upregulated after transfection, suggesting successful transfection. In order to investigate whether miR-7 can enhance GEFITINIB-induced cytotoxicity, we chose five different concentrations of GEFITINIB and two different miR-7 concentrations. At lower concentrations of GEFITINIB and miR-7 (for example: GEFITINIB at 2.5 µM and miR-7 at 25 nM), mir-7 enhanced GEFITINIB-induced cytotoxicity with a distinct difference between the GEFITINIB single agent group and the co-treatment group. GEFITINIB-induced cytotoxicity peaked at 25 µM, whereas mir-7 failed to further enhance GEFITINIB-induced cytotoxicity, and no significant difference was found between the 48- and the 72-hour miR-7 co-treatment groups. A similar study by Zhong et al. found that let-7a, has-miR-126, and has-miR-145 can enhance the cytotoxicity of GEFITINIB in NSCLC cells [32]. The difference between their studies and ours is that we chose two time points for miR-7 transfection and used mature miR-7, while they used miR-7 precursors. GEFITINIB and miR-7 both induced G0/G1 cell cycle arrest. However, the co-treatment group resulted in a stronger G0/G1 cell cycle arrest as compared to the single agent group. There was also no significant difference between the 48- and the 72-hour miR-7 co-treatment groups. On the other hand, the percentage of apoptotic cells in the co-treatment group increased two fold compared to that of the GEFITINIB only group. No significant difference was observed between the 48- and 72-hour miR-7 co-treatment groups. As such, our results suggested that miR-7 enhanced GEFITINIB-induced cytotoxicity at low concentrations of GEFITINIB.
We also investigated the mechanism by which miR-7 enhances the cytotoxicity induced by GEFITINIB. Based on the results of cell growth inhibition assay, we chose 2.5 µM as the experimental concentration of GEFITINIB for western blots. We found that levels of Raf1 and p-ERK were decreased by GEFITINIB treatment alone, indicating an interruption of the EGFR/Raf1/EKR pathway. However, the levels of IGF1R and PI3K were either not decreased or even slightly enhanced, suggesting that the IGF1R/PI3K/Akt pathway was not affected by GEFITINIB. The EGFR bypass pathway may be activated after treatment with anti-EGFR inhibitor. After the restoration of miR-7, total ERK and Akt remained unchanged, whereas levels of p-Akt, Raf1, IGF1R, and PI3K were all decreased. It is known that overexpression of miR-7 can interrupt both the EGFR and the IGF1R signalling pathways. Similarly to the results of a previous report demonstrating that miR-7 targets IGF1R in tongue squamous cell carcinoma cells [20], we found comparable changes in the expression of IGF1R and p-ERK. However, in contrast to the previous study, Raf1 expression decreased significantly in our study. The difference in the effect of miR-7 on EGFR signalling pathway is possibly due to the differences in cancer types used in these two studies. When cells were treated with both GEFITINIB and miR-7, expression of p-ERK and p-Akt were strongly inhibited. p-ERK and p-Akt are known to be closely related with cell proliferation and survival, so inhibition of p-ERK and p-Akt could be the reason why miR-7 enhances GEFITINIB-induced cytotoxicity.
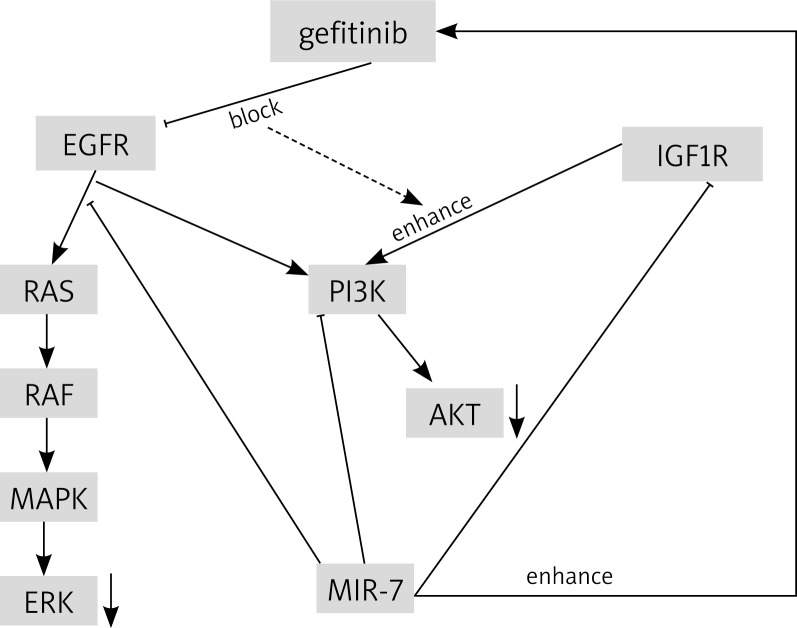
In summary, our results indicated that miR-7 enhanced the cytotoxicity induced by GEFITINIB, but the duration of miR-7 transfection was not critical. The underlying mechanism by which miR-7 enhanced GEFITINIB cytotoxicity might be the inhibition of EGFR/Raf1/ERK and IGF1R/PI3K/Akt signalling pathways by GEFITINIB and miR-7 co-treatment (Fig. 5). Future studies will determine the effects of miR-7 overexpression in overcoming GEFITINIB drug resistance in some NSCLC cells. Our study identified a miRNA that enhances GEFITINIB-induced cytotoxicity in NSCLC, and investigated its underlying mechanism, thus laying the foundation for a potential new approach for NSCLC targeted therapy.
Fig. 5.
Possible mechanism for the inhibition of EGFR/Raf1/ERK and IGF1R/PI3K/Akt signalling pathways by GEFITINIB and miR-7 co-treatment. GEFITINIB blocks EGFR signalling pathway, resulting in an enhanced IGF1R pathway. miR-7 enhances GEFITINIB cytotoxicity by suppressing the expression of signalling molecules in both EGFT and IGF1R signalling pathways
The authors declare no conflict of interest.
References
- 1.Jemal A, Tiwari RC, Murray T, et al. Cancer statistics, 2004. CA Cancer J Clin. 2004;54:8–29. doi: 10.3322/canjclin.54.1.8. [DOI] [PubMed] [Google Scholar]
- 2.Rusch V, Baselga J, Cordoncardo C, et al. Differential expression of the epidermal growth-factor receptor and its ligands in primary non-small cell lung cancers and adjacent benign lung. Cancer Res. 1993;53(10 Supp):2379–85. [PubMed] [Google Scholar]
- 3.Kim ES, Hirsh V, Mok T, et al. Gefitinib versus docetaxel in previously treated non-small-cell lung cancer (INTEREST): a randomised phase III trial. Lancet. 2008;372:1809–18. doi: 10.1016/S0140-6736(08)61758-4. [DOI] [PubMed] [Google Scholar]
- 4.Shepherd FA, Rodrigues Pereira J, Ciuleanu T, et al. National Cancer Institute of Canada Clinical Trials Group. Erlotinib in previously treated non-small-cell lung cancer. N Engl J Med. 2005;353:123–32. doi: 10.1056/NEJMoa050753. [DOI] [PubMed] [Google Scholar]
- 5.Jameson MJ, Beckler AD, Taniguchi LE, et al. Activation of the insulin-like growth factor-1 receptor induces resistance to epidermal growth factor receptor antagonism in head and neck squamous carcinoma cells. Mol Cancer Ther. 2011;10:2124–34. doi: 10.1158/1535-7163.MCT-11-0294. [DOI] [PMC free article] [PubMed] [Google Scholar]
- 6.Shaw PH, Maughan TS, Clarke AR. Dual inhibition of epidermal growth factor and insulin-like 1 growth factor receptors reduce intestinal adenoma burden in the Apc(min/ + ) mouse. Br J Cancer. 2011;105:649–57. doi: 10.1038/bjc.2011.291. [DOI] [PMC free article] [PubMed] [Google Scholar]
- 7.Yang L, Li J, Ran L, et al. Phosphorylated insulin-like growth factor 1 receptor is implicated in resistance to the cytostatic effect of gefitinib in colorectal cancer cells. J Gastrointest Surg. 2011;15:942–57. doi: 10.1007/s11605-011-1504-z. [DOI] [PubMed] [Google Scholar]
- 8.Bartel DP. MicroRNAs: Genomics, biogenesis, mechanism, and function. Cell. 2004;116:281–97. doi: 10.1016/s0092-8674(04)00045-5. [DOI] [PubMed] [Google Scholar]
- 9.Mattick JS, Makunin IV. Small regulatory RNAs in mammals. Hum Mol Genet. 2005;14(1):R121–32. doi: 10.1093/hmg/ddi101. [DOI] [PubMed] [Google Scholar]
- 10.Humphreys DT, Westman BJ, Martin DIK, Preiss T. MicroRNAs control translation initiation by inhibiting eukaryotic initiation factor 4E/cap and poly(A) tail function. Proc Natl Acad Sci U S A. 2005;102:16961–6. doi: 10.1073/pnas.0506482102. [DOI] [PMC free article] [PubMed] [Google Scholar]
- 11.Hummel R, Hussey DJ, Haier J. MicroRNAs: Predictors and modifiers of chemo- and radiotherapy in different tumour types. Eur J Cancer. 2010;46:298–311. doi: 10.1016/j.ejca.2009.10.027. [DOI] [PubMed] [Google Scholar]
- 12.Garzon R, Marcucci G, Croce CM. Targeting microRNAs in cancer: rationale, strategies and challenges. Nat Rev Drug Discov. 2010;9:775–89. doi: 10.1038/nrd3179. [DOI] [PMC free article] [PubMed] [Google Scholar]
- 13.Lin PY, Yu SL, Yang PC. MicroRNA in lung cancer. Br J Cancer. 2010;103:1144–8. doi: 10.1038/sj.bjc.6605901. [DOI] [PMC free article] [PubMed] [Google Scholar]
- 14.Shibuya H, Iinuma H, Shimada R, Horiuchi A, Watanabe T. Clinicopathological and Prognostic Value of MicroRNA-21 and MicroRNA-155 in Colorectal Cancer. Oncology. 2010;79:313–20. doi: 10.1159/000323283. [DOI] [PubMed] [Google Scholar]
- 15.Tili E, Michaille J-J, Wernicke D, et al. Mutator activity induced by microRNA-155 (miR-155) links inflammation and cancer. Proc Natl Acad Sci U S A. 2011;108:4908–13. doi: 10.1073/pnas.1101795108. [DOI] [PMC free article] [PubMed] [Google Scholar]
- 16.Yu CC, Chen YW, Chiou GY, et al. MicroRNA let-7a represses chemoresistance and tumourigenicity in head and neck cancer via stem-like properties ablation. Oral Oncol. 2011;47:202–10. doi: 10.1016/j.oraloncology.2010.12.001. [DOI] [PubMed] [Google Scholar]
- 17.Akao Y, Noguchi S, Iio A, Kojima K, Takagi T, Naoe T. Dysregulation of microRNA-34a expression causes drug-resistance to 5-FU in human colon cancer DLD-1 cells. Cancer Lett. 2011;300:197–204. doi: 10.1016/j.canlet.2010.10.006. [DOI] [PubMed] [Google Scholar]
- 18.Kefas B, Godlewski J, Comeau L, et al. microRNA-7 inhibits the epidermal growth factor receptor and the Akt pathway and is down-regulated in glioblastoma. Cancer Res. 2008;68:3566–72. doi: 10.1158/0008-5472.CAN-07-6639. [DOI] [PubMed] [Google Scholar]
- 19.Chen H, Shalom-Feuerstein R, Riley J, et al. miR-7 and miR-214 are specifically expressed during neuroblastoma differentiation, cortical development and embryonic stem cells differentiation, and control neurite outgrowth in vitro. Biochem Biophys Res Commun. 2010;394:921–7. doi: 10.1016/j.bbrc.2010.03.076. [DOI] [PubMed] [Google Scholar]
- 20.Jiang L, Liu X, Chen Z, Jin Y, Heidbreder CE, Kolokythas A, Wang A, Dai Y, Zhou X. MicroRNA-7 targets IGF1R (insulin-like growth factor 1 receptor) in tongue squamous cell carcinoma cells. Biochem J. 2010;432:199–205. doi: 10.1042/BJ20100859. [DOI] [PMC free article] [PubMed] [Google Scholar]
- 21.Saydam O, Senol O, Wuerdinger T, et al. miRNA-7 attenuation in Schwannoma tumors stimulates growth by upregulating three oncogenicsignaling pathways. Cancer Res. 2011;71:852–61. doi: 10.1158/0008-5472.CAN-10-1219. [DOI] [PMC free article] [PubMed] [Google Scholar]
- 22.Webster RJ, Giles KM, Price KJ, Zhang PM, Mattick JS, Leedman PJ. Regulation of epidermal growth factor receptor signaling in human cancer cells by microRNA-7. J Biol Chem. 2009;284:5731–41. doi: 10.1074/jbc.M804280200. [DOI] [PubMed] [Google Scholar]
- 23.Livak KJ, Schmittgen TD. Analysis of relative gene expression data using realtime quantitative PCR and the 2-ΔΔCt methods. Methods. 2001;25:402–8. doi: 10.1006/meth.2001.1262. [DOI] [PubMed] [Google Scholar]
- 24.Kumar MS, Lu J, Mercer KL, Golub TR, Jacks T. Impaired microRNA processing enhances cellular transformation and tumorigenesis. Nat Genet. 2007;39:673–7. doi: 10.1038/ng2003. [DOI] [PubMed] [Google Scholar]
- 25.Prochnik SE, Rokhsar DS, Aboobaker AA. Evidence for a microRNA expansion in the bilaterian ancestor. Dev Genes Evol. 2007;217:73–7. doi: 10.1007/s00427-006-0116-1. [DOI] [PubMed] [Google Scholar]
- 26.Li X, Cassidy JJ, Reinke CA, Fischboeck S, Carthew RW. A microRNA imparts robustness against environmental fluctuation during development. Cell. 2009;137:273–82. doi: 10.1016/j.cell.2009.01.058. [DOI] [PMC free article] [PubMed] [Google Scholar]
- 27.Sempere LF, Freemantle S, Pitha-Rowe I, Moss E, Dmitrovsky E, Ambros V. Expression profiling of mammalian microRNAs uncovers a subset of brain-expressed microRNAs with possible roles in murine and human neuronal differentiation. Genome Biol. 2004;5:R13. doi: 10.1186/gb-2004-5-3-r13. [DOI] [PMC free article] [PubMed] [Google Scholar]
- 28.Farh KK, Grimson A, Jan C, Lewis BP, Johnston WK, Lim LP, Burge CB, Bartel DP. The widespread impact of mammalian MicroRNAs on mRNA repression and evolution. Science. 2005;310:1817–21. doi: 10.1126/science.1121158. [DOI] [PubMed] [Google Scholar]
- 29.Landgraf P, Rusu M, Sheridan R, et al. A mammalian microRNA expression atlas based on small RNA library sequencing. Cell. 2007;129:1401–14. doi: 10.1016/j.cell.2007.04.040. [DOI] [PMC free article] [PubMed] [Google Scholar]
- 30.Bottoni A, Zatelli MC, Ferracin M, et al. Identification of differentially expressed microRNAs by microarray: A possible role for microRNA genes in pituitary adenomas. J Cell Physiol. 2007;210:370–7. doi: 10.1002/jcp.20832. [DOI] [PubMed] [Google Scholar]
- 31.Gaur A, Jewell DA, Liang Y, Ridzon D, Moore JH, Chen C, Ambros VR, Israel MA. Characterization of microRNA expression levels and their biological correlates in human cancer cell lines. Cancer Res. 2007;67:2456–68. doi: 10.1158/0008-5472.CAN-06-2698. [DOI] [PubMed] [Google Scholar]
- 32.Zhong M, Ma X, Sun C, Chen L. MicroRNAs reduce tumor growth and contribute to enhance cytotoxicity induced by gefitinib innon-small cell lung cancer. Chem Biol Interact. 2010;184:431–8. doi: 10.1016/j.cbi.2010.01.025. [DOI] [PubMed] [Google Scholar]


