Abstract
Point-of-care (POC) testing has become widely used in clinical analysis because of its speed and portability; however, POC tools, such as lateral flow assays, suffer from low specificity, unclear readouts, and susceptibility to environmental and user errors. Herein, we report an ELISA-based competitive volumetric bar-chart chip (CV-chip) that eliminates these limitations. The CV-chip displays the readout in the form of ink bar charts based on direct competition between gases generated by the sample and the internal control. By employing a “competition mode”, this platform decreases the potential influence of background resulting from environmental factors and provides visually clear positive or negative results without the requirement of calibration. In addition, the on-chip comparison enables the device to distinguish imperceptible differences (less than 1.3-fold) in human chorionic gonadotropin (hCG) concentrations that are near the cutoff value for pregnancy (~1.4 ng/mL). We also utilized the ELISA-based CV-chip to successfully detect biomarkers from cancer cells. As a proof-of-concept application in a clinical setting, the CV-chip was employed to evaluate the status of drugs of abuse in 18 patients. For six different drugs, zero false-positive and very few false-negative (<2%) results were reported in more than 100 tests. This new ELISA platform offers a clinical diagnostics tool that is portable and easy to use, and provides improved clarity and sensitivity due to the inclusion of a real-time internal control.
Clinical diagnostics requires an analysis technology that is fast, portable, accurate, and equipment-free,1–7 but the currently available point-of-care (POC) screening methods that fit these criteria (such as lateral flow strip assays) can suffer from ambiguous results,8,9 cross-reactivity,10,11 or poor detection limits, which increase false-positive and false-negative rates.12–15Although the detection limits of POC devices have been improved, many remaining problems limit their sensitivity and specificity.8,13,14,16 First, current POC platforms mostly perform device calibration, quality control, and sampling at different times;17–20 yet studies have shown that different environmental conditions (e.g., temperature, humidity, pH, and ionic strength) can alter the assay response,6,21,22 such as the binding affinity between an antibody and its antigen.23–25 Because it is nearly impossible to ensure that the tests are conducted under conditions identical to those of the calibration and quality control, detection accuracy decreases. Second, to enhance device portability and avoid external readout equipment, many platforms utilize a visible line8,9,26,27 or color28,29 to display results; however, sample concentrations that are close to the cutoff value may render the assay readout ambiguous,8 making differentiation between positive and negative results diffcult. These ambiguously faint lines or colors leave room for error in interpretation.8,9 Finally, these methods usually include parallel controls to ensure proper device performance,27,29,30 but these assays lack a means to reduce potential background influences, such as nonspecific binding.
We herein report a new ELISA platform, the competitive volumetric bar-chart chip (CV-chip), which generates definitive positive or negative results presented as visual ink bar-charts. The CV-chip overcomes the above-mentioned limitations of POC screening devices and greatly reduces false-positive and false-negative results via addition of an internal real-time control. This novel platform can significantly improve bedside analysis for disease-related biomarkers and substances of abuse in terms of accuracy and sensitivity. The CV-chip is based on our earlier volumetric bar-chart chip (V-Chip) technology.31,32 The original V-chip employs H2O2 to produce oxygen gas to displace the ink in one direction for biomarker detection. Similar to other ELISA platforms, this device still requires calibration before sampling, and the parallel control cannot decrease potential background influences efficiently. Thus, we improved the detection mechanism using a competition mode by adding a real-time internal control and changing the gas to nitrogen. The CV-chip performs the ELISA on the sample and control in the same channel, such that the nitrogen gas generated from each of the two groups is in direct competition. Clearly visualized positive or negative ink bars are generated based on the competition result. In the CV-chip, the concurrent sample and control reactions eliminate possible environmental differences, therefore improving the accuracy of the assay. Subsequently, no calibration is required for the assay. Results are presented directly as an ink bar in either direction on the device. Since the comparison is done intrinsically within the device, there is no potential for user error when comparing the sample to the control. Lastly, although background influences are a major problem of any assay, the CV-chip significantly reduces this influence due to the use of a competition mode. As a result, background influences are expected to alter the sample and control similarly, and therefore exert little effect on the competition result.
We confirmed the performance of the CV-chip with varying horseradish peroxidase (HRP) concentrations. We also detected various concentrations of the pregnancy biomarker human chorionic gonadotropin (hCG) using the device, demonstrating its capability to differentiate small differences (less than 1.3-fold) of hCG near the cutoff value for pregnancy (~1.4 ng/mL). Furthermore, biomarkers of the epithelial-to-mesenchymal transition (EMT) in cancer cells were measured and confirmed by immunofluorescence and Western blot assays. Finally, drugs of abuse in patient samples were tested on the platform and confirmed by LC-MS. In a screening of 18 patients for six different drugs, the CV-chip produced zero false-positive and <2% false-negative results in more than 100 tests.
EXPERIMENTAL SECTION
Materials and Chemicals
Glass slides (75 × 50 × 1 mm) were obtained from Corning, Inc. (Corning, NY). SPR 220-7 was purchased from MicroChem Corp (Newton, MA). MFCD26 was obtained from Rohm and Haas Electronic Materials (Marlborough, MA). Hydrogen peroxide solution (H2O2, 35 wt % in H2O), HRP, luminol, (3-glycidoxypropyl) trimethoxysilane (3-GPS), NH4F, HF, HNO3, toluene, ethanol, silicone oil, and the tested drugs were purchased from Sigma-Aldrich (St. Louis, MO). Tridecafluoro-1,1,2,2-tetrahydrooctyl-1-trichlorosilane was purchased from Pfaltz and Bauer (Waterbury, CT). PBS buffer (0.1 M, pH7.4) was obtained from Lonza (Allendale, NJ). Red ink and the commercial hCG kit were purchased from Fisher Scientific (Waltham, MA). Amorphous diamond-coated drill bits (0.031-in. cutter diameter) were purchased from Harvey Tool (Rowley, MA). The hCG and the antibodies for hCG and EMT biomarkers were purchased from Abcam (Cambridge, MA). All antidrug antibodies and drug derivative-HRP were purchased from Antibodies-Online (Atlanta, GA).
Device Operation
The device is composed of one top plate and one bottom plate. After the device was fabricated (see Supporting Information), 3 μL of silicone oil was added to the top device plate with the patterns facing up. Then, the top plate was assembled with the bottom plate. The silicone oil was distributed on the two plates by sliding the plates against each other repeatedly, effectively sealing the two glass slides together and preventing solution leakage. The two plates were then aligned to allow the relevant wells to partially overlap and form a continuous N-shaped fluidic path in the horizontal direction. To load a solution into the device, a 10-μL pipet tip containing the sample or reagent was inserted into the right inlet on the top plate. The solution was loaded into the wells via the pipet. To obtain the readout, the top plate was moved obliquely to make the wells connect in a Z-shape in the vertical direction. The readout is then obtained by reading the ink bar according to the ruler besides the channels at the determined time.
Test for Drugs of Abuse on the Device
The test for drugs of abuse is based on competitive ELISA principles. Briefly, following surface silane treatment (see Supporting Information), the wells were coated with 2 μL of capture antibody (~10 μg/mL). Then, a drug derivative-HRP solution (the concentration of the drug derivative was ~200 ng/mL, and the concentration of HRP was ~2000 ng/mL) was mixed at a 1:1 ratio with either the control (at the cutoff concentration for the drug of interest) or a test sample. Then, 2 μL of the mixture was added to each well of the top end (control) and bottom end (sample), respectively. After a washing step, the device was assembled and the reagents were loaded. Since the drug-derivative was conjugated with HRP, the bar chart advancement was obtained by sliding the CV-chip to allow the HRP probe to contact the luminol/H2O2. Assay readouts were recorded after a 15 min incubation at 37 °C.
RESULTS AND DISCUSSION
Working Principle
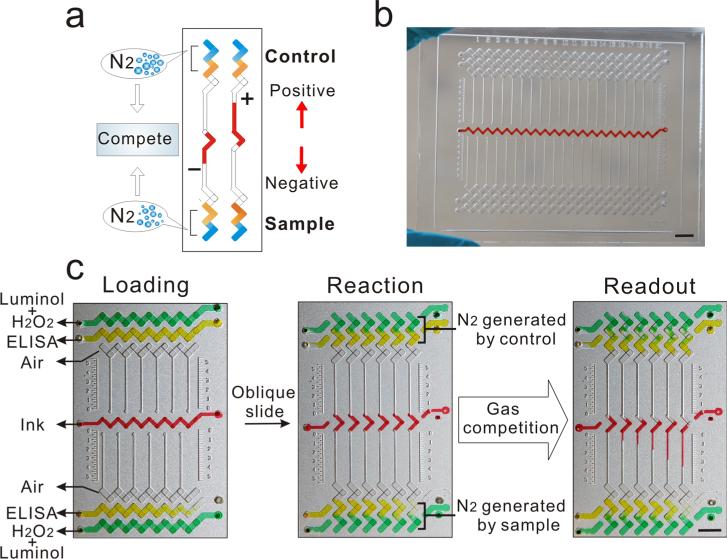
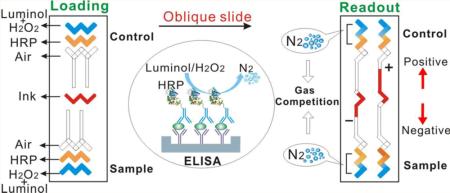
The CV-chip displays visual positive and negative results based on the direct competition of nitrogen gas generated by the sample and the internal control (Figure 1a). Nitrogen gas is produced by a chemiluminescent reaction between luminol and H2O2, using HRP as the catalyst (Supporting Information Figure S1).33,34 Here, we chose HRP as the probe because a multitude of HRP-conjugated antibodies and drug-derivatives are commercially available, eliminating the need for time-consuming conjugation and purification and enabling virtually limitless applicability for this assay. The handed 20-plex CV-chip is depicted in Figure 1b. The CV-chip has two loading ends: the top end for the control and the bottom end for the sample (Figure 1c). The readout is based on which end generates more nitrogen gas. In the loading phase, the three sets of horizontal lanes at the top and bottom of the device are repeating “N” shapes. Typically, the top- and bottom-most lanes are preloaded with a mixture of luminol and H2O2 (green dye as shown in Figure 1c). The second lanes in the top and bottom of the device are sample and control lanes, respectively, and these lanes contain the ELISA reaction (yellow dye as shown in Figure 1c). Conversely, the “ELISA lane” can also be filled directly with HRP solution for a nitrogen gas test. The third lanes remain empty to serve as air spacers and to avoid direct contact between the sample and the ink. The central horizontal lane in the middle of the chip is designated for loading the red ink. Obliquely sliding the top plate causes the horizontal fluid paths to reform into independent parallel vertical paths (Figure 1c). For each vertical unit, the wells are shaped like repeating ‘Z's, allowing the mixture of luminol and H2O2 to come into contact with the HRP probe to generate nitrogen gas. Subsequently, the ink is pushed into the top or bottom halves of the CV-chip based on the quantity of nitrogen gas produced at the two opposing ends. The ink then forms a bar in the upper channel, yielding a positive signal because of the generation of more gas in the sample lane. Conversely, the ink produces a bar in the bottom channel if the sample is negative, as the control lane produces more gas than the sample (Figure 1a). Various differences between samples and controls can generate ink bar charts of varying lengths (Figure 1c). Using standard photolithography and glass-etching methods (Supporting Information Figure S2), we fabricated three types of devices to measure 6, 10, or 20 targets simultaneously (Supporting Information Figures S3–S5).
Figure 1.
Principle of the CV-chip. (a) The CV-chip detection mechanism. (b) The 20-plex CV-chip. (c) Operation of the CV-chip. After loading reagents, an oblique slide will initiate the reaction and then generate the readout. Scale bar, 0.5 cm.
Evaluation of the CV-Chip
A series of tests were conducted to evaluate CV-chip performance. First, two HRP solutions within a typical concentration range (1 and 4.5 μM) were loaded at the two ends. As shown in Figure 2b, solutions with equal concentration difference at the two ends of each unit resulted in a uniform bar chart (dynamic advancement shown in Supporting Information Movie S1). To further test the CV-chip sensitivity, we loaded two additional pairs of HRP solutions at the two ends: 4 and 5 μM and 5 and 6 μM. The small differences between the samples (4 and 6 μM) and the control (5 μM) were distinguishable based on the movement of the dye (Supporting Information Figure S6), and this sensitivity should contribute to the ability of the CV-chip to distinguish between target concentrations similar to the cutoff and to reduce false-negative and false-positive results. Second, two pairs of HRP solutions at high (500 and 750 μM) and low (5 and 7.5 nM) concentrations ranges were used to test the dynamic range of the CV-chip. The results (Figure 2a, c) demonstrated that the device was able to assess the proper signal for samples with submillimole and nanomole concentration ranges. This advantage is meaningful as we then only need to modify the controls at the top end for the detection of multiple biomarkers with different concentration ranges.35 For currently available POC devices, however, several calibrations may be required for each target.29,36 Quantification plots shown in Figure 2e depict uniform advancement bars for the three pairs of HRP solutions tested in Figure 2a–c. Moreover, Figure 2f shows the dynamic curves obtained at temperatures of 25–42 °C for the pair of 5–7.5 nM HRP solutions. In this experiment, the observed ink bar movement was faster at the higher temperature, likely due to the facts that at the higher temperatures tested, HRP has a better enzyme catalytic effciency for the luminol-H2O2 reaction and the reagents diffuse more efficiently. The ink advancement was, however, only a little longer (less than 10%) at 42 °C than at 37 °C. Because high temperatures may influence the oil seal between the two glass slides, we performed all reaction incubations at 37 °C in subsequent experiments, including the hCG assay, cancer cell biomarker detection assay, and screening for drugs of abuse. Third, we loaded two pairs of HRP solutions with the same concentration at the two ends. The readouts obtained following a 30 min incubation (500 vs 500 μM; 5 vs 5 nM) revealed no ink advancement, verifying the reliability of the CV-chip (Supporting Information Figure S7). Fourth, we investigated the relationship between HRP concentration differences and ink bar advancement. A solution of 1 μM HRP was loaded at the bottom end of the CV-chip. To obtain the HRP concentration gradient at the top end of the CV-chip, green food dye was mixed with 6 μM HRP solution, and the mixture was loaded as shown in Supporting Information Movie S2 (the second layer). Then the relative gradient of HRP concentration was visualized based on the gradient of the dye intensity at each well (Figure 2d). The gradient differences of HRP concentrations at the two ends produced a gradient bar chart, which is shown in Figure 2d, and this bar chart was verified via the similar slopes of the two fitted linear curves, which are depicted in Figure 2g. These results are also in good agreement with the results of Supporting Information Figure S8 and Movie S3. In addition to the 6-plex CV-chip, we also evaluated the performance of the 10-plex CV-chip and 20-plex CV-chip for the generation of uniform and gradient bar charts; similar results were obtained with the additional CV-chips (Supporting Information Figures S9 and S10).
Figure 2.
Evaluation of the CV-chip. (a–c) Bar chart results from experiments with varying HRP concentrations at the two ends. The readout for (a) was based on HRP concentrations of 750 μM and 500 μM, and the data were recorded after 6 min at 25 °C. The readout for panel b was based on HRP concentrations of 4.5 and 1 μM, and data were recorded after 10 min at 25 °C. The readout for panel c was based on HRP concentrations of 7.5 and 5 nM, and data were recorded after 10 min at 37 °C. (d) Result based on a gradient from 6 to 1 μM HRP solutions at the two ends. Green food dye and 6 μM HRP were mixed together, and the mixture was injected to form the concentration gradient at the top end. The dotted rectangle box shows the green dye gradient after the injection. The reaction was read after 10 min at 25 °C. (e) The uniform advancement curve obtained from panels a–c. (f) The dynamic curves obtained at 25, 30, 37, and 42 °C with 7.5 and 5 nM HRP loaded at the two ends. Data are shown as mean of the distance in the six channels ± SD (g) The dye intensity at the center of each bottom well in the dotted rectangle box and the ink advancement (obtained from panel d) were plotted against the channel number. The two fitted lines show similar slopes (0.658 and 0.667). Scale bar: 0.5 cm for panels a–d.
Comparison of the Readouts from the CV-Chip and the Strip Assay
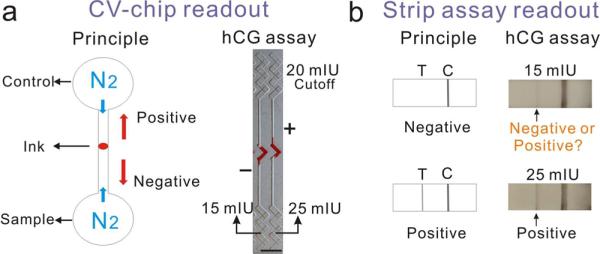
To illustrate the differences between our technology and previous methods, we first compared the readout performance of the CV-chip and the strip assay for the detection of the hCG pregnancy hormone (see Supporting Information for experimental details). Whereas the CV-chip produces a positive or a negative result based on the competition of the control and sample (Figure 3a), the readout for the strip assay is based on antibody binding, and the positive or negative result is dependent on antigen binding and the subsequent appearance of a test line (Figure 3b). The cutoff value for hCG detection in urine in early pregnancy is 20 mIU/mL. Various hCG samples (spiked in male urine) with concentrations ranging from 5 to 50 mIU/mL were tested three times on the CV-chip and six times with commercial hCG kits. For all three CV-chip tests, the control was set as the cutoff value for pregnancy (20 mIU/mL). Samples with concentrations of lower than 15 mIU/mL and higher than 25 mIU/mL displayed clear negative and positive ink bars, respectively (Figure 3a and Supporting Information Figure S11). The varying lengths of the ink bars also demonstrated the semiquantitative ability of the CV-chip for biomarker testing. Using the commercial kit, all six tests performed on samples with concentrations higher than 25 mIU/mL were definitively positive. Four of the six samples containing 15 mIU/mL hCG yielded negative results; however, the other two samples with 15 mIU/mL hCG showed a very weak test line, which should be absent at this concentration, resulting in an obscure readout (Figure 3b) consistent with previous reports.8 These results demonstrated that the strip assay may provide false positives when the concentration of the test sample approaches the cutoff value. In contrast, the CV-chip distinguished even small differences (less than 1.3-fold) in concentration near the cutoff value of 20 mIU/mL (~1.4 ng/mL), demonstrating high sensitivity and specificity.
Figure 3.
Comparison of hCG detection using the CV-chip and the strip assay. (a, b) Readouts of the CV-chip (a) and the strip assay (b). The CV-chip yielded a clear positive or negative bar chart readout based on the nitrogen gas competition between the control (20 mIU/ mL) and the sample (15 mIU/mL or 25 mIU/mL). The strip assay showed a positive test line for the 25 mIU/mL sample and a very weak test line that should not be present for the 15 mIU/mL sample, although this concentration is below the detection limit.
EMT Biomarker Detection Using the CV-Chip
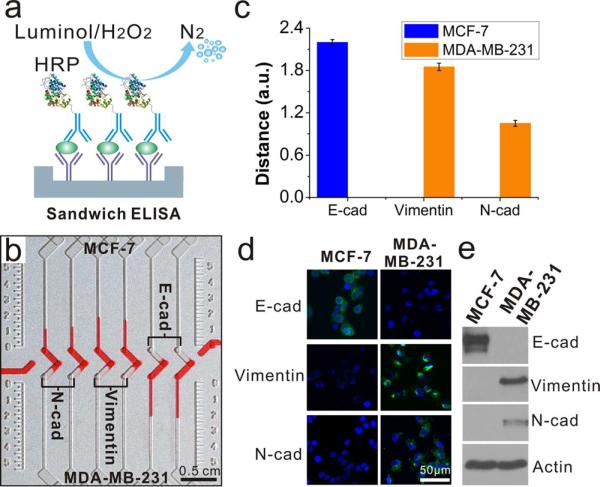
After the hCG assay, we utilized the ELISA-based CV-chip to compare the expression of EMT biomarkers (E-cadherin, N-cadherin, and vimentin)37,38 in MCF-7 and MDA-MB-231 breast cancer cells. Previous studies reported that MCF-7 cells express E-cadherin, while MDA-MB-231 cells express N-cadherin and vimentin.38,39 The three EMT biomarkers were examined in the two types of cancer cells using sandwich ELISA (Figure 4a). MCF-7 and MDA-MB-231 cell lysates with the same cell concentration were loaded at the top end and bottom end, respectively (see Supporting Information for details). MDAMB-231 cells expressed higher levels of N-cadherin and vimentin compared to MCF-7 cells (Figure 4b). Conversely, MCF-7 cells expressed higher levels of E-cadherin than MDA-MB-231 cells (Figure 4b, c). The profile of biomarker expression in the two cell lines was validated using immunofluorescence imaging and Western blot analysis (Figure 4d, e), which confirmed results from the CV-chip and data from previous reports.39 These results demonstrate that this POC ELISA platform can assess protein expression in different cell types rapidly and accurately. This technology has potential applicability for evaluating cancer-related biomarker changes35 or protein expression changes that result from gene mutation or gene transfection.40
Figure 4.
Multiplexed detection of EMT biomarkers from lysates of two types of cancer cells. (a) Mechanism of sandwich ELISA used for biomarker detection. (b) Detection results of three representative cancer biomarkers (N-cadherin, vimentin, and E-cadherin) on the CV-chip. The readout was conducted after a 15 min incubation at 37 °C. (c) Quantitative difference in the expression of the three biomarkers expressed in the two cell lines. Error bars were obtained from the results of three parallel experiments on the CV-chip. (d) Fluorescence images of MCF-7 and MDA-MB-231 cells stained with DAPI for nuclei (blue) and FITC for the biomarkers (green). (e) Results of Western blot for the three EMT biomarkers. Actin was loaded as a control. Scale bar: 0.5 cm for (b) and 50 μm for (d).
Drug Abuse Screening Using the CV-Chip
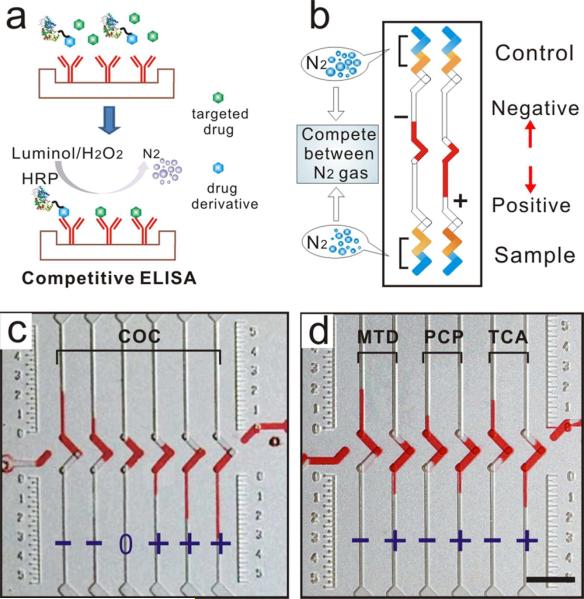
Substance abuse can result in many health problems41 and is one of the leading causes of preventable mortality.42 Previous POC assays for detection of substance abuse agents suffered from potential false positives and false negatives.13,14 Here, we used the CV-chip to perform screening for drug abuse substances. Before screening patient samples for evidence of substance abuse, we evaluated the ability of the CV-chip technology to analysis samples spiked with drugs using competitive ELISA assays43 (Figure 5a). The competitive ELISA technology, but not the competitive V-chip assay, has been used for decades to detect small molecule analytes. In contrast to the sandwich ELISA used for the biomarker test, the competitive ELISA system will generate a downward bar on the CV-chip in the case of a sample positive for substances of abuse because as the drug concentration increases, the concentration of drug-conjugated HRP decreases and less nitrogen gas is generated (Figure 5b).
Figure 5.
Drugs of abuse test on the CV-chip. (a) Scheme of competitive ELISA. (b) A schematic representation of negative and positive readouts using the CV-chip for a drug-screening test. (c) Detection of COC (0, 50, 300, 500, 1000, and 3000 ng/mL, from left to right) on the CV-chip. Cutoff value is 300 ng/mL. (d) Detection of three drugs on the CV-chip. The cutoff concentrations of each drug (MTD, 300 ng/mL; PCP, 25 ng/mL; and TCA, 1000 ng/mL) were loaded at the top end of the chip. The test samples (MTD, 50 and 500 ng/mL; PCP, 10 and 100 ng/mL; and TCA, 300 and 3000 ng/mL) were loaded at the bottom end of the chip. Scale bar, 0.5 cm for (c) and (d).
Accordingly, a negative sample will generate an upward bar. To evaluate the potential of the CV-chip in such a system, we tested a series of samples spiked with cocaine (COC). All abbreviations and cutoff values for all drugs that were tested in these experiments are defined in Supporting Information Table S1. The CV-chip technology not only identified samples as positive or negative but also indicated drug concentration differences among the positive or negative samples (Figure 5c). Subsequently, urine samples were spiked with three additional drugs (MTD, PCP, TCA), and the samples were tested using one chip. The upward and downward ink bars (Figure 5d) that represent the negative (marked “–”) and positive (marked “+”) samples, respectively, correspond with the assay mechanism depicted in Figure 5b, suggesting that the CV-chip can be successfully used for simultaneous multiplexed detection of different drugs with various cutoff values.
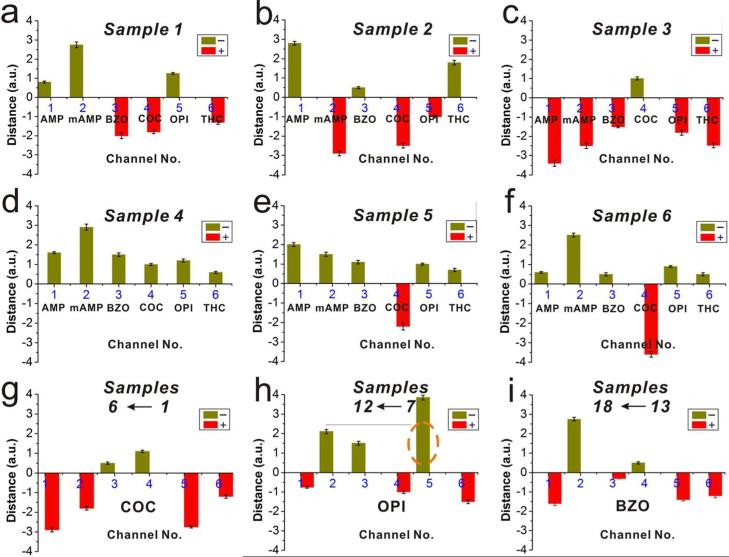
Finally, to evaluate the new technology in the clinical setting, we employed the CV-chip to test urine samples from drug abuse patients. For the control, the top end of the chip was loaded with urine samples collected from drug-free individuals and spiked with the cutoff concentrations of each drug. Patient urine samples were then loaded into the bottom end of the chip. First, we evaluated six patient samples in a multiplex assay to detect six drugs (AMP, mAMP, COC, BZO, OPI, and THC) per chip (resultant data quantification shown in Figure 6a–f). We then tested three groups of samples for three drugs (Figure 6g, COC, samples 1–6; Figure 6h, OPI, samples 7–12; and Figure 6i, BZO, samples 13–18). Furthermore, we tested the samples 7–12 for AMP, mAMP, BZO, and COC and samples 13–18 for AMP, mAMP, OPI, and COC. All patient samples were tested three times. The bar-chart results for the tested patient samples are shown in Supporting Information Figures S12 and S13. The CV-chip data were further confirmed by LC-MS analyses (Supporting Information Table S2). Finally, the results from the CV-chip were found to be consistent with the LC-MS data (Supporting Information Table S3). The only two exceptions were the OPI test for sample 8 (Figure 6h) and sample 16 (Supporting Information Figure S13g) as the CV-chip test produced a negative result, while the LC-MS yielded a positive result for these two samples. A very likely reason for the two false-negative results stems from the fact that the immunoassay-based CV-chip test does not cross-react with the specific drug types detected on LC-MS. In summary, the CV-chip data resulted in less than 2% (2 of a total of 17 × 6=102 tests) false-negative and 0% false-positive results, which is comparable to (if not better than) that obtained in commercial drug test kits.12,13 Detailed results are summarized in Supporting Information Table S4. Because of the real-time competition between the sample and the control, the accuracy of these tests for drugs of abuse using the CV-chip was much improved, without a concurrent increase in cost or complicity.
Figure 6.
Screening of samples from drug abuse patients. (a–f) Patient samples 1–6 were tested for six classes of abused drugs. (g–i) Test results for (g) COC for samples 1–6, (h) OPI for samples 7–12, and (i) BZO for samples 13–18. The orange dotted ellipse in panel h indicates a false-negative result. Data are shown as the mean of three independent measurements ± SD. Readout was recorded after a 15 min incubation at 37 °C. The corresponding bar-chart results for panels a–i are shown in Supporting Information Figure S12a–i.
CONCLUSIONS
In summary, a simple POC device was developed by embedding a real-time internal control into a volumetric bar-chart chip. This CV-chip possesses four advantageous characteristics as a result of inclusion of the internal control design: (1) accurate results with few false-negative or false-positive results; (2) ability to distinguish between samples with small concentration differences; (3) a wide dynamic range with the ability to test multiple samples with different cutoff values; and (4) qualitative and semiquantitative results in the same panel without any calibrations. This technology combines the advantages of low cost, portability, high sensitivity, and a clearly visualized readout. Therefore, the CV-chip has great potential in the advancement of clinical analysis and personalized diagnostics.
Supplementary Material
ACKNOWLEDGMENTS
We are grateful for the funding support from NIH/NIDA 1R01DA035868-01, the Cancer Prevention and Research Institute of Texas (CPRIT-R1007), and the Golfers Against Cancer Foundation.
Footnotes
Supporting Information
Detailed experimental procedures and supplementary data. This material is available free of charge via the Internet at http://pubs.acs.org.
The authors declare no competing financial interest.
REFERENCES
- 1.Fan ZH, Tan WH. Nanomedicine. 2013;8:1731–1733. doi: 10.2217/nnm.13.163. [DOI] [PMC free article] [PubMed] [Google Scholar]
- 2.Giljohann DA, Mirkin CA. Nature. 2009;462:461–464. doi: 10.1038/nature08605. [DOI] [PMC free article] [PubMed] [Google Scholar]
- 3.Xiang Y, Lu Y. Nat. Chem. 2011;3:697–703. doi: 10.1038/nchem.1092. [DOI] [PMC free article] [PubMed] [Google Scholar]
- 4.Myers FB, Henrikson RH, Bone J, Lee LP. PLoS One. 2013;8:1–6. doi: 10.1371/journal.pone.0070266. [DOI] [PMC free article] [PubMed] [Google Scholar]
- 5.Sackmann EK, Fulton AL, Beebe DJ. Nature. 2014;507:181–189. doi: 10.1038/nature13118. [DOI] [PubMed] [Google Scholar]
- 6.Chan CP, Mak WC, Cheung KY, Sin KK, Yu CM, Rainer TH, Renneberg R. Annu. Rev. Anal. Chem. 2013;6:191–211. doi: 10.1146/annurev-anchem-062012-092641. [DOI] [PubMed] [Google Scholar]
- 7.Song YJ, Huang YY, Liu XW, Zhang XJ, Ferrari M, Qin LD. Trends. Biotechnol. 2014;32:132–139. doi: 10.1016/j.tibtech.2014.01.003. [DOI] [PMC free article] [PubMed] [Google Scholar]
- 8.de Moraes GS, Cristovam RD, Savaris RF. Rev. Assoc. Med. Bras. 2011;57:516–522. doi: 10.1590/s0104-42302011000500008. [DOI] [PubMed] [Google Scholar]
- 9.Posthuma-Trumpie GA, Korf J, van Amerongen A. Anal. Bioanal. Chem. 2009;393:569–582. doi: 10.1007/s00216-008-2287-2. [DOI] [PubMed] [Google Scholar]
- 10.Gronowski AM, Cervinski M, Stenman UH, Woodworth A, Ashby L, Scott MG. Clin. Chem. 2009;55:1389–1394. doi: 10.1373/clinchem.2008.121210. [DOI] [PubMed] [Google Scholar]
- 11.Nerenz RD, Gronowski AM. Clin. Chem. 2013;59:1672–1674. doi: 10.1373/clinchem.2013.212795. [DOI] [PubMed] [Google Scholar]
- 12.Lin CN, Nelson GJ, McMillin GA. J. Anal. Toxicol. 2013;37:30–36. doi: 10.1093/jat/bks087. [DOI] [PubMed] [Google Scholar]
- 13.Attema-de Jonge ME, Peeters SY, Franssen EJ. J. Emerg. Med. 2012;42:682–691. doi: 10.1016/j.jemermed.2011.01.031. [DOI] [PubMed] [Google Scholar]
- 14.Reisfield GM, Goldberger BA, Bertholf RL. Bioanalysis. 2009;1:937–952. doi: 10.4155/bio.09.81. [DOI] [PubMed] [Google Scholar]
- 15.Taylor EH, Oertli EH, Wolfgang JW, Mueller EJ. Anal. Toxicol. 1999;23:119–124. doi: 10.1093/jat/23.2.119. [DOI] [PubMed] [Google Scholar]
- 16.Pike J, Godbert S, Johnson S. Expert Opin. Med. Diagn. 2013;7:435–441. doi: 10.1517/17530059.2013.830103. [DOI] [PubMed] [Google Scholar]
- 17.Zhang B, Kumar RB, Dai H, Feldman BJ. Nat. Med. 2014:948–953. doi: 10.1038/nm.3619. [DOI] [PMC free article] [PubMed] [Google Scholar]
- 18.Hsu CK, Huang HY, Chen WR, Nishie W, Ujiie H, Natsuga K, Fan ST, Wang HK, Lee JY, Tsai WL, Shimizu H, Cheng CM. Anal. Chem. 2014;86:4605–4610. doi: 10.1021/ac500835k. [DOI] [PubMed] [Google Scholar]
- 19.Murdock RC, Shen L, Griffin DK, Kelley-Loughnane N, Papautsky I, Hagen JA. Anal. Chem. 2013;85:11634–11642. doi: 10.1021/ac403040a. [DOI] [PubMed] [Google Scholar]
- 20.Cheng CM, Martinez AW, Gong J, Mace CR, Phillips ST, Carrilho E, Mirica KA, Whitesides GM. Angew. Chem. Int. Ed. 2010;49:4771–4774. doi: 10.1002/anie.201001005. [DOI] [PubMed] [Google Scholar]
- 21.Louie RF, Ferguson WJ, Sumner SL, Yu JN, Curtis CM, Kost GJ. Disaster Med. Public Health Prep. 2012;6:232–240. doi: 10.1001/dmp.2012.42. [DOI] [PubMed] [Google Scholar]
- 22.Ginsberg BH. J. Diabetes Sci. Technol. 2009;3:903–913. doi: 10.1177/193229680900300438. [DOI] [PMC free article] [PubMed] [Google Scholar]
- 23.Bachand M, Bachand GD. Nanoscale. 2012;4:3706–3710. doi: 10.1039/c2nr30570d. [DOI] [PubMed] [Google Scholar]
- 24.Reverberi R, Reverberi L. Blood Transfus. 2007;5:227–240. doi: 10.2450/2007.0047-07. [DOI] [PMC free article] [PubMed] [Google Scholar]
- 25.Barnes AE. J. Immunol. 1966;96:854–864. [PubMed] [Google Scholar]
- 26.Teerinen T, Lappalainen T, Erho T. Anal. Bioanal. Chem. 2014:5955–5965. doi: 10.1007/s00216-014-8001-7. [DOI] [PubMed] [Google Scholar]
- 27.Parolo C, de la Escosura-Muniz A, Merkoci A. Biosens. Bioelectron. 2013;40:412–416. doi: 10.1016/j.bios.2012.06.049. [DOI] [PubMed] [Google Scholar]
- 28.Yildiz UH, Alagappan P, Liedberg B. Anal. Chem. 2013;85:820–824. doi: 10.1021/ac3034008. [DOI] [PubMed] [Google Scholar]
- 29.Pollock NR, Rolland JP, Kumar S, Beattie PD, Jain S, Noubary F, Wong VL, Pohlmann RA, Ryan US, Whitesides GM. Sci. Transl. Med. 2012;4:152ra1291–1152ra1291. doi: 10.1126/scitranslmed.3003981. [DOI] [PMC free article] [PubMed] [Google Scholar]
- 30.Fu E, Liang T, Houghtaling J, Ramachandran S, Ramsey SA, Lutz B, Yager P. Anal. Chem. 2011;83:7941–7946. doi: 10.1021/ac201950g. [DOI] [PMC free article] [PubMed] [Google Scholar]
- 31.Song Y, Zhang Y, Bernard PE, Reuben JM, Ueno NT, Arlinghaus RB, Zu Y, Qin L. Nat. Commun. 2012;3:1283–1291. doi: 10.1038/ncomms2292. [DOI] [PMC free article] [PubMed] [Google Scholar]
- 32.Song YJ, Wang YC, Qin LD. J. Am. Chem. Soc. 2013;135:16785–16788. doi: 10.1021/ja4085397. [DOI] [PMC free article] [PubMed] [Google Scholar]
- 33.Barni F, Lewis SW, Berti A, Miskelly GM, Lago G. Talanta. 2007;72:896–913. doi: 10.1016/j.talanta.2006.12.045. [DOI] [PubMed] [Google Scholar]
- 34.Kamidate T, Kida N, Ichihashi H, Watanabe H. Anal. Sci. 1995;11:169–173. [Google Scholar]
- 35.Mor G, Visintin I, Lai Y, Zhao H, Schwartz P, Rutherford T, Yue L, Bray-Ward P, Ward DC. Proc. Natl. Acad. Sci. U.S.A. 2005;102:7677–7682. doi: 10.1073/pnas.0502178102. [DOI] [PMC free article] [PubMed] [Google Scholar]
- 36.Wang J, Ahmad H, Ma C, Shi Q, Vermesh O, Vermesh U, Heath J. Lab Chip. 2010;10:3157–3162. doi: 10.1039/c0lc00132e. [DOI] [PMC free article] [PubMed] [Google Scholar]
- 37.Hanahan D, Weinberg RA. Cell. 2011;144:646–674. doi: 10.1016/j.cell.2011.02.013. [DOI] [PubMed] [Google Scholar]
- 38.Lundgren K, Nordenskjold B, Landberg G. Br. J. Cancer. 2009;101:1769–1781. doi: 10.1038/sj.bjc.6605369. [DOI] [PMC free article] [PubMed] [Google Scholar]
- 39.Taube JH, Herschkowitz JI, Komurov K, Zhou AY, Gupta S, Yang J, Hartwell K, Onder TT, Gupta PB, Evans KW, Hollier BG, Ram PT, Lander ES, Rosen JM, Weinberg RA, Mani SA. Proc. Natl. Acad. Sci. U.S.A. 2010;107:15449–15454. doi: 10.1073/pnas.1004900107. [DOI] [PMC free article] [PubMed] [Google Scholar]
- 40.Fan F, Samuel S, Evans KW, Lu J, Xia L, Zhou Y, Sceusi E, Tozzi F, Ye XC, Mani SA, Ellis LM. Cancer Med. 2012;1:5–16. doi: 10.1002/cam4.4. [DOI] [PMC free article] [PubMed] [Google Scholar]
- 41.Pascoli V, Turiault M, Luscher C. Nature. 2012;481:71–U76. doi: 10.1038/nature10709. [DOI] [PubMed] [Google Scholar]
- 42.Volkow ND, Li TK. Nat. Rev. Neurosci. 2004;5:963–970. doi: 10.1038/nrn1539. [DOI] [PubMed] [Google Scholar]
- 43.Mobini Far HR, Torabi F, Danielsson B, Khayyami MJ. Anal. Toxicol. 2005;29:790–793. doi: 10.1093/jat/29.8.790. [DOI] [PubMed] [Google Scholar]
Associated Data
This section collects any data citations, data availability statements, or supplementary materials included in this article.


