

Abstract
Dietary methionine restriction (MR) produces a coordinated series of biochemical and physiological responses that improve biomarkers of metabolic health, increase energy expenditure, limit fat accretion, and improve overall insulin sensitivity. Inguinal white adipose tissue (IWAT) is a primary target and site of action where the diet initiates transcriptional programs linked to enhancing both synthesis and oxidation of lipid. Using a combination of ex vivo approaches to assess dietary effects on cell morphology and function, we report that dietary MR produced a 4-fold increase in multilocular, UCP1-expressing cells within this depot in conjunction with significant increases in mitochondrial content, size, and cristae density. Dietary MR increased expression of multiple enzymes within the citric acid cycle, as well as respiratory complexes I, II and III. The physiological significance of these responses, evaluated in isolated mitochondria by high resolution respirometry, was a significant increase in respiratory capacity measured using multiple substrates. The morphological, transcriptional, and biochemical remodeling of IWAT mitochondria enhances the synthetic and oxidative capacity of this tissue, and collectively underlie its expanded role as a significant contributor to the overall increase in metabolic flexibility and uncoupled respiration produced by the diet.
Introduction
The initial studies reporting the beneficial effects of dietary methionine restriction (MR) showed that it increased mean and maximal lifespan to the same extent as 40% calorie restriction (1-3). However, an important distinction between these dietary approaches is that dietary MR does not require restriction of food intake. Quite the contrary, animals on the MR diet develop hyperphagia but paradoxically, gain significantly less weight than animals on the control diet (1). Careful pair-feeding studies showed that dietary MR increased the energy costs of maintaining body weight and decreased the accumulation of fat (4); prima facie evidence that dietary MR impacts energy balance by increasing total energy expenditure (EE). Not surprisingly, measurement of EE using indirect calorimetry established that the increase in EE fully compensated for the diet-induced increase in energy intake (5,6). This increase in EE has the effect of increasing the proportion of total intake devoted to maintenance of existing tissue, leaving less available to support growth. Dietary MR increases EE in both young growing animals and when the diet is introduced after attainment of physical maturity. In practice, the net effect of MR on energy balance in both experimental contexts is to limit accumulation of adipose tissue (5,6).
Several lines of evidence indicate that adipose tissue is far more than a passive participant in the physiological effects of dietary MR on metabolic status of the animal. First, the exaggerated increase in night-time EE and core body temperature in MR rats, coupled with increased expression of UCP1 in both BAT and WAT, is consistent with a state of uncoupled respiration in adipose tissue (5). Second, analysis of systems biology changes in tissues from methionine-restricted animals make a compelling case that adipose tissue, particularly IWAT, is a key transcriptional target of dietary MR (7,8). Third, in vivo and ex vivo analysis of tissues from methionine-restricted animals show that the capacity of IWAT to synthesize and oxidize lipid is significantly enhanced (5,9,10). Fourth, in vivo measurements of metabolic flexibility and insulin sensitivity show that the MR-induced enhancement of insulin-dependent glucose uptake and utilization support a diet-induced enhancement of de novo lipogenesis in adipose tissue (5,9-11). Fifth, loss of function studies establish that UCP1 is essential for MR-induced increases in EE but not insulin sensitivity (12). Collectively, these findings make a compelling case that the transcriptional and functional remodeling of IWAT by dietary MR is an important component of the overall mechanism through which EE and insulin sensitivity are affected by the diet. Using a combination of ex vivo approaches to assess the effects of dietary MR on IWAT, we show that the remodeling of this tissue involves targeted effects on mitochondrial ultrastructure and function that result in enhancement of the tissue's overall respiratory and synthetic capacity, creating the conditions for operation of futile cycles within the inguinal adipocytes.
Experimental Procedures
Animal Care
All animal experiments were performed with the approval of the PBRC Institutional Animal Care and Use Committee based on the recommendations of the Animal Welfare Act, National Research Council and the Public Health Service Policy on humane care and use of laboratory animals. Wild-type male C57BL/6J mice were obtained from Jackson Laboratories (Bar Harbor, ME) at 6 wks of age and randomly assigned to receive diets formulated by Dyets (Bethlehem, PA) to contain 0.86% methionine (control diet) or 0.17% methionine (MR diet) as described previously (5). The pelleted diets and water were provided ad libitum for 8-9 wks and the mice were housed at 22–23°C on a 12 h light cycle from 7 AM to 7 PM. In all experimental cohorts except the one providing tissues for transmission electron microscopic (TEM) analysis, the animals were euthanized and their organs/tissues harvested and processed for ex vivo analysis or flash-frozen in liquid nitrogen for subsequent processing.
Reagents
The reagents were obtained from the following sources. All enzymes used in this work were purchased from Sigma-Aldrich (St. Louis, MO) with the exception of malic enzyme (Alfa Aesar, Ward Hill, MA) and collagenase I (Worthington Biochemical Corporation, Lakewood, NJ). Paraformaldehyde for tissue perfusion was purchased from Acros Organics (Morris Plains, NJ). Reagents used in preparation of tissue samples for electron microscopy were procured from Electron Microscopy Sciences (Hatfield, PA). All other substrates and reagents were obtained from Sigma-Aldrich (St. Louis, MO).
Transmission Electron Microscopic Analysis
Animals designated to provide tissues for TEM were perfused with a fixative solution comprised of 2% glutaraldehyde and 1% paraformaldehyde in phosphate buffered saline (PBS). Following the perfusion and tissue fixation, the tissues were harvested and stored in the fixative solution at 4°C. The tissues were then cut into cubical pieces and washed in buffer containing 0.1M cacodylate and 0.05M sucrose, followed by fixation with 1% osmium tetraoxide. After a brief wash, the blocks were stained with 1% uranyl acetate and subjected to dehydration using an ethanol gradient. The tissue blocks were then embedded in resin, dried and sectioned to a thickness of 70 nm using a Leica EM UC7 microtome. The sections were stained with lead citrate and viewed using a JEM 1400 TEM (JEOL, Tokyo, Japan). The resulting twenty two TEM images were used to measure mitochondrial cross-sectional area and cristae density using Image J software (NIH) by an operator blinded to the identity of the tissue samples. The software was calibrated using the reference scale provided within the TEM image. Mitochondria were identified by their double membrane structure and cristae, and mitochondrial number was obtained by counting mitochondria within randomly selected squares within the image grid for each of the images for each dietary group.
Histology
Animals were perfused with a 10% formalin solution after which tissues were harvested and stored in the perfusion medium. IWAT samples were subsequently processed and embedded in paraffin, sectioned to 5μm thickness and subjected to immuno-histochemical staining. The prepared sections were dewaxed prior to heat induced antigen retrieval (Na Citrate, pH 6.0 for 20 min at 100C) and avidin/biotin blocking. After a 1 hr block with 5% normal goat serum the slides were incubated with a 1:100 dilution of anti-UCP1 (Sigma-Aldrich, U6382) overnight at 4C. The slides were then washed in TBST, incubated with biotinylated goat anti-rabbit IgG (Vector Laboratories, BA-1000, 1:200) for one hour, washed again in TBST, and then incubated with a 1:300 dilution of streptavidin-Cy3 (Jackson ImmunoResearch, West Grove, PA) for one hour. After washing in TBST, the sections were incubated with a 20 ug/ml solution of WGA-Oregon Green (Life Technologies, Grand Island, NY) and Hoechst for 15 minutes prior to a final wash before mounting. The prepared slides were imaged using a Leica DM6000 microscope and analyzed using CellProfiler software (http://www.cellprofiler.org/citations.shtml) as described earlier (13). Briefly, a pipeline was generated that allowed for manual ROI selection of stained tissue followed by initial cell identification using the WGA membrane stain. Classification as UCP1 positive or negative was then determined based on the presence or absence of red (UCP) staining within identified cells.
QRT-PCR and Western Blotting
Quantitative real-time PCR analyses was used to measure mRNA concentration of genes of interest from individual tissue samples as described previously (14). Briefly, 10 ng of cDNA, reverse-transcribed from total RNA, was used in QRT-PCR reactions in the presence of SYBR fluorescent dye (Takara, Japan) on an Applied Biosystems 7900 (Applied Biosystems/Life Technologies, Grand Island, NY). Relative content of mRNA in each sample was normalized to cyclophilin mRNA in that sample. Analysis of the ratio of mitochondrial to genomic DNA was carried out using genomic DNA isolated from each sample as previously described (15). The primers used for QRT-PCR are listed in table 1. Tissue extracts were prepared for Western blotting as previously described (11). Antibodies used for Western blotting included a peptide affinity-purified antibody raised against amino acids 145-159 of mouse UCP1 (16), the Mitoprofile Total OxPhos antibody cocktail from MitoSciences (Eugene, OR), and anti-β actin (Sigma).
Table 1. Primers for QRT-PCR analysis of mitochondrial and nuclear encoded genes1.
| Gene | Abbr. | Forward | Reverse |
|---|---|---|---|
| Uncoupling protein 1 | ucp1 | gat cca agg tga agg cca gg | gtt gac agg ctt tct gtg gtg g |
| Complex I | ndufb8 | ctc aga act cag gat gaa ctg g | cac aaa gcc gaa gag atg ttt ac |
| Complex II | sdhd | ggt ggg cag aat gtc ttc taa | tca cga atg gtc gaa cct aac |
| Complex III | uqcrfs1 | cag tcg aag tgt ccc agt taa g | cac aac caa gat gag tac aga ca |
| Complex IV | coxI | tga ggt gta cat cct gat cct | atg ccc atg tag ccg aaa g |
| Complex V | atp5a | cct atc ctg gtg atg tgt tct ac | act ggt aag gca gtc aaa gag |
| Cytochrome c | cycs | cac gct tta ccc ttc gtt ct | act cat ttc cct gcc att ctc |
| Electrotransfering Flavoprotein b | etfb | gg caa gca ggc tat tga tga | tca cct gag agg cga atg ta |
| Glycerol kinase | gk | gca cta gaa gct gtt tgt ttc c | gct ggt cat tcc tcc atc tac |
| Glycerol-3-phosphate dehydrogenase 1 (c) | gpd1 | cct act gct gac ctt tct tct c | gcc ctg agg acg ata aac tat aa |
| Glycerol-3-phosphate dehydrogenase 2 (m) | gpd2 | gac cgt agt tgt gga gga ttg | gca gct acg aga tcc act att t |
| Voltage dependent anion channel | vdac | cgg aat agc agc caa gta tca | ctg agt gta ccc taa gcc aat c |
| Citrate synthase | cs | cga gac tac atc tgg aac aca c | caa act ctc gct gac agg aat a |
| Aconitase 2 | aco2 | gtt gga cct cac cca aag at | ggt ccg tgg tat tcc aca ata g |
| Isocitrate dehydrogenase 3 | idh3 | cac tac cct cag atc acc ttt g | aga gat tag gca tca cca tga c |
| α-ketoglutarate dehydrogenase | ogdh | ggc atc gta tat gag acc ttc c | gtc tgt ggt gaa gcc aat ct |
| Succinyl CoA ligase | sucgl1 | gca acg gct tct gtc atc ta | ctg cgg aat acc ttc cgt aat |
| Fumarase | fh | gat gct ctg gtt gag ctt agt | aga acc cag gaa gcg aat atc |
| Malate dehydrogenase 2 | mdh2 | ggt gtg tac aa ccc taa caa ga | gag ctg gat cca aac cct tta |
| Malic enzyme 3 (m) | me3 | gga gac gca gtg aga gta aac | gtg aag gat ggg aag gag aat c |
| Complex I (mtDNA) | nd1 | ccc att cgc gtt att ctt | aag ttg atc gta acg gaa gc |
| Lipoprotein lipase (nucDNA) | lpl | gat gga cgg taa gag tga | atc caa ggg tag cag aca ggt |
The symbols (m) and (c) denotes̶ mitochondrial and cytosolic isoforms respectively. The primers for nd1 and lpl are genomic primers designed to assess mitochondrial DNA (mtDNA) and nuclear DNA (nucDNA) respectively.
2,3,5-triphenyltetrazolium chloride (TTC) Reduction Assay
Electron transport activity in adipose tissue explants was examined by measuring the reduction of TTC as previously described (17). Briefly, the fat pads from IWAT and epididymal WAT (EWAT) were minced in PBS, rinsed and incubated in PBS containing 1%TTC for 15 min at 37°C. After the incubation, the reduced TTC was extracted from the minced tissue with isopropanol and quantified by spectrophotometry using standards.
High-Resolution Respirometry
Respirometry was performed on mitochondria isolated from IWAT adipocytes, liver and skeletal muscle. Adipocytes were liberated from IWATs pooled from 2 – 4 mice per trial and homogenized to obtain intact mitochondria. Briefly, the fresh harvested IWATs were rinsed in PBS, cut into small 1 mm pieces and incubated with collagenase in the Krebs-Henseleit buffer (110mM NaCl, 5mM KCl, 4mM MgSO4·7H2O, 1.5mM NaH2PO4, 5mM glucose, 2% BSA, pH 7.4) with constant shaking at 37°C. After the digestion process, the liberated adipocytes were filtered using a nylon mesh with a pore size of about 250μm to remove undigested adipose tissue and then washed free of the collagenase by low speed centrifugation.
Mitochondrial Isolation
Mitochondria were isolated from adipocytes using the procedure of Martin and Denton (18). IWAT adipocytes were gently homogenized in 0.5M sucrose, 20mM Tris-HCL, 2 mM EGTA and 2% fatty acid free BSA (pH 7.4) on ice using a glass Dounce homogenizer. The homogenate was centrifuged at 3000 × g for 1 min at 4°C to remove intact adipocytes, nuclei and cellular debris. The infranatant was then centrifuged at 20,000 × g for 3 min, 4°C to sediment mitochondria. The mitochondrial pellet was re-suspended in the homogenization medium and re-centrifuged at 20,000 × g for 3 min, 4°C. The final pellet was re-suspended in the homogenization medium with 0.1% fatty acid free BSA. Mitochondrial protein content was measured using the Lowry method. Mitochondria from liver and skeletal muscle were isolated as described by Frezza et al. (19).
Respirometry
Mitochondrial flexibility and function were measured using an Oroboros Instruments (Innsbruck, Austria) high resolution respirometer. The chamber contained 2 ml of the respiration medium (110 mM sucrose, 20 mM HEPES, 10 mM KH2PO4, 20 mM taurine, 60 mM K-lactobionate, 3 mM MgCl2, 0.5 mM EGTA, 0.1% BSA (fatty acid free), pH 7.2) at 37°C. A typical series of measurements employed a single or set of substrates to initiate the electron flow, for instance pyruvate (5 mM) and malate (2 mM) to energize complex I. Addition of substrate(s) to mitochondria in the absence of ADP induced a small increase in oxygen consumption, which was termed leak respiration or state 2 respiration. The ‘leak’ rate of the mitochondria was determined to be equivalent to the oxygen consumption after addition of oligomycin to inhibit complex V, ATP synthase. A further increase in respiration was obtained by adding ADP (1 mM). This is termed Oxphos respiration, or state 3 respiration, which reports the maximum coupled oxygen consumption possible for the mitochondria with the given substrate. The full capacity of the electron transport system (ETS), termed Uncoupled respiration, was measured by titration with FCCP (carbonylcyanide p-trifluoromethoxyphenylhydrazone) in 0.5μM increments. ETS capacity reports the maximum uncoupled respiration of the mitochondria. Antimycin A was used to inhibit respiratory activity to determine and correct for non-mitochondrial oxygen consumption. Mitochondrial flexibility was assessed using additional substrates. For example, Complex II was energized using succinate (10 mM) and Rotenone (0.1μM), palmitoyl carnitine (2mM) was employed to measure electron input via β–oxidation, and finally glycerol-3-phosphate (10mM) was used to measure electron flux through the mitochondrial glycerol-3-phosphate dehydrogenase-mediated electron transport pathway. Cytochrome c (10 μM) was routinely added to the respiring mitochondria in the chamber to test the integrity of the outer mitochondrial membrane and thus ensure the quality of the mitochondrial preparation. Addition of cytochrome c always resulted in less than 10% stimulation of oxygen consumption.
Enzyme Activity Assays
All enzyme activities were measured at 37°C according to methods described previously (20-23). In brief, citrate synthase activity was measured by following the formation of 5-thio-2-nitrobenzoate at 412 nm in a reaction mixture containing 100 mM Tris-HCL (pH 8.0), 100 μM 5,5′-dithiobis(2-nitrobenzoic acid), DTNB, 50 μM acetyl CoA, 0.1% SDS, and 250 μM oxaloacetate after addition of 50 μg mitochondrial protein. Aconitase activity was measured by monitoring the increase in absorbance of NADPH at 340 nm in a reaction mixture containing 50 mM Tris-HCL (pH 7.4), 30 mM sodium citrate, 0.5 mM MnCl2, 0.2 mM NADP+, and isocitrate dehydrogenase 2 U/ml after addition of 50 μg mitochondrial protein. Isocitrate dehydrogenase activity was measured by following the increase in NADPH absorbance at 340 nm in a reaction mixture composed of 50 mM Tris HCL (pH 7.4), 0.44 mM isocitrate, 1 mM NADP, and 0.6 mM MnCl2 after addition of 50 μg of mitochondrial protein. α-ketoglutarate dehydrogenase activity was measured by monitoring the increase in NADH absorbance at 340nm in a mixture containing 50 mM HEPES (pH 7.4), 0.1% triton X-100, 0.5 mg/ml BSA, 0.2 mM TPP (thiamine pyrophosphate), 2 mM NAD+, 1 mM MgCl2, 0.3 mM DTT (dithiothreitol), 5 mM α-ketoglutarate, 2.6 mM cysteine, and 0.1 mM CoA after addition of 25 μg mitochondrial protein. Succinyl CoA ligase (synthetase) activity was measured by following the decrease in NADH absorbance at 340 nm in a reaction mixture containing 50 mM Tris-HCL (pH 7.4), 10 mM MgCl2, 0.1 mM Coenzyme A, 2 mM phosphoenol pyruvate, 0.1 mM guanosine triphosphate, 0.2 mM NADH, 50 mM succinate, 0.8 U pyruvate kinase, and 0.8 U lactate dehydrogenase after addition of 50 μg mitochondrial protein. Succinate dehydrogenase activity was measured by following the decrease in absorbance at 600 nm in a reaction mixture composed of 100 mM KH2PO4 (pH 7.6), 4 mM sodium azide, 1mM EDTA, 72μM (dichlorophenolindophenol) DCPIP, and 40mM succinate after addition of 30 μg of mitochondrial protein. Fumarate hydratase (fumarase) activity was measured by following the increase in NADPH at 340 nm in a reaction mixture containing 50 mM HEPES (pH 7.6), 4 mM MgCl2, 0.4 mM NADP+, malic enzyme (0.2U), and 10 mM fumarate after addition of 50 μg of mitochondrial protein. Malate dehydrogenase activity was measured by following the decrease in absorbance of NADH at 340 nm in a mixture containing 50 mM Tris-HCL (pH 7.4), 0.3 mM oxaloacetate, and 0.2 mM NADH after addition of 10 μg mitochondrial protein. Malic enzyme activity was measured by following the increase in absorbance of NADPH at 340 nm in a reaction mixture containing 50 mM Tris-HCL (pH 7.4), 10 mM malate, 5 mM Fumarate, 0.3 mM NADP+, 5 mM MnCl2, 5 mM MgCl2, and 1 mM DTT after addition of 50 μg mitochondrial protein.
Statistical analysis
Students t tests were used to compare mRNA levels of individual genes, protein levels from Western blots, imaging measures of mitochondrial or adipocyte remodeling, and enzyme activities. Protection against type I errors was set at 5% (α=0.05).
Results
Effects of dietary MR on remodeling of inguinal WAT and expression of UCP1
To assess the extent of remodeling of IWAT by dietary MR, dual label immunohistochemistry was used to measure changes in the number of cells expressing UCP1 within the entire inguinal depot. This was accomplished by staining cell membranes with wheat germ agglutinin (WGA, green) and mitochondrial UCP1 (red) in replicate sections of the depot. Figures 1A and 1B show the staining of entire IWAT sections from representative mice in each group, along with insets showing areas of higher magnification within each pad. The respective images illustrate the heterogeneity of staining for UCP1 between groups, although close inspection reveals that the morphology of UCP1 expressing cells from each group is comparable (Figs. 1A and 1B). To compare the extent of UCP1 induction between treatment groups, an unbiased imaging algorithm was used that counted the total number of adipocytes within each section and the total number of cells also expressing UCP1 within the same section. The median number of cells expressing UCP1 in the MR group sections was >40% while only 10% of cells in the Control group sections expressed UCP1 (Fig. 1C). Real time PCR and Western blotting of whole cell extracts for UCP1 showed that UCP1 mRNA and protein expression were ∼3.5-fold higher in IWAT from MR compared to Control mice (Fig. 1D). Further analysis using a cell-sizing algorithm revealed that dietary MR increased the number of smaller adipocytes (size<800μm2) while decreasing the overall mean adipocyte size within the pad (unpublished data). While smaller adipocytes also appear in IWAT from control fed animals, their appearance in MR-fed animals coincides with areas where increased numbers of beige/brite cells were detected. Thus, the diet-induced increase in number of smaller adipocytes coincides with the significant increase in UCP1-expressing adipocytes within the depot. Collectively, these data show that the increase in total UCP1 expression induced by MR can be explained by a 4-fold expansion in the number of adipocytes within the IWAT depot expressing UCP1.
Figure 1. Effect of dietary MR on morphology and UCP1 expression in inguinal WAT.
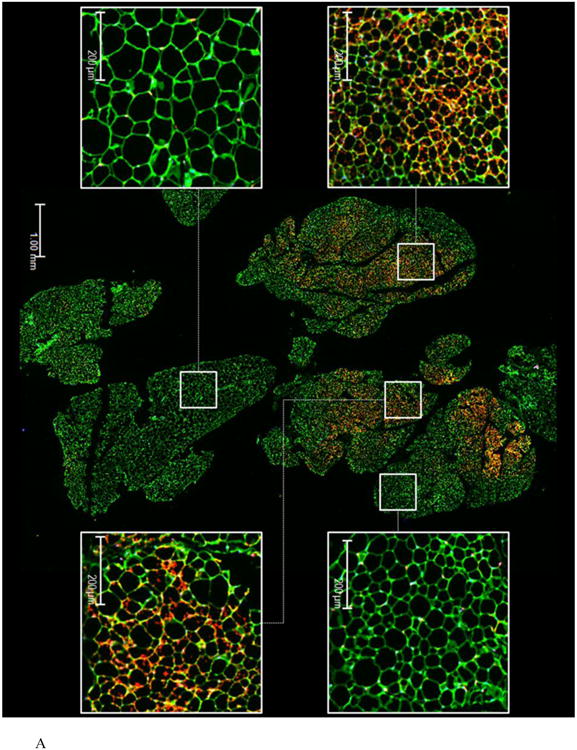
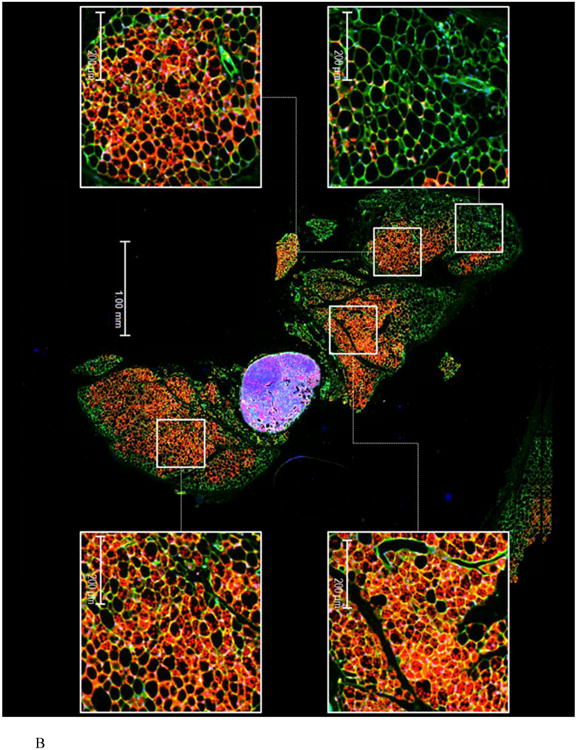
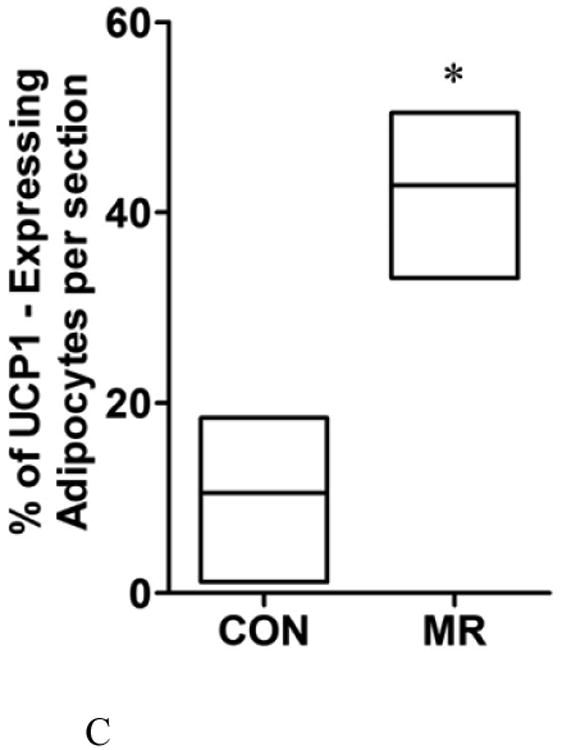
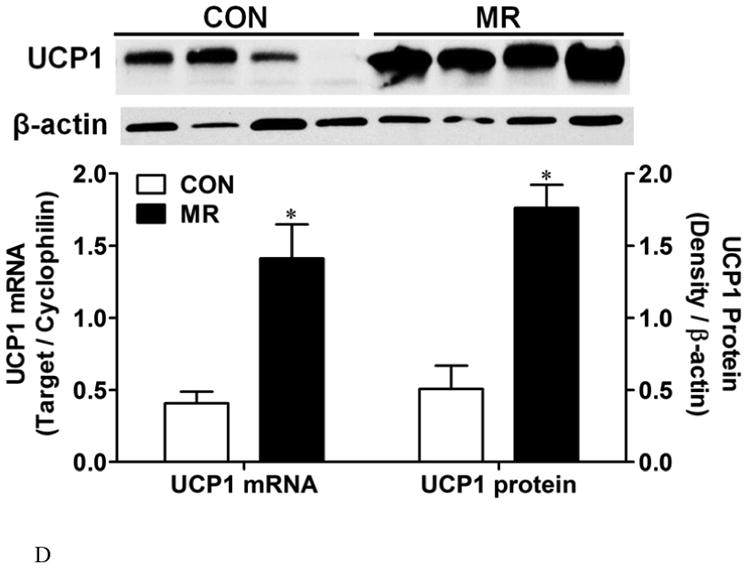
IWAT sections from Control (1A) or MR mice (1B) were stained for UCP1 (red), wheat germ agglutinin (green) for cell membranes and Hoechst (blue) for nuclear staining. The inset images show various regions within the section at 20 × magnification for greater detail. The percentage of the total cells in each section expressing UCP1 was determined in replicate sections (n=4) from each treatment group using Cell Prolifer Software as described in the Methods. The percentage of UCP1-expressing cells in each group is presented in Fig. 1C as a floating bar plot, illustrating the minimums and maximums for each group. Diet-induced differences are denoted with an asterisk (P<0.05). Expression of UCP1 mRNA (n=8) and protein (N=4) in IWAT from each treatment group was measured by quantitative real time PCR and Western blotting as described in the Methods, and means ± SEM differing at P<0.05 are denoted with an asterisk (Fig. 1D).
Effects of dietary MR on mitochondrial density and morphology
To evaluate the effects of dietary MR on the amount of mitochondrial DNA/cell, the ratio of mitochondrial DNA to genomic DNA was measured by quantitative RT-PCR as described previously (15). Despite an increase in multilocular adipocytes and the associated changes in cell morphology within the IWAT depot (Fig. 1), the ratio of mitochondrial DNA/cell was unaffected by dietary MR (Fig. 2A). The mitochondrial DNA/cell ratio was also unchanged by MR in liver, BAT, and skeletal muscle (Fig. 2A).
Figure 2. Effect of dietary MR on mitochondrial morphology in inguinal WAT.
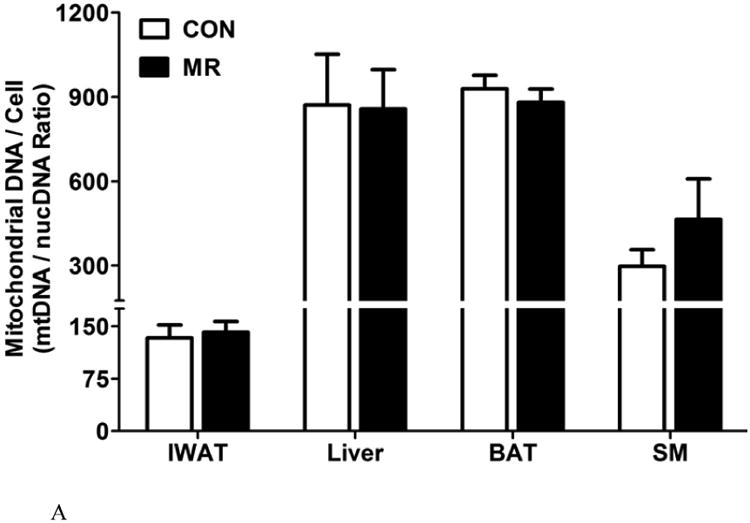
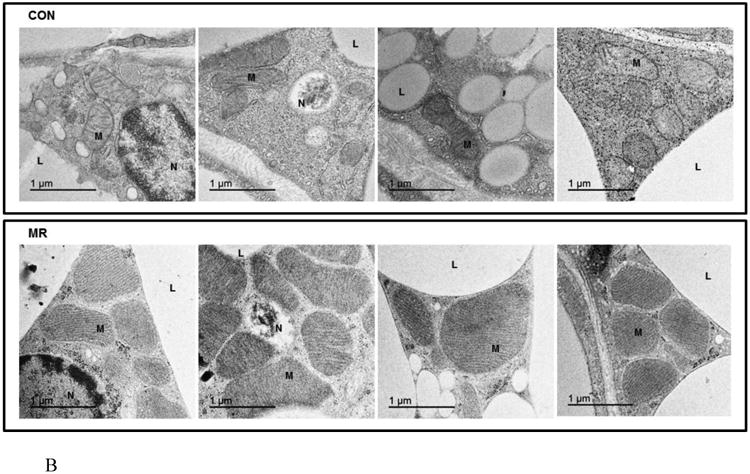
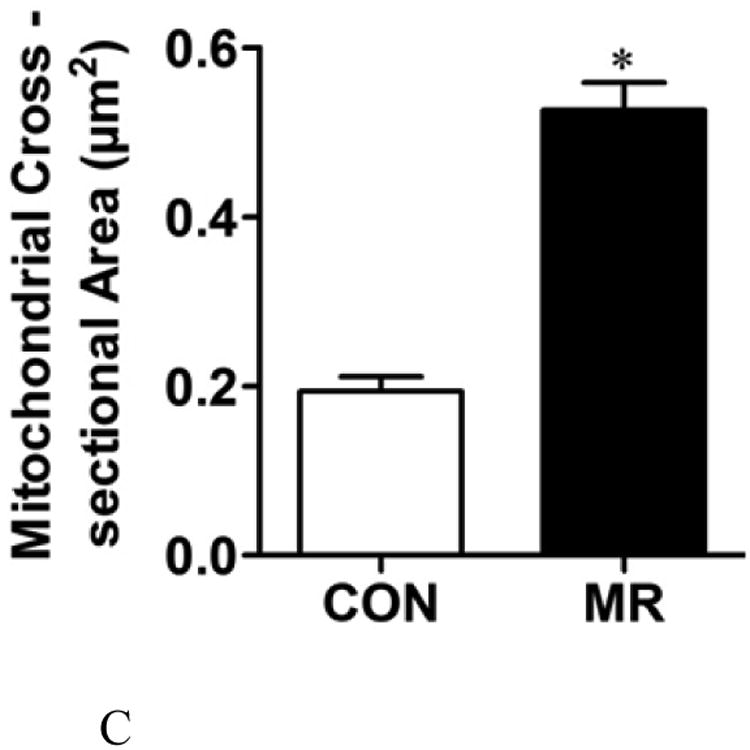
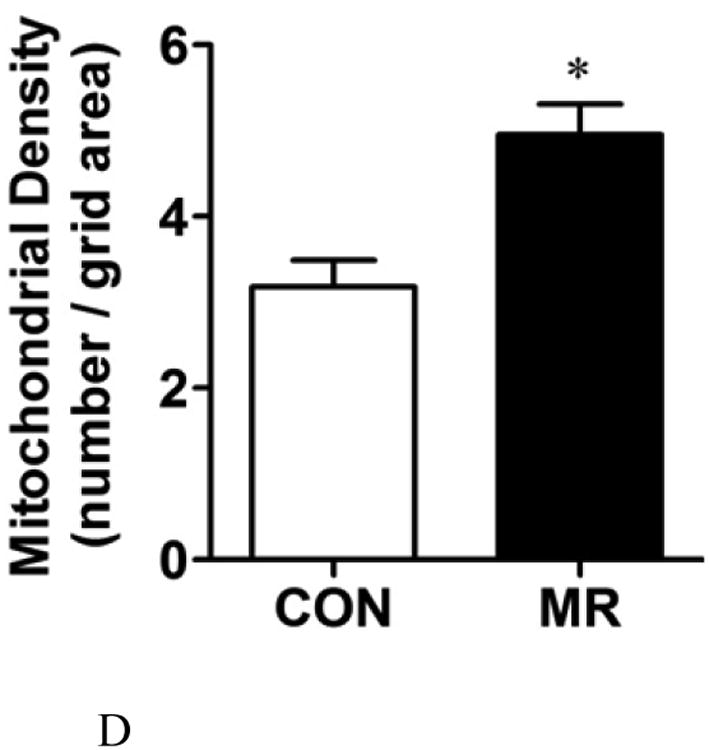
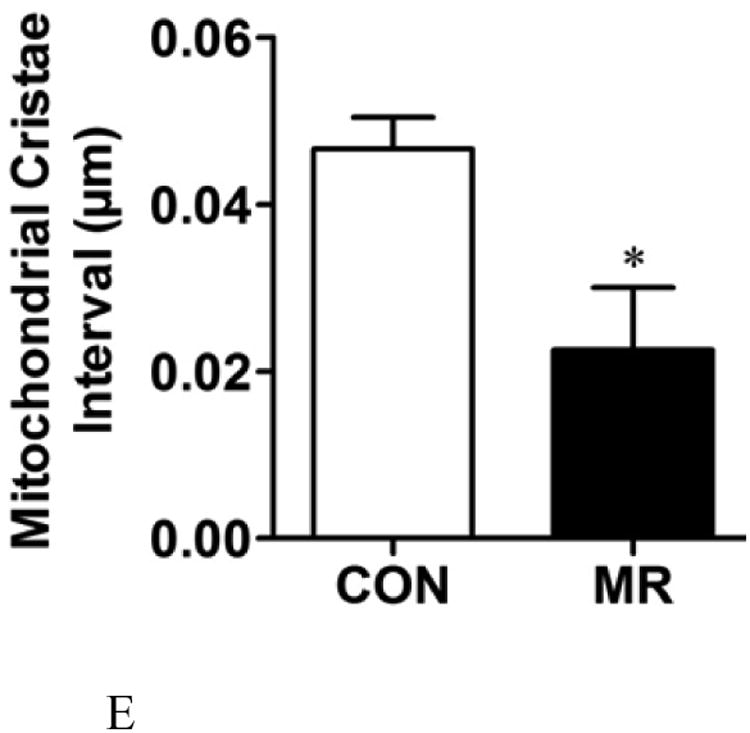
The ratio of mitochondrial to genomic DNA was measured by quantitative real time PCR in IWAT, liver, BAT, and skeletal muscle (SM) as described in the Methods. Means ± SEM were calculated from 8 replicates per group (Fig. 2A). Replicate sections of electron micrographs from 4 mice per group were analyzed by blinded operators to assess the impact of MR on mitochondrial ultrastructure in IWAT. Fig. 2B shows representative IWAT sections from Control (top panel) and MR mice (bottom panel) and are annotated as follows: L, lipid droplet; N, nucleus; M, mitochondria. Using Image J software, the mitochondrial cross-sectional area (Fig. 2C), mitochondrial number (Fig. 2D), and cristae interval, a measure of cristae density (Fig. 2E) were computed for each section and compared by Students t. Data are presented as mean ± SEM and diet-induced differences are denoted with an asterisk (P<0.05).
To explore the apparent dichotomy between the effects of diet on UCP1 expression and the predicted increase in mitochondrial numbers per cell, mitochondrial architecture was examined using transmission electron microscopy (TEM) coupled with image analysis using Image J software (Fig. 2B). Analysis of mitochondria within adipocytes from multiple IWAT sections for mitochondrial size, number, and cristae density revealed that dietary MR increased the cross sectional area of mitochondria by 2.5-fold (Fig. 2C), mitochondrial number by 1.7-fold (Fig. 2D), and decreased cristae interval by ∼2-fold (Fig. 2E). Fig. 2B shows that the mitochondria in IWAT of MR mice were significantly enlarged (P<0.05), while the interval (separating distance) between the cristae in individual mitochondria was 50% less than the distance in IWAT mitochondria from control mice (Fig. 2E). The smaller interval indicates a closer stacking of the cristae and therefore a greater cristae density in IWAT mitochondria from the MR group. The cristae make up a portion of the inner mitochondrial membrane surface to which the respiratory proteins are localized. The mitochondrial number, quantified by counting of individual mitochondria within image grids was significantly higher in the MR mice (Fig. 2B and 2D). It is unclear why the imaging- and PCR-based approaches led to different conclusions on mitochondrial density, but it should be noted that adipocytes represent only ∼50% of the cells present within the IWAT depot. Therefore, the PCR-based method would not have distinguished between cell types in its measurement of mitochondrial DNA. However, the increased mitochondrial size, content and cristae density assessed by imaging represents a direct and selective measurement of these variables only within adipocytes. The results of these measurements are fully consistent with the observed increases in UCP1 and multi-locular adipocytes in IWAT of the MR group.
Effect of dietary MR on the expression of cytosolic and mitochondrial respiratory proteins
Consistent with the increase in inner mitochondrial membrane surface produced by MR (Fig. 2E), expression of the mRNAs encoding respiratory Complexes I –V were all increased by MR in IWAT (Fig. 3A). The largest change was a 2.8-fold increase in complex IV/cytochrome c oxidase (COX) mRNA, although cytochrome c, which is crucial for electron transport and respiratory activity, was also up-regulated by 1.9-fold (Fig. 3A). Additional electron transfer pathways were surveyed, including the glycero-phosphate shuttle, consisting of cytosolic and mitochondrial glycerol-3-phosphate dehydrogenases (gpd1, cytosolic; gpd2, mitochondrial). They catalyze the interconversion of dihydroxy-acetone phosphate and glycerol-3-phosphate, coupling to NADH oxidation in the cytosol and FAD reduction in the mitochondria. Dietary MR significantly increased mRNA expression of both the cytosolic and mitochondrial components of this shuttle, along with cytosolic glycerol kinase (gk), which phosphorylates glycerol released from triglyceride breakdown after lipolysis, providing glycerol-3-phosphate for re-esterification (Fig. 3A). ETF dehydrogenase (etf), a mitochondrial flavoprotein localized to the inner mitochondrial membrane, was significantly increased by dietary MR (P<0.05) whereas the outer mitochondrial membrane voltage-gated anion channel, vdac, did not differ in IWAT from mice on the two diets (Fig. 3A). Considered together, the TEM analysis showed that the primary impact of dietary MR on mitochondrial ultrastructure was an increase in the inner mitochondrial membrane surface area, where essentially all of the upregulated genes involved in respiration are localized. Of particular note was that several genes involved in futile cycling of glycerol, both in the triglyceride/fatty acid cycle (gk) and the glycero-phosphate cycle (gpd1,gpd2) were all up regulated by dietary MR. Lastly, in sharp contrast to IWAT, expression of respiratory genes in the liver were unaffected by dietary MR (Fig. 3B), highlighting the tissue specific nature of the changes induced in IWAT by the MR diet.
Figure 3. Effect of dietary MR on mRNA and protein expression of selected mitochondrial genes in IWAT and liver.
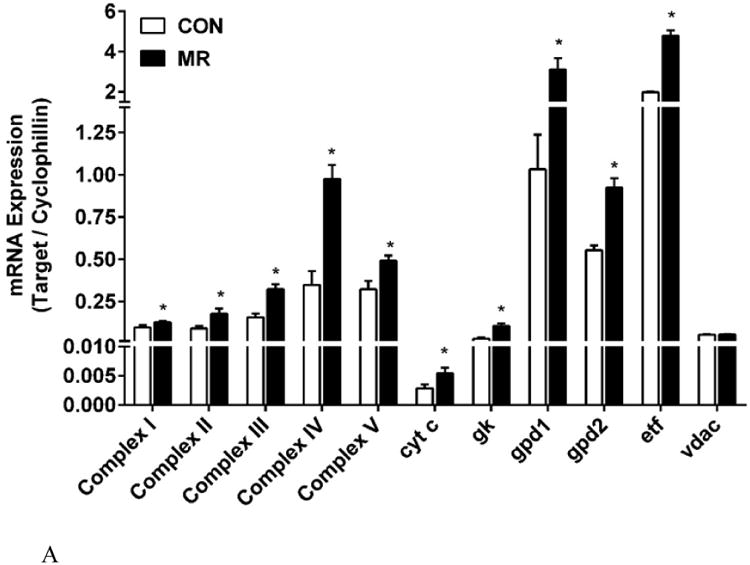
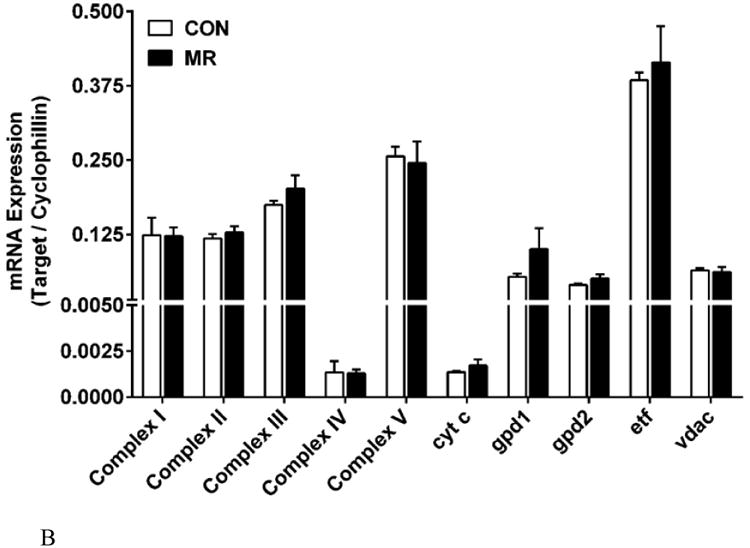
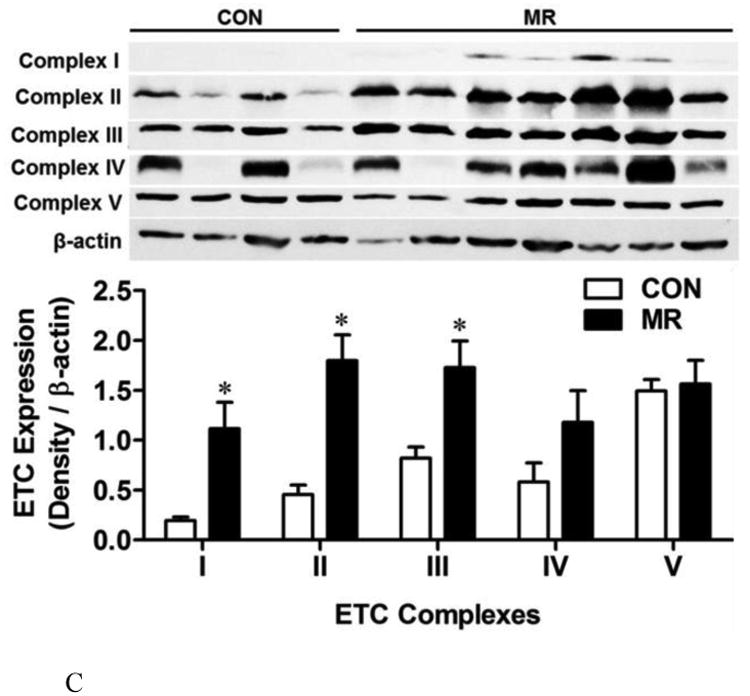
The mRNA expression of electron transport system genes and related mitochondrial genes were measured by quantitative real time PCR in IWAT (Fig. 3A) and liver (Fig. 3B). Data are presented as mean ± SEM from 8 replicates per tissue, and means denoted with an asterisk differ at P<0.05. For Complexes I-V, the mRNA for a single subunit per complex was chosen for analysis. Auxiliary respiratory components were also included in the analysis and they are designated in Figs. 3A and 3B as follows: cyt C, cytochrome C; gk, glycerol kinase; gpd1, glycerol-3-phosphate dehydrogenase 1; gpd2, glycerol-3-phosphate dehydrogenase 2; etf, electrotransfering flavoprotein; vdac, voltage-dependent ananion channel. Fig. 3C shows the impact of MR on expression of Complexes I-V determined by Western blot in IWAT. The mean ± SEM expression levels for Control (n=4) and MR (n=7) are shown in the lower panel of Fig. 3C, with significant differences denoted with an asterisk (P<0.05).
The diet-induced changes in respiratory complex mRNAs in IWAT were mirrored in large part by MR-induced changes in protein expression of three of the five respective respiratory complexes (Fig. 3C). Western blotting shows that Complexes I through III were significantly increased by MR in extracts of isolated IWAT mitochondria (Fig. 3C). In contrast, the within group heterogeneity of expression of Complex IV in the Control group precluded detection of a difference between the dietary groups (Fig. 3C). The expression of Complex V was far more uniform within and across the dietary groups and no effect of MR was detected for this complex (Fig. 3C).
Effect of dietary MR on respiratory capacity of IWAT and EWAT
To further examine the impact of the MR diet on the bioenergetics of WAT, we measured complex I related oxido-reductase activity using the redox probe, TTC, in IWAT and EWAT. Fig 4A shows that dietary MR produced a 5-fold increase in reductase activity in IWAT, but had no discernible effect in EWAT. It is particularly interesting that the TTC activity in EWAT Controls and IWAT Controls was indistinguishable, further emphasizing that the diet-induced changes in reductase activity were specific to the inguinal depot.
Figure 4. Effect of dietary MR on mitochondrial oxidative and respiratory capacity in inguinal WAT and liver.
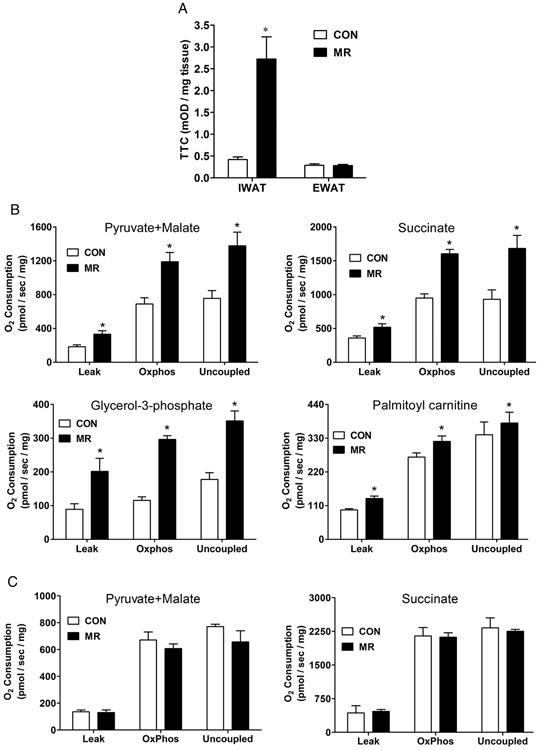
The 2,3,5-triphenyltetrazolium chloride (TTC) reductase activity was measured in IWAT and EWAT isolated from control and MR diet-fed mice as described in the Methods. The formation of TTC was compared in the respective tissues of 6 mice per group and means denoted with an asterisk differ at P<0.05 (Fig. 4A). Respiratory capacity of isolated mitochondria from IWAT (Fig. 4B), liver (Fig. 4C) and muscle (Fig. 4D) was assessed by measuring oxygen consumption in mitochondria provided with various substrates as described in the Methods section. The substrates used are listed in each figure panel, and conditions were used in each series to measure (1) maximum coupled oxygen consumption in an energized (oxidative) state driving phosphorylation of ADP to ATP (Oxphos respiration), (2) oxygen consumption in the presence of substrate oxidation driven only by a proton leak back into the mitochondrial matrix (Leak respiration), and (3) oxygen consumption during maximum proton leak induced by using an artificial uncoupler (Uncoupled respiration). Data is represented as mean ± SEM of 7 independent mitochondrial preparations from each dietary group. For each substrate and mitochondrial tissue source, diet-induced differences in Leak, Oxphos, and Uncoupled respiration were compared, and means denoted with an asterisk differ at P<0.05.
The increased TTC reductase activity in IWAT is a summative measure indicative of increased electron flux within the mitochondrial respiratory system in this depot. To explore the mitochondrial bioenergetics of IWAT in greater detail, oxygen consumption was measured using high performance respirometry in mitochondria isolated from inguinal adipocytes from each dietary group (Fig. 4B). Multiple substrates were used to measure the impact of diet on the activity of specific respiratory complexes as well as when input occurred through alternative electron transfer proteins such as gpd2 and etf. For example, the Leak and OxPhos respiration for complex I and II, measured using pyruvate + malate and succinate, respectively (Fig. 4B), provide evidence of a diet-induced increase in respiratory capacity that parallels the increased expression of these Complexes (see Figs. 3A and 3C). Increased expression of UCP1 (Fig. 1) also contributes to increased respiratory activity in mitochondria by de-repressing electron flux that is normally auto-regulated during coupled phosphorylation. The combined up-regulation of UCP1 and the complexes themselves (Figs. 3A and 3C) are consistent with the additional enhancement of uncoupled respiration and net capacity of IWAT mitochondria to respire. Using glycerol-3-phosphate and palmitoyl carnitine (fatty acyl carnitine) as substrates, we observed a lower overall rate of oxygen consumption compared to respiratory rates obtained with pyruvate and succinate. Nevertheless, significant diet-induced increases in respiratory capacity were detected with both substrates (Fig. 4B). Glycerol-3-phosphate can be oxidized by gpd2 and the resultant electrons channeled into the ubiquinone pool (24), although in white adipose tissue, glycerol-3-phosphate is also an essential substrate for re-esterification of fatty acyl-CoA molecules after their release during lipolysis (25). It is worth noting that the activity of the glycerol-phosphate cycle is quite prominent in brown adipose tissue where glycerol-3-phosphate becomes a significant respiratory substrate in brown adipose tissue during cold exposure (26). In the present study, the component enzymes (e.g., gpd1, gpd2) are both readily detected in IWAT and significantly increased by the MR diet (Fig. 3A), where pronounced diet-induced increases in beige adipocytes were observed (Fig. 1). Fig. 4B illustrates that mitochondria from the MR compared to Control mice have increased capacity to oxidize glycerol-3-phosphate under all conditions examined. These findings suggest that the remodeling of IWAT by dietary MR has significantly enhanced the activity of the glycerol-phosphate shuttle in this tissue. A significant but more modest increase in respiratory activity was attributable to the MR diet when palmitoyl carnitine was employed as substrate (Fig. 4B). These observations are consistent with the increased capacity for fatty acid oxidation previously shown in IWAT of rats after consumption of the MR diet (9).
To assess the tissue specificity of the effects of dietary MR on mitochondrial respiratory capacity, liver (Fig. 4C) and skeletal muscle (Fig. 4D) mitochondria were evaluated under identical conditions. Using substrates for complex I and II as before, the mitochondria isolated from both tissues failed to provide any evidence that dietary MR had modified their respiratory capacity or bioenergetics (Fig. 4C, D). Taken together with the lack of a TTC response in EWAT (Fig. 4A) or change in respiratory capacity in liver or muscle mitochondria, the present findings provide further evidence that the remodeling of IWAT by dietary MR was targeted and involved transcriptional and morphological changes that enhanced the size and respiratory capacity of the mitochondria in this fat depot.
Effect of dietary MR on TCA cycle components
Given the subcellular juxtaposition and functional integration of the TCA cycle with the electron transport system, the expression and functional activity of TCA cycle components were evaluated to test the impact of the diet on this system. The TCA cycle, along with the upstream enzyme complex, pyruvate dehydrogenase, generates the primary electron input for the respiratory complexes in the form of NADH and succinate. The activity of the TCA cycle therefore plays an indispensable role in the flow of electrons from substrate oxidation into the mitochondrial respiratory system. Fig. 5A shows that mRNA expression of all but one enzyme of the TCA cycle was significantly increased in IWAT by dietary MR. The coordinated increase in TCA cycle components by MR was concurrent with the diet-induced increase in mitochondrial size and matrix volume. To assess the relevance of the increase in mRNA expression of each enzyme, their activities were measured in IWAT mitochondria and with the exception of succinyl-CoA ligase (suclg), the activity of each TCA enzyme was increased by dietary MR (Fig. 5B). Interestingly, the enzymatic activity of the mitochondrial form of malic enzyme was increased (Fig. 5B). Malic enzyme serves as a potential outlet for cataplerotic removal of malate from the TCA cycle, followed by subsequent oxidation to pyruvate and conversion to lactate by lactate dehydrogenase (LDH). LDH mRNA expression was increased in IWAT by dietary MR (Fig. 5A), suggesting the potential for enhancement of cataplerotic activity through this pathway.
Figure 5. Effects of dietary MR on tricarboxylic acid (TCA) cycle enzyme mRNA expression and activity in IWAT (5A and 5B) and liver (5C and 5D).
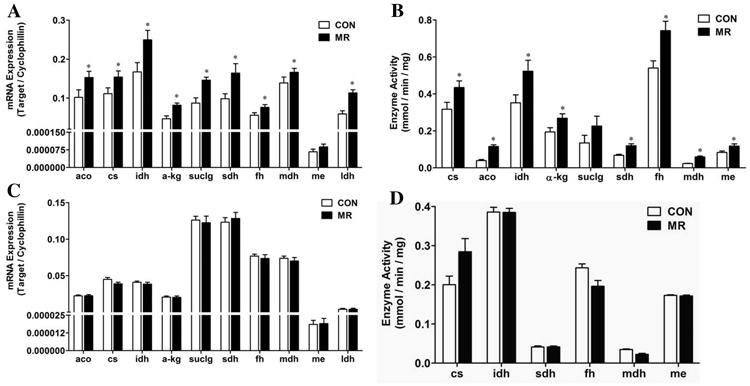
Figs. 5A and 5C show the relative mRNA levels of TCA genes in IWAT and liver, respectively. Figs. 5B and 5D show the corresponding activities of the TCA cycle enzymes in IWAT and liver, respectively. The data are presented as mean ± SEM (n=7-8) for each variable, and significant differences (P<0.05) are denoted with an asterisk. Genes are designated in the figures as follows: cs, citrate synthase; aco, aconitase; idh, isocitrate dehydrogenase; α-kg, α-ketoglutarate dehydrogenase; suclg, succinyl-CoA ligase; sdh, succinate dehydrogenase; fh, fumarase; mdh, malate dehydrogenase; me, malic enzyme; ldh, lactate dehydrogenase.
In contrast to the observed effects of MR on TCA cycle components in IWAT, the diet produced no detectable changes in mRNA levels or enzyme activity of TCA enzymes in the liver (Figs. 5C and 5D). Considered together, these findings illustrate that in IWAT, dietary MR produced a coordinated increase in mitochondrial size, matrix volume, and oxidative and respiratory capacity of the tissue.
Fig. 6 provides a diagrammatic model of the morphological and transcriptional remodeling of the respiratory capacity of IWAT produced by chronic consumption of a methionine-restricted diet. The diet increases the number of multilocular, UCP1-expressing adipocytes by 4-fold, while also significantly increasing mitochondrial size, cristae density, and mitochondrial numbers. The remodeled mitochondria have increased expression of respiratory complexes, accessory respiratory proteins, and TCA cycle components, which translates into increased respiratory capacity and enhanced metabolic flexibility.
Figure 6. Model of effects of dietary MR on IWAT morphology, mitochondrial morphology and mRNA expression of subunits of mitochondrial Complexes I through V of the electron transport chain.
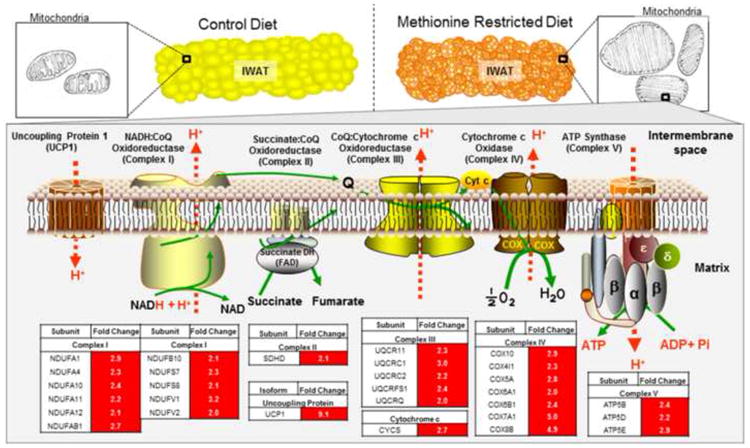
Alteration in morphology of IWAT by MR includes increased formation of multilocular, UCP1-expressing cells, and an overall decrease in cell size. At the organelle level, MR increases the number and size of mitochondria, and increases cristae density. At the molecular level, MR increases expression and function of UCP1, respiratory proteins and TCA cycle enzymes, and increases the capacity of mitochondria to oxidize substrates. The tabular data in red shows the MR-induced fold changes in mRNA expression of the subunits within each mitochondrial respiratory complex.
Recent work in our lab shows that the capacity of the remodeled IWAT to take up glucose in response to insulin is increased ∼8-fold by dietary MR (12). Together these findings support the view that the morphological and functional remodeling of IWAT by MR is central to the contributions of this tissue to the associated changes in physiological roles of this tissue.
Discussion
Dietary methionine restriction (MR) produces a beneficial series of metabolic responses that develop within days of starting the diet and are maintained for as long as it is continued (4,5,9). The most prominent short-term responses are increased EE (5) and increased in vivo insulin sensitivity (11). While improvements in overall insulin sensitivity are predicted to accrue in part from diet-induced reductions in adiposity and serum lipids (5), concomitant increases in the insulin-sensitizing hormones, adiponectin (4,5) and FGF-21 (11)may also be involved. Systematic examination of transcriptional responses to MR in peripheral tissues has been employed as part of an overall strategy to identify the systems biology being affected by the diet (4,7,8,10,27-29). Given that inguinal WAT emerged as a primary target of dietary MR (6,9,27,28), the objective of the present work was to understand how the resulting cellular and molecular responses within this tissue are contributing to specific components of the metabolic phenotype.
Dietary MR limits ongoing fat accumulation by increasing total EE by mimicking the responses of thermoregulatory thermogenesis. For example, dietary MR rapidly increases Ucp1 expression in brown adipose tissue while simultaneously remodeling the morphology of white adipose tissue (5,9). The present work illustrates that the changes occurring in inguinal adipocytes include a 3.5-fold increase in UCP1 expression, a corresponding 4-fold increase in the number of cells expressing UCP1, and specific morphological changes in the ultrastructure of mitochondria within these cells. Using both bromo deoxyuridine incorporation (30) and cell lineage tracing approaches (31), recent studies have shown that essentially all new UCP1-expressing adipocytes in IWAT after cold exposure are derived from preexisting unilocular adipocytes. This transdifferentiation process is blocked entirely by surgical denervation of IWAT but can be restored by infusion of sympathomimetics (32). Thus, it seems likely that the remodeling of inguinal WAT by dietary MR is also a SNS-dependent process (6). An important unanswered question is the relative significance of this “browning” to the capacity for substrate oxidation as well as the overall increase in EE produced by MR. For example, we have shown that dietary MR increased total EE by 35% in mice (6,10) and rats while doubling the night time increase in core body temperature in rats (5). In fully cold-adapted mice, Shabalina et al. (33) established that newly formed beige adipocytes in IWAT were functionally thermogenic and estimated that UCP1-dependent O2 consumption per g of IWAT was ∼20% of the rate in BAT. Based on the robust “browning” of IWAT produced by dietary MR, we conclude that the 4-fold increase in UCP1-expressing adipocytes is making a modest but significant contribution to the EE component of the MR phenotype.
We found that the diet-induced transdifferentiation of white to beige adipocytes in the IWAT depot also involved significant increases in mitochondrial number, size, and cristae density in conjunction with increased expression of essentially all TCA cycle enzymes and respiratory complexes. These changes in mitochondrial ultrastructure were detected using TEM, the gold standard for detecting mitochondrial changes (34). In addition to an increase in numbers, the TEM images revealed significant differences in size and shape of adipocyte mitochondria between the groups. For example, the cross-sectional surface area was roughly two-fold greater in mitochondria from the MR-fed mice. In addition, mitochondria from control adipocytes were elongated or ellipsoid while the adipocyte mitochondria from MR mice were more rounded. The relevance of these changes is unclear, but the increase in cristae density in the MR group is indicative of a larger surface area of the inner mitochondrial membrane. Thought to roughly approximate the capacity of the electron transport system (35), the increased surface area observed here supports the prediction of an expanded respiratory capacity in these cells. This conclusion is also supported by the comprehensive increase in TCA cycle gene expression and activity, which would enhance TCA cycle flux in a manner commensurate with the coordinated increase in ETS capacity. The interdependence of these two pathways was shown by Rowe et al. (35), who reported that compromised TCA cycle activity negatively impacted ETS capacity. In contrast to IWAT, the MR diet had no discernible effect on mitochondrial morphology or respiratory gene expression in liver or muscle. Epididymal WAT (EWAT) was also virtually unaffected with respect to any change in morphology of adipocytes within this depot. The reasons for depot-dependent differences in the extent of browning are unclear, but one possibility is that IWAT is more densely innervated by the SNS than EWAT (31,36,37). Given that MR is thought to effect remodeling of WAT through a combination of increased SNS stimulation and direct effects of FGF-21 (11,12), the increased formation of beige adipocytes in IWAT compared to EWAT may be a reflection of depot-dependent differences in intensity of SNS input to the two sites. Alternatively, it has also been suggested that the appearance of beige adipocytes in IWAT after an increase in SNS input is indicative of reactivation of brown adipocytes that have gradually transdifferentiated back to white adipocytes after weaning under normal conditions (12,32). In contrast to IWAT, EWAT is thought to contain only classical white adipocytes that are capable of minimal morphological remodeling after increased SNS stimulation (12,32). Establishing the basis for this depot-specific difference in remodeling after MR will require experimental verification.
Respiration analysis of mitochondria from inguinal adipocytes of MR-fed mice revealed bio-energetic profiles that were fully consistent with the observed changes in mitochondrial ultrastructure and gene expression. A series of substrates were used to energize mitochondria prior to measuring O2 consumption, and in all cases leak respiration was higher in mitochondria from the MR-fed mice. As shown previously, the higher leak respiration may not be attributable solely to UCP1-mediated uncoupling since increased content of the respiratory proteins can also contribute to increasing the overall capacity of the ETS (38). Oxphos (Oxidative phosphorylation) respiration was also higher in mitochondria from the MR group, indicating that the capacity for coupled/ADP-stimulated respiration is not compromised. Thus, the increased respiratory capacity is likely explained by a combination of increased expression of UCP1 and the respiratory complexes. Experimentally uncoupled respiration (using FCCP) is higher in MR mitochondria, but it does not differ from Oxphos (state 3) respiration for any given substrate. This observation suggests that these mitochondria remain partially coupled despite their elevated UCP1 content.
The higher, pyruvate-energized respiration in mitochondria from the MR group is indicative of an enhanced capacity to utilize glycolytic carbon flux (33). Indeed, a defining property of brown adipose tissue is its heightened capacity to oxidize glucose to support thermoregulatory thermogenesis (25). Succinate fueled oxygen consumption is a function of the capacity of the ETS in conjunction with glycolytic flux through the TCA cycle (24). Therefore, the enhanced capacity to use succinate as a respiratory substrate in mitochondria from the MR adipocytes is consistent with the observed changes in these mitochondria (e.g., increased cristae density, and expression of respiratory complexes and TCA cycle enzymes), giving them a higher capacity to accommodate increased electron flux from the TCA cycle.
Expression of electron transferring flavoprotein (etf) was higher in IWAT of MR-fed mice. Electrons from the beta-oxidation of fatty acids are channeled into etf, which transfers electrons via FAD/FADH2 to the ubiquinone pool of the ETS (24). We recently showed that the capacity to oxidize palmitate was significantly enhanced (5-fold) in IWAT explants from MR rats (9). In the current study, MR enhanced palmitate oxidation in mitochondria from mouse inguinal WAT, but in this context the effects of the diet were modest by comparison. In previous studies where in vivo fuel selection was evaluated in fed and fasted states, we found that fasting produced an exaggerated decrease in RER to levels indicative of a nearly complete shift to fat as metabolic substrate (5). Given that EE was also 20-25% higher in the MR group during fasting, these and the present findings are consistent with an expanded capacity of IWAT to oxidize fat.
The cytoplasmic (gpd1) and mitochondrial (gpd2) forms of glycerol-3-phosphate dehydrogenase were significantly increased by MR in IWAT. The two enzymes form the glycerol phosphate shuttle, which links the inter-conversion of dihydroxyacetone phosphate and glycerol-3-phosphate to re-oxidation of cytosolic NADH produced by glycolysis. Operation of the shuttle was originally proposed to be particularly important in insect flight muscle because it enables sustained ATP production without accumulation of lactic acid (39). The shuttle requires comparable expression of both enzymes which, with the exception of BAT and flight muscle, does not occur in most tissues because of low expression of gpd2 (40). In activated BAT, the shuttle functions as a supplemental thermogenic conduit to supply additional reducing equivalents to the mitochondria. This view is supported by the partial thermogenic defect and increased thriftiness observed in gpd2 null mice (41,42). Alternatively, the shuttle could provide glycerol-3-phosphate needed for triglyceride synthesis. This seems unlikely because even in thermogenically active BAT, the majority of glycerol-3-phosphate needed for re-esterification of fatty acids originates from either glucose oxidation or glyceroneogenesis(43). What is clear from our studies is that mitochondria from the MR group are particularly well adapted to use glycerol-3-phosphate as a respiratory substrate. We also observed a significant induction of glycerol kinase in IWAT by dietary MR, and although its importance in providing glycerol-3-phophate for triglyceride synthesis appears minimal (43), perhaps the primary purpose of the induction of glycerol kinase and gpd2 by MR is to provide glycerol-3-phosphate to mitochondria. For example, Shabalina et al. (33) showed that mitochondria from both beige and brown adipocytes are well adapted to oxidize glycerol-3-phosphate, while mitochondria from white adipocytes are essentially unable to use this substrate. They attribute the difference to low expression of gpd2 in white adipocytes. Collectively, our findings suggest that the coordinated changes in mitochondrial morphology and glycerol-3-phosphate generating pathways induced by MR are particularly important in enhancing the oxidative capacity of the newly formed beige adipocytes in inguinal WAT.
Previous studies have established that dietary MR enhances both the oxidative and synthetic capacities of IWAT with respect to lipid metabolism (5,9,10). Multiple lines of evidence are presented herein to show that the morphological remodeling of IWAT involves a coordinated expansion of mitochondrial numbers and ultrastructure. In addition to expanding oxidative and respiratory capacity of the tissue, the changes enhance substrate flexibility and the ability of the cells to engage futile cycling of substrates. Together, we conclude that the cellular and molecular remodeling of IWAT by dietary MR transforms the metabolic flexibility of the tissue, enabling it to contribute to the diet-induced phenotype.
Acknowledgments
The authors thank Alicia Pierse, Manda Orgeron, and Rob Noland for excellent technical support, and Cindi Tramonte for administrative support. This work was supported in part by ADA 1-12-BS-58 (TWG), and NIH DK-096311 (TWG). This work also made use of the Genomics and Cell Biology & Bioimaging core facilities supported by NIH P20-GM103528 (TWG) and NIH 2P30 DK072476.
Footnotes
Disclosure Statement: The authors have nothing to disclose
Publisher's Disclaimer: This is a PDF file of an unedited manuscript that has been accepted for publication. As a service to our customers we are providing this early version of the manuscript. The manuscript will undergo copyediting, typesetting, and review of the resulting proof before it is published in its final citable form. Please note that during the production process errors may be discovered which could affect the content, and all legal disclaimers that apply to the journal pertain.
References Cited
- 1.Orentreich N, Matias JR, DeFelice A, Zimmerman JA. Low methionine ingestion by rats extends life span. J Nutr. 1993;123:269–274. doi: 10.1093/jn/123.2.269. [DOI] [PubMed] [Google Scholar]
- 2.Richie JP, Jr, Leutzinger Y, Parthasarathy S, Malloy V, Orentreich N, Zimmerman JA. Methionine restriction increases blood glutathione and longevity in F344 rats. FASEB J. 1994;8:1302–1307. doi: 10.1096/fasebj.8.15.8001743. [DOI] [PubMed] [Google Scholar]
- 3.Zimmerman JA, Malloy V, Krajcik R, Orentreich N. Nutritional control of aging. Exp Gerontol. 2003;38:47–52. doi: 10.1016/s0531-5565(02)00149-3. [DOI] [PubMed] [Google Scholar]
- 4.Malloy VL, Krajcik RA, Bailey SJ, Hristopoulos G, Plummer JD, Orentreich N. Methionine restriction decreases visceral fat mass and preserves insulin action in aging male Fischer 344 rats independent of energy restriction. Aging Cell. 2006;5:305–314. doi: 10.1111/j.1474-9726.2006.00220.x. [DOI] [PubMed] [Google Scholar]
- 5.Hasek BE, Stewart LK, Henagan TM, Boudreau A, Lenard NR, Black C, Shin J, Huypens P, Malloy V, Plaisance EP, Krajcik RA, Orentreich N, Gettys TW. Dietary methionine restriction enhances metabolic flexibility and increases uncoupled respiration in both fed and fasted states. Am J Physiol Regul Integr Comp Physiol. 2010;299:R728–R739. doi: 10.1152/ajpregu.00837.2009. [DOI] [PMC free article] [PubMed] [Google Scholar]
- 6.Plaisance EP, Henagan TM, Echlin H, Boudreau A, Hill KL, Lenard NR, Hasek BE, Orentreich N, Gettys TW. Role of β-adrenergic receptors in the hyperphagic and hypermetabolic responses to dietary methionine restriction. Am J Physiol Regul Integr Comp Physiol. 2010;299:R740–R750. doi: 10.1152/ajpregu.00838.2009. [DOI] [PMC free article] [PubMed] [Google Scholar]
- 7.Ghosh S, Wanders D, Stone KP, Van NT, Cortez CC, Gettys TW. A systems biology analysis of the unique and overlapping transcriptional responses to caloric restriction and dietary methionine restriction in rats. FASEB J. 2014;28:2577–2590. doi: 10.1096/fj.14-249458. [DOI] [PMC free article] [PubMed] [Google Scholar]
- 8.Wanders D, Ghosh S, Stone K, Van NT, Gettys TW. Transcriptional impact of dietary methionine restriction on systemic inflammation: Relevance to biomarkers of metabolic disease during aging. Biofactors. 2013;40:13–26. doi: 10.1002/biof.1111. [DOI] [PMC free article] [PubMed] [Google Scholar]
- 9.Hasek BE, Boudreau A, Shin J, Feng D, Hulver M, Van N, Laque A, Stewart LK, Stone K, Wanders D, Ghosh S, Pessin JE, Gettys TW. Remodeling the integration of lipid metabolism between liver and adipose tissue by dietary methionine restriction in rats. Diabetes. 2013;62:3362–3372. doi: 10.2337/db13-0501. [DOI] [PMC free article] [PubMed] [Google Scholar]
- 10.Anthony TG, Morrison CD, Gettys TW. Remodeling of lipid metabolism by dietary restriction of essential amino acids. Diabetes. 2013;62:2635–2644. doi: 10.2337/db12-1613. [DOI] [PMC free article] [PubMed] [Google Scholar]
- 11.Stone KP, Wanders D, Orgeron M, Cortez CC, Gettys TW. Mechanisms of Increased in Vivo Insulin Sensitivity by Dietary Methionine Restriction in Mice. Diabetes. 2014;63:3721–3733. doi: 10.2337/db14-0464. [DOI] [PMC free article] [PubMed] [Google Scholar]
- 12.Wanders D, Burk DH, Cortez CC, Van NT, Stone KP, Baker M, Mendoza T, Mynatt RL, Gettys TW. UCP1 is an essential mediator of the effects of methionine restrictin on energy balance but not insulin sensitivity. FASEB Journal. 2015;29:1–13. doi: 10.1096/fj.14-270348. [DOI] [PMC free article] [PubMed] [Google Scholar]
- 13.Carpenter AE, Jones TR, Lamprecht MR, Clarke C, Kang IH, Friman O, Guertin DA, Chang JH, Lindquist RA, Moffat J, Golland P, Sabatini DM. CellProfiler: image analysis software for identifying and quantifying cell phenotypes. Genome Biol. 2006;7:R100. doi: 10.1186/gb-2006-7-10-r100. [DOI] [PMC free article] [PubMed] [Google Scholar]
- 14.Prpic V, Watson PM, Frampton IC, Sabol MA, Jezek GE, Gettys TW. Differential mechanisms and development of leptin resistance in A/J vs C57BL/6J mice during diet-induced obesity. Endocrinology. 2003;144:1155–1163. doi: 10.1210/en.2002-220835. [DOI] [PubMed] [Google Scholar]
- 15.Kaaman M, Sparks LM, van H V, Smith SR, Sjolin E, Dahlman I, Arner P. Strong association between mitochondrial DNA copy number and lipogenesis in human white adipose tissue. Diabetologia. 2007;50:2526–2533. doi: 10.1007/s00125-007-0818-6. [DOI] [PubMed] [Google Scholar]
- 16.Commins SP, Watson PM, Padgett MA, Dudley A, Argyropoulos G, Gettys TW. Induction of uncoupling protein expression in brown and white adipose tissue by leptin. Endocrinology. 1999;140:292–300. doi: 10.1210/endo.140.1.6399. [DOI] [PubMed] [Google Scholar]
- 17.Li P, Zhu Z, Lu Y, Granneman JG. Metabolic and cellular plasticity in white adipose tissue II: role of peroxisome proliferator-activated receptor-alpha. Am J Physiol Endocrinol Metab. 2005;289:E617–E626. doi: 10.1152/ajpendo.00010.2005. [DOI] [PubMed] [Google Scholar]
- 18.Martin BR, Denton RM. Intracellular localization of enzymes in white adipose tissue cells and permeability properties of fat cell mitochondria. Biochem J. 1970;117:861–877. doi: 10.1042/bj1170861. [DOI] [PMC free article] [PubMed] [Google Scholar]
- 19.Frezza C, Cipolat S, Scorrano L. Organelle isolation: functional mitochondria from mouse liver, muscle and cultured fibroblasts. Nat Protoc. 2007;2:287–295. doi: 10.1038/nprot.2006.478. [DOI] [PubMed] [Google Scholar]
- 20.Bergmeyer HUI. Methods of Enzymatic Analysis. Elsevier Science; 1965. [Google Scholar]
- 21.Hausladen A, Fridovich I. [4] Measuring nitric oxide and superoxide: Rate constants for aconitase reactivity. In: Lester P, editor. Methods in Enzymology Nitric Oxide Part B: Physiological and Pathological Processes. Vol. 269. Academic Press; 1996. pp. 37–41. [DOI] [PubMed] [Google Scholar]
- 22.Bubber P, Haroutunian V, Fisch G, Blass JP, Gibson GE. Mitochondrial abnormalities in Alzheimer brain: mechanistic implications. Ann Neurol. 2005;57:695–703. doi: 10.1002/ana.20474. [DOI] [PubMed] [Google Scholar]
- 23.MacDonald MJ, Longacre MJ, Kendrick MA. Mitochondrial malic enzyme (ME2) in pancreatic islets of the human, rat and mouse and clonal insulinoma cells. Arch Biochem Biophys. 2009;488:100–104. doi: 10.1016/j.abb.2009.07.004. [DOI] [PMC free article] [PubMed] [Google Scholar]
- 24.Nicholls DG, Ferguson SJ. Bioenergetics. Vol. 3. Academic Press; 2002. [Google Scholar]
- 25.Frayn KN, Humphreys SM, Coppack SW. Fuel selection in white adipose tissue. Proc Nutr Soc. 1995;54:177–189. doi: 10.1079/pns19950047. [DOI] [PubMed] [Google Scholar]
- 26.Houstek J, Cannon B, Lindberg O. Gylcerol-3-phosphate shuttle and its function in intermediary metabolism of hamster brown-adipose tissue. Eur J Biochem. 1975;54:11–18. doi: 10.1111/j.1432-1033.1975.tb04107.x. [DOI] [PubMed] [Google Scholar]
- 27.Perrone CE, Mattocks DA, Plummer JD, Chittur SV, Mohney R, Vignola K, Orentreich DS, Orentreich N. Genomic and Metabolic Responses to Methionine-Restricted and Methionine-Restricted, Cysteine-Supplemented Diets in Fischer 344 Rat Inguinal Adipose Tissue, Liver and Quadriceps Muscle. J Nutrigenet Nutrigenomics. 2012;5:132–157. doi: 10.1159/000339347. [DOI] [PubMed] [Google Scholar]
- 28.Perrone CE, Mattocks DA, Jarvis-Morar M, Plummer JD, Orentreich N. Methionine restriction effects on mitochondrial biogenesis and aerobic capacity in white adipose tissue, liver, and skeletal muscle of F344 rats. Metabolism. 2009;59:1000–1011. doi: 10.1016/j.metabol.2009.10.023. [DOI] [PubMed] [Google Scholar]
- 29.Perrone CE, Mattocks DA, Hristopoulos G, Plummer JD, Krajcik RA, Orentreich N. Methionine restriction effects on 11 -HSD1 activity and lipogenic/lipolytic balance in F344 rat adipose tissue. J Lipid Res. 2008;49:12–23. doi: 10.1194/jlr.M700194-JLR200. [DOI] [PubMed] [Google Scholar]
- 30.Himms-Hagen J, Melnyk A, Zingaretti MC, Ceresi E, Barbatelli G, Cinti S. Multilocular fat cells in WAT of CL-316243-treated rats derive directly from white adipocytes. Am J Physiol Cell Physiol. 2000;279:C670–C681. doi: 10.1152/ajpcell.2000.279.3.C670. [DOI] [PubMed] [Google Scholar]
- 31.Lee YH, Petkova AP, Konkar AA, Granneman JG. Cellular origins of cold-induced brown adipocytes in adult mice. FASEB J. 2014;29:286–299. doi: 10.1096/fj.14-263038. [DOI] [PMC free article] [PubMed] [Google Scholar]
- 32.Contreras GA, Lee YH, Mottillo EP, Granneman JG. Inducible brown adipocytes in subcutaneous inguinal white fat: the role of continuous sympathetic stimulation. Am J Physiol Endocrinol Metab. 2014;307:E793–E799. doi: 10.1152/ajpendo.00033.2014. [DOI] [PMC free article] [PubMed] [Google Scholar]
- 33.Shabalina IG, Petrovic N, de Jong JM, Kalinovich AV, Cannon B, Nedergaard J. UCP1 in Brite/Beige Adipose Tissue Mitochondria Is Functionally Thermogenic. Cell Rep. 2013;5:1196–1203. doi: 10.1016/j.celrep.2013.10.044. [DOI] [PubMed] [Google Scholar]
- 34.Larsen S, Nielsen J, Hansen CN, Nielsen LB, Wibrand F, Stride N, Schroder HD, Boushel R, Helge JW, Dela F, Hey-Mogensen M. Biomarkers of mitochondrial content in skeletal muscle of healthy young human subjects. J Physiol. 2012;590:3349–3360. doi: 10.1113/jphysiol.2012.230185. [DOI] [PMC free article] [PubMed] [Google Scholar]
- 35.Rowe GC, Patten IS, Zsengeller ZK, El-Khoury R, Okutsu M, Bampoh S, Koulisis N, Farrell C, Hirshman MF, Yan Z, Goodyear LJ, Rustin P, Arany Z. Disconnecting Mitochondrial Content from Respiratory Chain Capacity in PGC-1- Deficient Skeletal Muscle. 2013;3:1449–1456. doi: 10.1016/j.celrep.2013.04.023. [DOI] [PMC free article] [PubMed] [Google Scholar]
- 36.Bartness TJ, Shrestha YB, Vaughan CH, Schwartz GJ, Song CK. Sensory and sympathetic nervous system control of white adipose tissue lipolysis. Mol Cell Endocrinol. 2010;318:34–43. doi: 10.1016/j.mce.2009.08.031. [DOI] [PMC free article] [PubMed] [Google Scholar]
- 37.Bartness TJ, Song CK. Thematic review series: adipocyte biology. Sympathetic and sensory innervation of white adipose tissue. J Lipid Res. 2007;48:1655–1672. doi: 10.1194/jlr.R700006-JLR200. [DOI] [PubMed] [Google Scholar]
- 38.Matthias A, Jacobsson A, Cannon B, Nedergaard J. The bioenergetics of brown fat mitochondria from UCP1-ablated mice - UCP1 is not involved in fatty acid-induced deenergization (“uncoupling”) J Biol Chem. 1999;274:28150–28160. doi: 10.1074/jbc.274.40.28150. [DOI] [PubMed] [Google Scholar]
- 39.Mracek T, Drahota Z, Houstek J. The function and the role of the mitochondrial glycerol-3-phosphate dehydrogenase in mammalian tissues. Biochim Biophys Acta. 2013;1827:401–410. doi: 10.1016/j.bbabio.2012.11.014. [DOI] [PubMed] [Google Scholar]
- 40.Ohkawa KI, Vogt MT, Farber E. Unusually high mitochondrial alpha glycerophosphate dehydrogenase activity in rat brown adipose tissue. J Cell Biol. 1969;41:441–449. doi: 10.1083/jcb.41.2.441. [DOI] [PMC free article] [PubMed] [Google Scholar]
- 41.Alfadda A, DosSantos RA, Stepanyan Z, Marrif H, Silva JE. Mice with deletion of the mitochondrial glycerol-3-phosphate dehydrogenase gene exhibit a thrifty phenotype: effect of gender. Am J Physiol Regul Integr Comp Physiol. 2004;287:R147–R156. doi: 10.1152/ajpregu.00103.2004. [DOI] [PubMed] [Google Scholar]
- 42.DosSantos RA, Alfadda A, Eto K, Kadowaki T, Silva JE. Evidence for a compensated thermogenic defect in transgenic mice lacking the mitochondrial glycerol-3-phosphate dehydrogenase gene. Endocrinology. 2003;144:5469–5479. doi: 10.1210/en.2003-0687. [DOI] [PubMed] [Google Scholar]
- 43.Moura MA, Festuccia WT, Kawashita NH, Garofalo MA, Brito SR, Kettelhut IC, Migliorini RH. Brown adipose tissue glyceroneogenesis is activated in rats exposed to cold. Pflugers Arch. 2005;449:463–469. doi: 10.1007/s00424-004-1353-7. [DOI] [PubMed] [Google Scholar]