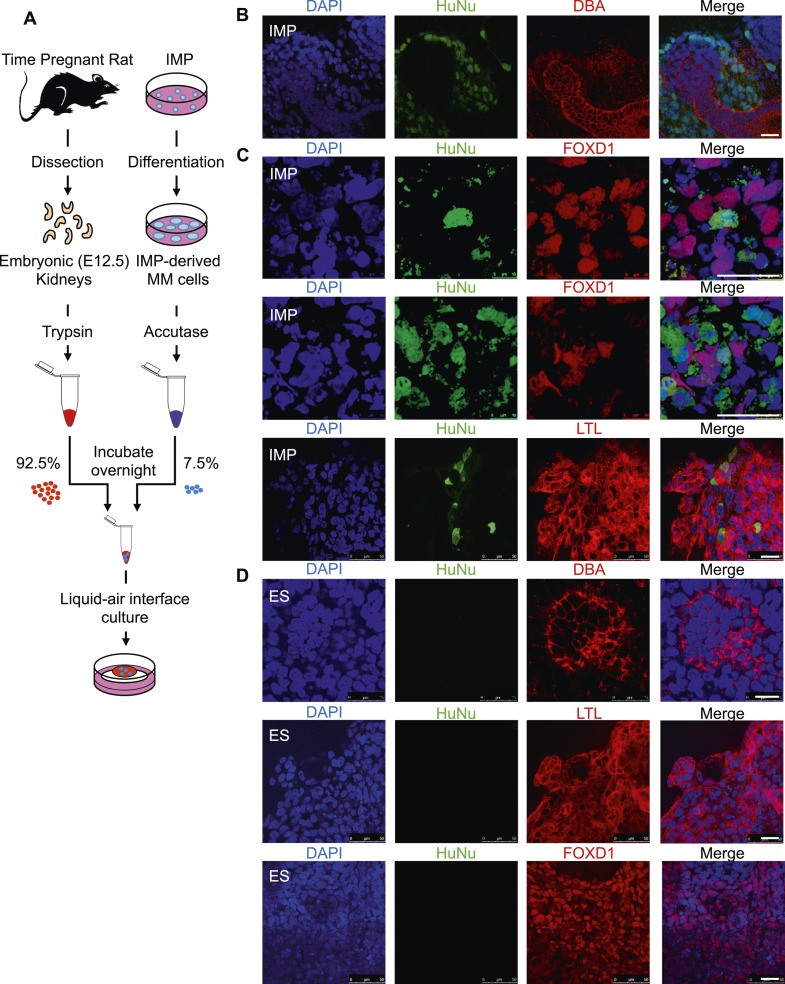
Figure 9. Incorporation of IMP cells into kidney mesenchyme.
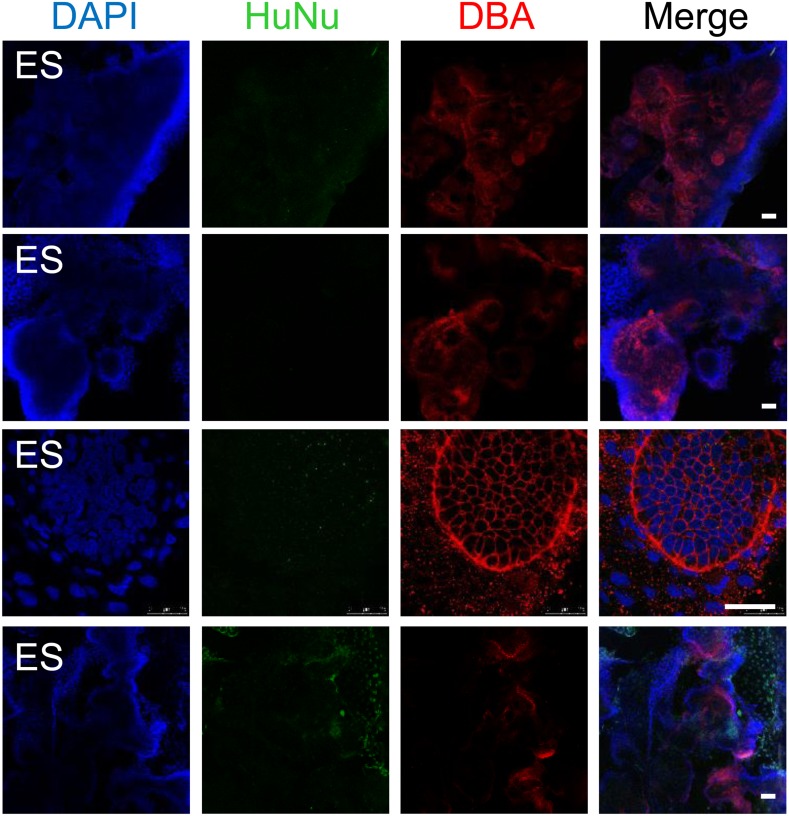
(A) Schematic of a re-aggregation assay to test renal potential. IMP cells were differentiated as depicted in Figure 7A and mixed with dissociated embryonic rat kidneys at a ratio of 7.5:92.5 and co-incubated for 4 days to form organoids in media-air interface co-culture. (B) Representative images of re-aggregated kidney organoids. IMP cells differentiated to MM are detected with the human specific nuclear antigen HuNu (green). Human cells are clearly integrated into renal organoids and surround epithelial structures labeled with the lectin Dolichos biflorus agglutinin (DBA) (red). Figure 9—figure supplement 1 provides additional images of MP cells incorporating into renal structures. Scale bar = 25 µm. (C) Representative images of re-aggregated kidney organoids. Renal organoids were labeled with DAPI (blue) to identify nuclei, HuNu (green) to identify human cells and with either FOXD1 antibody or LTL (red). Two representative sets of images are shown to indicate co-localization of FOXD1 in HuNu positive cells. Scale bar = 25 µm. (D) Undifferentiated hES cells failed to integrate into renal organoids. Instead of MP cells, undifferentiated ES cells were mixed with dissociated embryonic rat kidneys. These cells failed to integrate into the renal organoid structures as indicated by the lack of HuNu staining. Figure 9—figure supplement 2 demonstrates that undifferentiated ES cells fail to incorporate into these structures. Scale bar = 25 µm.


