

Abstract
Background and aims
Preliminary data suggests lower serum hepatitis B surface antigen level is associated with more severe liver fibrosis in HBeAg positive patients. We evaluated the association of HBsAg level with biochemical, virological, and histological features in asymptomatic patients with chronic HBV infection.
Methods
HBsAg levels were measured at baseline in 481 asymptomatic, treatment naive patients with chronic HBV infection. Subjects were followed-up prospectively (median, 12; range, 8–36 months). Phases of HBV infection were defined after regular monitoring of HBV-DNA and transaminases. Liver histology was scored using the METAVIR system.
Results
HBeAg positive (n, 126) patients were significantly younger than HBeAg negative (n, 355), median age 26 vs 30 years; P < 0.01. HBV genotype could be determined in 350 patients, 240 (68.57%) had genotype D and 100 (28.57%) had genotype A. HBsAg level had modest correlation with serum HBV DNA(r = 0.6 vs 0.4 in eAg positive & negative respectively). HBeAg + ve patients with fibrosis score ≥ F2 showed significantly lower median serum HBsAg levels and serum HBV DNA levels compared with patients with F0–F1 score (median, range; 4.51, 2.99–6.10 vs 5.06, 4.13–5.89, P < 0.01) and (8.39, 3.85–10.60, P < 0.01) respectively. Significant inverse correlation of HBsAg level was found with liver fibrosis in eAg positive group (r = −0.76; P < 0.001). HBsAg level cut off value 4.7 log10 IU/ml predicted moderate to advance fibrosis (F ≥ 2) with 92% sensitivity, 85% specificity & 91% negative predictive value.
Conclusion
Lower HBsAg level might reflect the status of advanced liver fibrosis in HBeAg positive chronic hepatitis B subjects.
Keywords: liver fibrosis, hepatic fibrosis, HBsAg quantification, chronic hepatitis B, chronic HBV infection
Abbreviations: ALT, alanine aminotransferase; HBV, hepatitis B virus; HCC, hepatocellular carcinoma; ROC, receiver operating characteristics
Hepatitis B virus (HBV) infection remains a serious global health problem despite the advances in prevention, diagnosis and management strategies. Almost 3/4 of total estimated 350 million infected individuals reside in Asia pacific region.1, 2 India forms nearly 15% of the entire pool of HBV carriers in the world, considering, on an average, hepatitis B surface antigen (HBsAg) carrier rate of 4%.3 Most of the persons in Asia pacific acquired infection in perinatal or early childhood period and early phase of infection is characterized by normal serum alanine aminotransferase (ALT), elevated HBV DNA with minimal histologic changes on liver biopsy.4, 5 Some patients may have recurrent hepatitis flares leading to advance liver fibrosis and disease progression.6 Lately, proportion of HBeAg positive patients with normal or minimally elevated ALT has been shown to have significant fibrosis and necro-inflammation in liver histology.7, 8, 9 Early detection of significant liver disease and treatment substantially improves patient outcomes even after decompensation occurs10; however, current clinical practice based on noninvasive tests often fails to detect liver disease until it is at an advanced stage.11 Evidence for doing invasive liver biopsy in patients with normal liver biochemistry is not robust at present.12, 13 Thus, there is an important need for new approaches that can improve the ability to identify liver fibrosis at early stage.
Although higher HBV DNA is associated with a higher risk of cirrhosis and hepatocellular carcinoma (HCC) but association with the severity of liver fibrosis in HBeAg-positive patients is not consistent.14, 15 Efficacy of Transient elastography (TE) is limited by inability to precisely detect lower fibrosis stages (F0–F2), inflammatory activity, and is influenced by ALT and obesity.16 As association of HBsAg levels with the level of covalently closed circular (ccc) DNA was reported,17 the importance of HBsAg quantification has been recognized as an important marker to monitor the natural history in chronic hepatitis and predict treatment outcome. Serum HBsAg level has been shown to vary with phase of chronic HBV infection,18, 19 for differentiating true inactive carriers from patients with HBeAg negative chronic hepatitis,20 and for predicting response to interferon therapy.21, 22 These observations emphasize that serum HBsAg levels reflect the interplay between the virus and the immune system providing complementary information on viral load. HBsAg serum levels are the resultant of the complex equilibrium between the virus and the host's immune system as well as the product of the transcription of specific mRNAs rather than viral replication. There is emerging evidence, suggesting association between HBsAg level and liver fibrosis in HBeAg-positive patients.23, 24, 25 The aim of our study was to evaluate the association of HBsAg level with biochemical, virological, and histological features in asymptomatic patients with chronic HBV infection and its ability to differentiate between different groups of chronic HBV infection.
Patients and method
Patient Information
481 asymptomatic, treatment naïve patients with chronic HBV infection who attended Gastroenterology Unit of the University Hospital of Varanasi between November 2009 and January 2013 were prospectively enrolled. Institutional ethical committee approved the study protocol and informed consent was taken from patients. Inclusion criteria were aged 15 years or older with positive HBsAg for more than 6 months, no history of previous antivirals and willing for regular follow up. Exclusion criteria were pregnant females, other medical illness like diabetes mellitus, ischemic heart disease, HCC & other coexistent liver disease like autoimmune hepatitis, co-infection with HIV, HCV or other hepatotropic viruses, and alcohol intake >20 g/day.
Methods and Data Collection
Serum tests were performed at baseline and then 3 monthly or earlier if required, of prospective follow up (median, 22; range, 12–38 months). Phases of HBV infection were defined after minimum of 1 year monitoring of serum HBV DNA and transaminases according to AASLD guidelines.26 (1) Immune-tolerant—ALT persistently <40 IU/L on 3 consecutive points at three months interval, HBV DNA > 20,000 IU/L, normal liver histology if biopsy done. (2) Immune active (HBeAg positive)—intermittent/persistent rise in ALT ≥ 40 IU/L, HBV DNA > 20000 IU/L and/or liver biopsy showed chronic hepatitis with moderate to severe necro-inflammation and/or moderate to advance fibrosis. (3) Inactive carriers—ALT persistently < 40 IU/L on three consecutive points at three months interval, HBV DNA < 2000 IU/ML on three consecutive occasions at three months interval and/or absence of significant hepatitis in liver biopsy if done. (4) Immune active (HBeAg negative)—intermittent/persistent rise in ALT ≥ 40 IU/L, HBV DNA > 2000 IU/ML and/or liver biopsy showed chronic hepatitis with moderate to severe necro-inflammation or moderate to advance fibrosis. Upper limit of normal (ULN) ALT was taken as 40 IU/L.
HBsAg was quantified at baseline using the Architect HBsAg assay (Abbott Laboratories; dynamic range, 0.05–250.0 IU/mL) after 1:100 dilution. Samples with HBsAg levels ≥250.0 IU/mL at 1:100 dilutions were retested at 1:1000 final dilution. Samples with HBsAg level <0.05 IU/mL at 1:100 dilution were retested undiluted. Liver biopsy was done after informed consent through percutaneous approach under ultrasonography guidance. METAVIR scoring system was used for examination of liver biopsy specimens.
HBV Genotyping
Hepatitis B viral genotype analysis (A–F) was done with the help of multiplex PCR using six sets of primers, which are genotype-specific nucleotide sequences, which were conserved in each of six HBV genotype. HPLC purified primers were procured from Metabion international, Deutschland, Germany. Multiplex PCR was performed using ABI Veriti Thermal cycler (Applied Biosystems, USA).
Statistical analysis
Descriptive statistics for continuous variables included mean with SD or median and for categorical variables frequency distribution with percentage was calculated. Statistical differences between sample groups were tested using Pearson's X2 test for qualitative data and using Student's t test and non-parametric Mann–Whitney test for quantitative data. HBV DNA and HBsAg levels were logarithmically transformed. The Spearman correlation test was used to analyze the correlations between HBsAg serum levels and other continuous variables. Independent factors associated with advanced liver fibrosis were identified using multivariate logistic regression analysis. The cut-off value of the HBsAg titer for advanced liver fibrosis was determined using the receiver operating characteristics (ROC) curve. Ability of HBsAg levels to identify phase of chronic HBV infection was checked using discriminant analysis (DA). A two-sided P value of 0.05 was considered statistically significant.
Results
Patient Characteristics
Demographic profile and laboratory parameters of HBeAg-positive patients are shown in Table 1. Out of 350 subjects in which genotype could be determined, 240 (68.57%) had genotype D and 100 (28.57%) had genotype A and 10 (2.9%) patients had other genotypes. When patients were characterized according to their infection profile, mean ALT was higher in immune active e + ve patients than immune active HBeAg negative subjects (96.9 – 67.3 vs 74.1 – 41.9, P < 0.01 respectively). Small but statistically significant difference was also found in platelet count between immune active e negative patients and inactive carrier subjects (Table 2).
Table 1.
Baseline Patient Characteristics.
| Variable | All (n = 481) | HBeAg + ve (n = 126) | HBeAg −ve (n = 355) | P valuea |
|---|---|---|---|---|
| Age (years) median, range | 31 (14–65) | 26 (15–65) | 30 (14–65) | 0.003 |
| Male (%) | 383 (79.6) | 109 (86.5) | 274 (77.2) | |
| Platelets 106/μl Median, range | 183 (56–288) | 181 (56–288) | 192 (162–249) | 0.09 |
| ALT IU/L Median, range | 61 (11–366) | 61 (12–366) | 44 (11–229) | <0.05 |
| ALT <40 IU (%) | 198 (41.2) | 36 (28.6) | 162 (45.6) | <0.01 |
| HBsAg log10 IU/ML Median, range | 3.75 (1.11–6.26) | 4.60 (1.26–6.26) | 3.47 (1.11–4.66) | <0.001 |
| HBV DNA Log10 IU/ML Median, range | 4.78 (0.30–11.5) | 8.39 (2.10–11.56) | 3.40 (0.30–7.94) | <0.001 |
Mann–Whitney test.
Table 2.
Baseline Patient Characteristics in Different Phases.
| Variable | IT (n = 45) | IA e + ve (n = 81) | IA e − ve (n = 155) | IC (n = 200) | P valuea |
|---|---|---|---|---|---|
| Age (years) Median, range | 21.5 (15–50) | 25 (15–65) | 30 (15–60) | 28 (14–65) | <0.05 |
| ALT (IU/L) Median, range | 35.5 (15–116) | 77.5 (23–366) | 66 (16–229) | 34 (11–185) | <0.001 |
| Albumin (gram/dl) Median, range | 4.8 (4.2–4.9) | 4.5 (3.9–4.6) | 4.4 (3.8–4.8) | 4.9 (4.5–4.9) | ns |
| Varices n (%) | – | 2 (2.4) | 2 (1.2) | – | <0.01 |
| HBsAg log10 IU/ML Median, range | 5.08 (4.51–6.26) | 4.52 (2.99–5.40) | 4.11 (1.15–4.69) | 3.12(1.11–4.51) | <0.001 |
| HBV DNA log10 IU/ML Median, range | 9.92 (4.96–11.56) | 8.39(3.85–11.23) | 4.6 (2.41–7.94) | 2.25 (0.30–3.3) | <0.001 |
IT—Immune tolerant; IA—Immune active; IC—Inactive carrier.
Kruskal–Wallis test.
Correlation Between Serum HBsAg Level and Clinical Parameters in Different Phases
On univariate analysis in none of the phases of chronic HBV-infection, serum HBsAg level was correlated with ALT, gender, serum bilirubin, albumin, platelet count. Serum HBsAg quantification showed a negative association with age (r = −0.172, P < 0.05) in inactive carriers.
Correlation Between Serum HBsAg Level and HBV DNA Levels Stratified According to HBeAg Status
Grouping the patients according to HBeAg status revealed modest correlation between HBsAg level and HBV DNA levels in both HBeAg + ve and HBeAg negative patients on univariate analysis (r = 0.62, P < 0.001 and 0.45, P < 0.01 respectively) (Figure 1).
Figure 1.

Correlation between serum HBsAg level and HBV DNA.
Liver Histopathology
Liver biopsy was done in 312 patients. Overall, mean fibrosis score was significantly higher in HBeAg positive patients as compared to HBeAg negative patients (mean fibrosis stage: 1.95 – 0.99 vs. 1.46 – 0.93; P < 0.01). Frequency of the different stages of liver activity/fibrosis was not statistically different between HBeAg positive and negative patients.
Correlation Between Serum HBsAg Level and Grade of Fibrosis
Distribution of serum HBsAg level and HBV DNA stratified by fibrosis grade showed declining levels of median serum HBsAg level and HBV DNA as the grade of fibrosis increased in HBeAg + ve patients (Figure 2a). Inverse correlation was present between serum HBsAg level and fibrosis severity in HBeAg + ve patients (r = −0.76, P < 0.001) (Figure 2a). No correlation between HBsAg level and severity of fibrosis was observed in HBeAg negative patients (Figure 2b). However, Patients with cirrhosis (stage F4) displayed significantly low median serum HBsAg levels.
Figure 2.

Correlation between HBsAg or HBV DNA level and fibrosis severity in (a) HBeAg positive and (b) HBeAg negative patients, (c) HBeAg positive patients stratified according to ALT level.
Among HBeAg + ve patients with ALT > ULN (n = 92), 66 (71.7%) had fibrosis score ≥2, however even in patients with ALT < ULN (n = 30) comparable number of patients (53.4%) had fibrosis score ≥2 (p > 0.05). Patients with fibrosis score ≥2 had significantly lower median HBsAg levels as compare to < F2 score in both normal and elevated ALT group (median, range; 4.44, 3.45–4.66 vs 4.94, 4.61–5.89; P < 0.05 in normal ALT and 4.53, 2.99–6.10 vs 5.07, 4.13–5.40; P < 0.05 in elevated ALT respectively) (Figure 2c).
Serum HBsAg Level and Fibrosis Severity
HBeAg + ve patients with fibrosis score ≥ F2 showed significantly lower median serum HBsAg levels and serum HBV DNA levels compared with patients with F0–F1 score (median, range; 4.51, 2.99–6.10 vs 5.06, 4.13–5.89, P < 0.01) and (8.39, 3.85–10.60, P < 0.01) respectively. There was no significant difference in serum HBsAg levels of HBeAg negative patients with moderate to severe fibrosis compared with those with no or mild fibrosis. However, serum HBV DNA was significantly higher in HBeAg negative patients with moderate to severe disease (Table 3).
Table 3.
Serum HBsAg Level and HBV DNA According to HBeAg Status and Fibrosis Stage.
| Fibrosis score (METAVIR) | All (n = 312) | HBeAg + ve (n = 122) | HBeAg–ve (n = 190) | P Value |
|---|---|---|---|---|
| Mean HBsAg level log10 IU/ML | ||||
| F0–F1 | 4.00 – 0.92(n = 132) | 4.99 – 0.36 (n = 40) | 3.64 – 0.77 (n = 92) | <0.01 |
| F2–F4 | 4.09 – 0.64 (n = 180) | 4.47 – 0.42 (n = 82) | 3.81 – 0.62 (n = 98) | <0.05 |
| P value | <0.01 | 0.153 | ||
| Mean Serum HBV DNA log10 IU/ML | ||||
| F0–F1 | 5.44 – 2.60(n = 132) | 8.95 – 1.35 (n = 40) | 3.92 – 1.09 (n = 92) | <0.001 |
| F2–F4 | 6.19 – 2.15 (n = 180) | 8.16 – 1.36 (n = 82) | 4.71 – 1.26 (n = 98) | <0.001 |
| P value | 0.02 | <0.01 | ||
ROC Analysis
ROC curves were drawn for ability of serum HBsAg level to differentiate HBeAg + ve subjects between immune tolerant and immune active phase, predicting the presence of moderate to severe fibrosis and to obtain HBsAg level cut off with the highest sensitivity and specificity.
-
(a)
Differentiation between immune tolerant and immune active HBeAg + ve patients—The area under the ROC of HBsAg level to identify immune active patients in HBeAg + ve subjects was 0.93 (95% CI: 0.88–0.98). The HBsAg level cut off with the highest sensitivity and specificity was 4.7 Log10 IU/mL (sensitivity, 89%; specificity, 91%, diagnostic accuracy 91%) (Figure 3a).
-
(b)
Prediction of moderate to advance fibrosis in HBeAg + ve subjects—The ability of serum HBsAg to differentiate HBeAg + ve subjects into F0–F1 or F2–F4 grades gave an AUROC of 0.87 (95% CI: 0.76–0.98). The HBsAg cut off 4.7 Log10 IU/ML predicted moderate to advance fibrosis with sensitivity of 92%, specificity of 85% and diagnostic accuracy of 89% and negative predictive value of 91% (Figure 3b).
Figure 3.

Diagnostic performance of serum HBsAg for (a) discriminate immune tolerant and immune active HBeAg positive patients, (b) predict moderate to advance fibrosis in HBeAg positive patients.
HBsAg Serum Levels During Follow-up
Kinetics of HBsAg levels were analyzed in 20 patients during follow-up. Median HBsAg levels were stable in the immune tolerant and immune active patients but showed mild decline in inactive carrier patients (Figure 4). Baseline and end of follow-up HBsAg levels in inactive carriers showed overall decline of 0.04 log10 IU/mL (range, −0.90 to +0.65).
Figure 4.
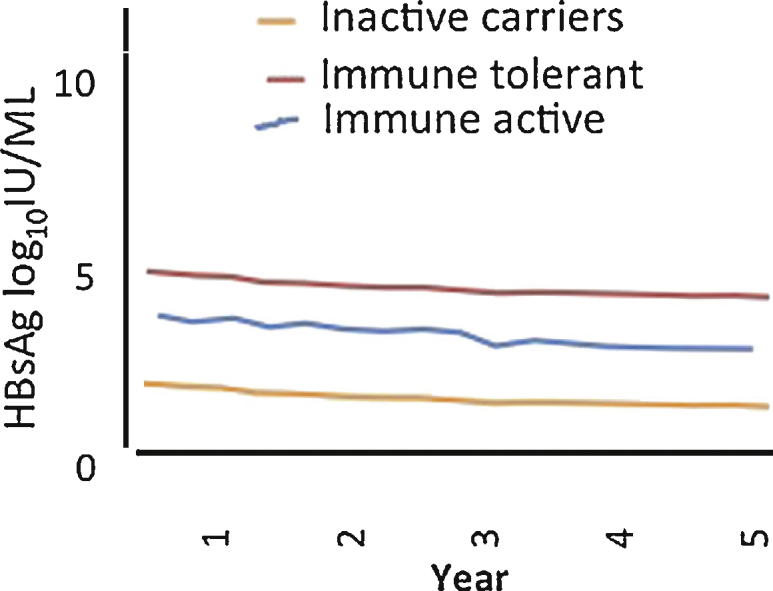
Median HBsAg levels during follow up in 20 patients.
Discussion
We studied prospectively a large cohort of well-defined, asymptomatic, treatment naïve genotype D & A patients. At times liver biochemistry and serological tests may fall short of accurately defining the exact phase of chronic HBV infection and liver histopathology assessment is essential. Likewise, prevalence of different severities of liver fibrosis in HBeAg positive patients is difficult to determine, as current guidelines do not recommend liver biopsy in patients with normal ALT especially in <40 years old. Initiation of antiviral therapy needs precise characterization of liver injury and fibrosis. Our present study showed serum HBsAg level could play an important role in identifying HBeAg-positive patients with significant fibrosis; potentially reduce the need for liver biopsy.
Consistent with the previous report,27 HBsAg levels were varied according to phase of infection with highest mean level found in immune tolerant subjects and lowest mean level observed in inactive carriers (5.22 – 0.48 and 3.05 – 0.75 respectively) in the current study. Interestingly Serum HBsAg levels showed a negative but poor association with age (r = −0.172, P < 0.05) in inactive carriers. This might suggest declining HBsAg level as age progress in inactive carriers. Modest correlation was noted between HBsAg level and HBV DNA levels in both HBeAg +ve and HBeAg −ve patients (r = 0.62, P < 0.001 and 0.45, P < 0.01 respectively). However, the correlation of HBsAg level and HBV DNA was poor or missing when analyzing the different phases of chronic HBV-infection separately. This dissociation of HBV DNA and HBsAg level in different HBV-phases may reflect a disconnection due to integration of HBV into the host genome that provides a separate template for the production of HBsAg,28 or the cytokine dependent modification of viral replication pathways.29, 30
We observed mean stage of fibrosis severity in HBeAg + ve patients was significantly higher compared with HBeAg negative patients and in patients with normal baseline ALT, 54.4% (16/30) and 24.8% (78/314) had moderate to advance (≥F2) fibrosis on liver biopsy in HBeAg + ve and HBeAg negative groups respectively. A previous report from same country one decade ago noted IDAHS (incidentally detected asymptomatic HBsAg + ve subjects) who were HBeAg + ve were more likely to have significant histological lesion than those who were anti-HBe positive. Later, same group also reported that intermediate elevated and persistently normal ALT patients histologic fibrosis stage ≥2 was found in 65.5% and 40.2% in HBeAg positive and 63.9% and 13.8% in HBeAg negative patients, respectively.8, 31 This could be due to the reason that some patients might have entered the inactive phase with already moderate to severe hepatic fibrosis before the observation period of current began and liver fibrosis might be in the process of slow regression or some patients might have prolonged period of normal ALT interspersed with flares of hepatitis.4
In our study strong negative correlation was found between HBsAg level and fibrosis severity in HBeAg positive patients. Severe hepatic fibrosis (F2–F4) was associated with significant mean lower HBsAg level in HBeAg positive cases. Similarly HBV DNA also showed negative correlation with fibrosis severity in HBeAg positive patients. The HBsAg level cut off 4.7 Log10 IU/ML predicted moderate to advance fibrosis with sensitivity of 92%, specificity of 85% and diagnostic accuracy of 89% and negative predictive value of 91%. Severe liver fibrosis had been found recently to be associated with lower serum HBsAg levels and HBV DNA in HBeAg positive patients infected with genotype B & C in a European study.24 In a report from Hong Kong inverse correlation of liver fibrosis with serum HBsAg levels but not with HBV DNA levels was reported.25 Diversity in patient ethnicity, HBV genotypes and selection criteria may account for this difference. Though our study displayed similar levels of HBsAg as noted in European cohort. Peignoux and colleagues got lower cut off of 3.85 log10 IU/ml in genotype B and C patients. The prevalent genotypes in our study were A and D. The cut-off proposed by Seto et al (4.4 log10 IU/ml) was derived in patients with an ALT <2 × ULN, whereas the cut-off noted in our study was not based on ALT stratification.
Summary
Both HBV DNA and HBsAg levels showed declining trend as liver disease advanced from immune tolerant to chronic hepatitis to cirrhosis in HBeAg positive patients. There was a strong inverse correlation between HBsAg levels and the severity of fibrosis. Single point baseline HBsAg levels were able to discriminate with high accuracy, patients with moderate to advance fibrosis from none or mild fibrosis.
Conflicts of interest
All authors have none to declare.
References
- 1.Lavanchy D. Hepatitis B virus epidemiology, disease burden, treatment, and current and emerging prevention and control measures. J Viral Hepat. 2004;11:97–107. doi: 10.1046/j.1365-2893.2003.00487.x. [DOI] [PubMed] [Google Scholar]
- 2.Liaw Y.F., Chu C.M. Hepatitis B virus infection. Lancet. 2009;373:582–592. doi: 10.1016/S0140-6736(09)60207-5. [DOI] [PubMed] [Google Scholar]
- 3.Datta S. An overview of molecular epidemiology of hepatitis B virus (HBV) in India. Virol J. 2008;5:156. doi: 10.1186/1743-422X-5-156. [DOI] [PMC free article] [PubMed] [Google Scholar]
- 4.McMahon B.J. The natural history of chronic hepatitis B virus infection. Hepatology. 2009;49:S45–S55. doi: 10.1002/hep.22898. [DOI] [PubMed] [Google Scholar]
- 5.Dixit V.K., Panda K., Babu A.V. Asymptomatic chronic hepatitis B virus infection in northern India. Indian J Gastroenterol. 2007;26:159–161. [PubMed] [Google Scholar]
- 6.Feld J.J., Heathcote E.J. Hepatitis B e antigen-positive chronic hepatitis B: natural history and treatment. Semin Liver Dis. 2006;26:116–129. doi: 10.1055/s-2006-939750. [DOI] [PubMed] [Google Scholar]
- 7.Seto W.K., Lai C.L., Ip P.P. A large population histology study showing the lack of association between ALT elevation and significant fibrosis in chronic hepatitis B. PLoS One. 2012;7:e32622. doi: 10.1371/journal.pone.0032622. [DOI] [PMC free article] [PubMed] [Google Scholar]
- 8.Kumar M., Sarin S.K., Hissar S. Virologic and histologic features of chronic hepatitis B virus-infected asymptomatic patients with persistently normal ALT. Gastroenterology. 2008;134:1376–1384. doi: 10.1053/j.gastro.2008.02.075. [DOI] [PubMed] [Google Scholar]
- 9.Liao B., Wang Z., Lin S. Significant fibrosis is not rare in Chinese chronic hepatitis B patients with persistent normal ALT. PLoS One. 2013;8:e78672. doi: 10.1371/journal.pone.0078672. [DOI] [PMC free article] [PubMed] [Google Scholar]
- 10.Srivastava M., Rungta S., Dixit V.K. Predictors of survival in hepatitis B virus related decompensated cirrhosis on tenofovir therapy: an Indian perspective. Antivir Res. 2013;100:300–305. doi: 10.1016/j.antiviral.2013.08.020. [DOI] [PubMed] [Google Scholar]
- 11.Sanai F.M., Babatin M.A., Bzeizi K.I. Accuracy of international guidelines for identifying significant fibrosis in hepatitis B e antigen–negative patients with chronic hepatitis. Clin Gastroenterol Hepatol. 2013;11:1493–1499. doi: 10.1016/j.cgh.2013.05.038. e2. [DOI] [PubMed] [Google Scholar]
- 12.EASL clinical practice guidelines: management of chronic hepatitis B virus infection. J Hepatol. 2012;57:167–185. doi: 10.1016/j.jhep.2012.02.010. [DOI] [PubMed] [Google Scholar]
- 13.Papatheodoridis G.V., Manolakopoulos S., Liaw Y.F. Follow-up and indications for liver biopsy in HBeAg-negative chronic hepatitis B virus infection with persistently normal ALT: a systematic review. J Hepatol. 2012;57:196–202. doi: 10.1016/j.jhep.2011.11.030. [DOI] [PubMed] [Google Scholar]
- 14.Iloeje U.H., Yang H.I., Su J. Predicting cirrhosis risk based on the level of circulating hepatitis B viral load. Gastroenterology. 2006;130:678–686. doi: 10.1053/j.gastro.2005.11.016. [DOI] [PubMed] [Google Scholar]
- 15.Wong G.L., Wong V.W., Choi P.C. Clinical factors associated with liver stiffness in hepatitis B e antigen-positive chronic hepatitis B patients. Clin Gastroenterol Hepatol. 2009;7:227–233. doi: 10.1016/j.cgh.2008.10.023. [DOI] [PubMed] [Google Scholar]
- 16.Fung J., Lai C.L., Seto W.K. The use of transient elastography in the management of chronic hepatitis B. Hepatol Int. 2011;22:868–875. doi: 10.1007/s12072-011-9288-5. [DOI] [PMC free article] [PubMed] [Google Scholar]
- 17.Chan H.L., Wong V.W., Tse A.M. Serum hepatitis B surface antigen quantitation can reflect hepatitis B virus in the liver and predict treatment response. Clin Gastroenterol Hepatol. 2007;5:1462–1468. doi: 10.1016/j.cgh.2007.09.005. [DOI] [PubMed] [Google Scholar]
- 18.Jaroszewicz J., Calle Serrano B., Wursthorn K. Hepatitis B surface antigen (HBsAg) levels in the natural history of hepatitis B virus (HBV)-infection: a European perspective. J Hepatol. 2010;52:514–522. doi: 10.1016/j.jhep.2010.01.014. [DOI] [PubMed] [Google Scholar]
- 19.Nguyen T., Thompson A.J., Bowden S. Hepatitis B surface antigen levels during the natural history of chronic hepatitis B: a perspective on Asia. J Hepatol. 2010;52:508–513. doi: 10.1016/j.jhep.2010.01.007. [DOI] [PubMed] [Google Scholar]
- 20.Brunetto M.R., Oliveri F., Colombatto P. Hepatitis B surface antigen serum levels help to distinguish active from inactive hepatitis B virus genotype D carriers. Gastroenterology. 2010;139:483–490. doi: 10.1053/j.gastro.2010.04.052. [DOI] [PubMed] [Google Scholar]
- 21.Brunetto M.R., Moriconi F., Bonino F. Hepatitis B virus surface antigen levels: a guide to sustained response to peginterferon alfa-2a in HBeAg-negative chronic hepatitis B. Hepatology. 2009;49:1141–1150. doi: 10.1002/hep.22760. [DOI] [PubMed] [Google Scholar]
- 22.Moucari R., Mackiewicz V., Lada O. Early serum HBsAg drop: a strong predictor of sustained virological response to pegylated interferon alfa-2a in HBeAg-negative patients. Hepatology. 2009;49:1151–1157. doi: 10.1002/hep.22744. [DOI] [PubMed] [Google Scholar]
- 23.Cheng P.N., Tsai H.W., Chiu Y.C. Clinical significance of serum HBsAg levels and association with liver histology in HBeAg positive chronic hepatitis B. J Clin Virol. 2013;57:323–330. doi: 10.1016/j.jcv.2013.04.012. [DOI] [PubMed] [Google Scholar]
- 24.Martinot-Peignoux M., Carvalho-Filho R., Lapalus M. Hepatitis B surface antigen serum level is associated with fibrosis severity in treatment-naive, e antigen-positive patients. J Hepatol. 2013;58:1089–1095. doi: 10.1016/j.jhep.2013.01.028. [DOI] [PubMed] [Google Scholar]
- 25.Seto W.K., Wong D.K., Fung J. High hepatitis B surface antigen levels predict insignificant fibrosis in hepatitis B e antigen positive chronic hepatitis B. PLoS One. 2012;7:e43087. doi: 10.1371/journal.pone.0043087. [DOI] [PMC free article] [PubMed] [Google Scholar]
- 26.Lok A.S., McMahon B.J. Chronic hepatitis B: update 2009. Hepatology. 2009;50:661–662. doi: 10.1002/hep.23190. [DOI] [PubMed] [Google Scholar]
- 27.Chan H.L., Wong V.W., Wong G.L. A longitudinal study on the natural history of serum hepatitis B surface antigen changes in chronic hepatitis B. Hepatology. 2010;52:1232–1241. doi: 10.1002/hep.23803. [DOI] [PubMed] [Google Scholar]
- 28.Bill C.A., Summers J. Genomic DNA double-strand breaks are targets for hepadnaviral DNA integration. Proc Natl Acad Sci U. S. A. 2004;101:11135–11140. doi: 10.1073/pnas.0403925101. [DOI] [PMC free article] [PubMed] [Google Scholar]
- 29.Thompson A., Locarnini S., Visvanathan K. The natural history and the staging of chronic hepatitis B: time for reevaluation of the virus-host relationship based on molecular virology and immunopathogenesis considerations? Gastroenterology. 2007;133:1031–1035. doi: 10.1053/j.gastro.2007.07.038. [DOI] [PubMed] [Google Scholar]
- 30.Srivastava M., Ranjan A., Choudhary J.K. Role of proinflammatory cytokines (interferon gamma) and anti-inflammatory cytokine (Interleukin-10) gene polymorphisms in chronic hepatitis B infection: an Indian scenario. J Interferon Cytokine Res. 2014;34:547–551. doi: 10.1089/jir.2013.0054. [DOI] [PMC free article] [PubMed] [Google Scholar]
- 31.Chandra R., Kapoor D., Agarwal S.R. Profile of asymptomatic chronic HBV infection in India. Indian J Med Res. 2002;116:50–57. [PubMed] [Google Scholar]