

Abstract
Background and Aim
Argininosuccinate synthase (ASS) is the rate-limiting enzyme in both the urea and the l-citrulline/nitric oxide (NO·) cycles regulating protein catabolism, ammonia levels and NO· generation (1-2). Since a proteomics analysis identified ASS and nitric oxide synthase-2 (NOS2) as co-induced in rat hepatocytes by chronic ethanol consumption, which also occurred in alcoholic liver disease (ALD) and in cirrhotic patients, we hypothesized that ASS could play a role in ethanol binge and chronic ethanol-induced liver damage.
Methods
To investigate the contribution of ASS to the pathophysiology of ALD, wild-type (WT) and Ass+/− mice (Ass−/− are lethal due to hyperammonemia) were exposed to an ethanol binge or to chronic ethanol drinking.
Results
Compared with WT, Ass+/− mice given an ethanol binge exhibited decreased steatosis, lower NOS2 induction and less 3-nitrotyrosine (3-NT) protein residues, indicating that reducing nitrosative stress via the l-citrulline/NO· pathway plays a significant role in preventing liver damage. However, chronic ethanol treated Ass+/− mice displayed enhanced liver injury compared with WT mice. This was due to hyperammonemia, lower phosphorylated AMP-activated protein kinase (pAMPKα) to total AMPKα ratio, decreased sirtuin (Sirt-1) and peroxisomal proliferator-activated receptor coactivator-1α (Pgc1α) mRNAs, lower fatty acid β-oxidation due to down-regulation of carnitine palmitoyl transferase-II (CPT-II), decreased antioxidant defense and elevated lipid peroxidation end-products in spite of comparable nitrosative stress but likely reduced NOS3.
Conclusion
Partial Ass ablation protects only in acute ethanol-induced liver injury by decreasing nitrosative stress but not in a more chronic scenario where oxidative stress and impaired fatty acid β-oxidation are key events.
Keywords: Steatosis, oxidative stress, urea cycle, l-citrulline/NO· cycle
ALD is one of the leading causes of liver disease in the United States and results from ethanol binge drinking, chronic ethanol consumption or both and progresses to fibrosis, cirrhosis and ultimately hepatocellular carcinoma in many individuals. Steatosis and ethanol consumption are considered key hits for the development of ALD (3-4). Mitochondrial damage, up-regulation of NOS2 and generation of reactive oxygen and nitrogen species (ROS and RNS) condition cell viability, inflammation and fat deposition in ALD. Thus, understanding the molecular mechanisms of pathological NO· production by NOS2 is of great relevance to prevent ethanol hepatotoxicity.
NOS2 catalyzes the NADPH-dependent oxygenation of l-arginine to NO· and l-citrulline (5). While the Nos2 gene lies quiescent under physiological conditions; cytokines, ROS, growth factors and most importantly ethanol, initiate and sustain its activation (2). Overexpressing NOS2 mediates mitochondrial damage as it occurs in ALD (6). Previous work has shown that NOS2 is required for ALD due to generation of NO·-derived pro-oxidants (7-8). Indeed, ethanol hepatotoxicity was blunted in Nos2−/− mice as well as by a NOS2 inhibitor in WT mice (7).
The urea cycle is a metabolic pathway in which ammonia is converted to urea in the liver. The urea cycle enzymes along with the l-citrulline/NO· cycle catalyze de novo biosynthesis of l-arginine, which also serves as a substrate for NO· synthesis by NOS2. Five reactions occur within a functional complex or metabolon between the mitochondria and the cytosol (Supplementary Figure 1, green line):
| 2ATP + HCO3− + NH4+ → Carbamoyl phosphate + 2ADP + Pi | (Carbamyl phosphate synthase-1, CPS1) |
| Carbamoyl phosphate + Ornithine → Citrulline + Pi | (Ornithine transcarbamylase, OTC) |
| Citrulline + Aspartate + ATP → Argininosuccinate + AMP + PPi | (ASS) |
| Argininosuccinate → Arginine + Fumarate | (Argininosuccinate lyase, ASL) |
| Arginine + H2O → Ornithine + Urea | (Arginase-1, ARG1) |
Although ASS and ASL are usually considered in the context of their contribution to the urea cycle, in conjunction with NOS2, they endow cells with a salvage pathway, the l-citrulline/NO· cycle (Supplementary Figure 1, red line) that continually generates l-arginine from l-citrulline for sustained NO· production. Physiological levels of l-arginine do not suffice to saturate NOS2 and changes in l-arginine bioavailability contribute to regulate NO· production.
Patients with type-I citrullinemia -an autosomal recessive urea cycle disorder due to Ass deficiency- develop hyperammonemia due to inefficient protein catabolism (9-10). Genetic disorders in the urea cycle cause steatosis and amino acid imbalance; however, the mechanism for these events is unknown. Hyperammonemia, changes in the concentration of amino acids and a decline in urea synthesis occur in ALD patients (11-12). The role of the l-citrulline/NO· cycle in the liver, the potential role of ASS as an enzymatic ‘switch’ to provide substrate for NOS2-induced activity and the subsequent excess of NO· biosynthesis in ALD is still to be defined. A detailed analysis of the mechanisms leading to increased nitrosative stress appears timely to advance our understanding of acute and chronic ethanol-induced liver injury.
Using a combination of proteomics and a systems biology approach to uncover mitochondrial and cytosolic proteins involved in ALD that could impact NO· synthesis, we identified ASS as up-regulated in rat hepatocytes by chronic ethanol feeding. Furthermore, livers from patients with ALD or with stage-3 HCV-induced cirrhosis showed correlation between the increase in ASS and NOS2, suggesting a potential link between ASS, NO· generation by NOS2 and ALD. ASS, as an enzyme shared by the urea and the l-citrulline/NO· cycles, could have a rate-limiting role for high-output NO· synthesis via NOS2. Virtually nothing is known on how acute or chronic ethanol consumption modulate ASS expression and how the l-arginine recycling pathway may affect NO· generation and liver injury under acute and chronic ethanol ingestion. We hypothesized that up-regulation of ASS by alcohol could increase NO· synthesis by NOS2, thus contributing to the pathophysiology of ALD.
MATERIALS AND METHODS
Please see Supplementary Materials and Methods
RESULTS
In vivo model of ethanol feeding for the identification of ASS up-regulation
Our initial goal focused on identifying mitochondrial and/or cytosolic proteins up-regulated by ethanol to dissect how they could activate key metabolic pathways contributing to alcohol-induced liver injury. The in vivo model of ethanol feeding used in our proteomics study was rats fed the control or the ethanol Lieber-DeCarli diets for 32 wks (13).
Livers showed minimal steatosis in control rats, while rats fed ethanol showed periportal and pericentral micro- and macrovesicular steatosis (Figure 1A). Serum ammonia increased by 50% (Figure 1B, left) while urea decreased by 20% (Figure 1B, right) in the ethanol group compared with the control group. Ultrastructural studies using transmission electron microscopy revealed normal architecture in control livers with well-stacked endoplasmic reticulum (ER), normal mitochondria and minimal microvesicular steatosis (Figure 1C, left). Livers from ethanol-fed rats showed dilated ER, large number of electron-dense mitochondria, abundant micro- and macrovesicular steatosis and disrupted cellular membranes (Figure 1C, right). All these parameters were good indicators of mitochondrial and ER impaired function, which play a role in the development of ALD.
Figure 1. Chronic effect of the control and ethanol Lieber-DeCarli diets in rats and identification of ASS up-regulation by ethanol.

Liver H&E staining from rats fed the control diet showed minimal steatosis (A, left), while rats fed the ethanol diet showed periportal and pericentral micro- ( ) and macrovesicular (
 ) steatosis (A, right. PV: portal vein). Serum ammonia and urea. Results are average values ± SEM. n=10/group; *p<0.05 and ***p<0.001 for chronic ethanol vs control (B). Transmission electron microscopy showing ultrastructural features (micro- (
 ) and macrovesicular steatosis (
 ),
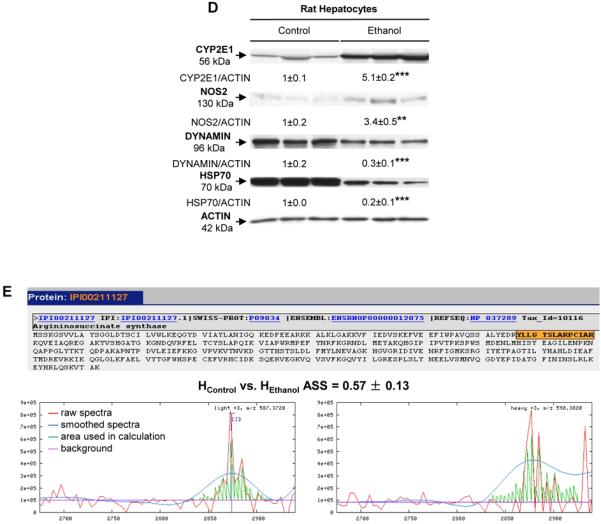
),  ER: endoplasmic reticulum, L: lysosome, M: mitochondria, N: nucleus). Livers from control rats show normal mitochondria, minimal microvesicular steatosis and stacked ER (left), while livers from ethanol-fed rats show greater micro- and macrovesicular steatosis, disrupted ER and dilated mitochondria (right) (C). Western blot analysis for CYP2E1, NOS2, DYNAMIN, HSP70 and ACTIN in HControl and HEthanol. The quantification of the intensity of the signals corrected by that of ACTIN is indicated under the blots. Results are average values ± SEM. n=3/group; **p<0.01 and ***p<0.001 for HEthanol
vs HControl
(D). Tryptic peptides of ASS were identified by mass spectrometry as highlighted in orange in the sequence. The calculation of their abundance ratios is shown in the chromatograms reconstructed from LC/MS-MS data. Red lines are raw spectra, blue lines are smoothed spectra, green lines are the area under the curve used in the ratio calculation and horizontal cyan lines are the background in the spectra. n=5/group (E).
ER: endoplasmic reticulum, L: lysosome, M: mitochondria, N: nucleus). Livers from control rats show normal mitochondria, minimal microvesicular steatosis and stacked ER (left), while livers from ethanol-fed rats show greater micro- and macrovesicular steatosis, disrupted ER and dilated mitochondria (right) (C). Western blot analysis for CYP2E1, NOS2, DYNAMIN, HSP70 and ACTIN in HControl and HEthanol. The quantification of the intensity of the signals corrected by that of ACTIN is indicated under the blots. Results are average values ± SEM. n=3/group; **p<0.01 and ***p<0.001 for HEthanol
vs HControl
(D). Tryptic peptides of ASS were identified by mass spectrometry as highlighted in orange in the sequence. The calculation of their abundance ratios is shown in the chromatograms reconstructed from LC/MS-MS data. Red lines are raw spectra, blue lines are smoothed spectra, green lines are the area under the curve used in the ratio calculation and horizontal cyan lines are the background in the spectra. n=5/group (E).
Proteomics analysis identified ASS as up-regulated by ethanol
To identify proteins participating in ethanol hepatotoxicity and their link with signaling pathways involved in ALD, particularly NO· production, next we used a combination of proteomics along with a systems biology approach. To this end, first, we used the mass spectrometry-based ICAT proteomics technique to identify differentially expressed proteins in hepatocytes from ethanol-fed rats (HEthanol) compared with hepatocytes from control rats (HControl). Second, to dissect the differentially regulated proteins in the context of protein interaction networks, we used the Institute for Systems Biology Trans-Proteomics Pipeline (Seattle) and the Gaggle (14) computer platform. Lastly, we narrowed down our search by focusing on the sub-proteome of mitochondrial and/or cytosolic proteins of potential significance for the development of ALD.
The isotope-coded affinity tag (ICAT) labeling methodology and the proteomics analysis identified multiple differentially expressed proteins in HControl vs HEthanol with probability scores >0.5 (<5% error rate). Among them, there were several well-known alcohol regulated proteins such as cytochrome p450 2E1 (CYP2E1) and NOS2, which were validated by Western blot analysis, while other proteins, such as DYNAMIN and HSP70 decreased by ethanol (Figure 1D). The acquired dataset was further analyzed on The Gene Ontology Categories, Kyoto Encyclopedia of Genes and Genomes Pathways and Protein Interaction Networks using the Gaggle platform (14). The systems-based quantitative proteomics analysis led us to focus on the urea and the l-citrulline/NO· cycles as likely impaired under ethanol consumption because a potential link with NO· production could be established. ASS, a novel ethanol-specific induced protein, was identified in the proteomics analysis (Figure 1E). Hence, we explicitly selected it as a protein of interest in the follow-up analysis since it could play a role in ALD by regulating de novo biosynthesis of l-arginine from l-citrulline for high-output NO· generation by NOS2.
Next, ASS expression was validated by Western blot analysis in hepatocytes. We found a 4.2-fold increase in HEthanol vs HControl (Figure 2A). To better understand the potential physiological role of the induction of ASS, other enzymes from the urea cycle and/or the l-citrulline/NO· cycle were studied. Western blot analysis showed that ethanol induced ASL (2.2-fold), ARG1 (2.3-fold), NOS2 (2.8-fold) and 3-NT (4.1-fold), likely because of NOS2 induction and overproduction of NO· leading to nitrosative stress, while a decrease was observed in hepatocyte arginine residues (Figure 2A).
Figure 2. Chronic ethanol feeding induced the expression of enzymes from the urea and the l-citrulline/NO· cycles.
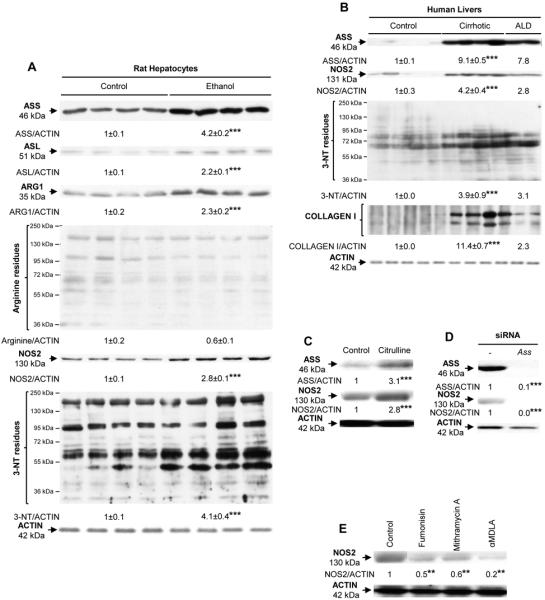
The expression of ASS, ASL, ARG1, arginine residues, NOS2, 3-NT residues and ACTIN in HControl and HEthanol was analyzed by Western blot. n=4 (A). Human liver explants from healthy (n=5), stage-3 HCV-cirrhotic (n=4) and ALD (n=2) patients were evaluated for the expression of ASS, NOS2, 3-NT residues, COLLAGEN-I and ACTIN by Western blot (B). Rat hepatocytes were either treated with 5 μM citrulline, an inducer of ASS, transfected with control siRNA or Ass siRNA or incubated with inhibitors of ASS such as 15 μM fumonisin B1, 10 μM mithramycin A and 50 μM α-MDLA. Experiments were repeated three times and a representative blot for NOS2 and ASS is shown (C-E). The quantification of the intensity of the signal corrected by that of ACTIN is indicated under all blots. ***p<0.001 and **p<0.01 for treated or diseased vs control.
ALD and cirrhotic patients showed induction of ASS and NOS2
To determine whether the results obtained in primary rat HControl and HEthanol reflected events similar to those taking place in human liver disease, we used liver samples from healthy, cirrhotic and ALD patients. ASS, NOS2, 3-NT residues and collagen-I increased in cirrhotic and ALD compared with control individuals (Figure 2B). ASL and ARG1 were also elevated in cirrhotic patients (Supplementary Figure 3). These results in humans strengthen the possible link between ASS, the potential downstream events (i.e. regulation of NO· production by NOS2), ALD and perhaps cirrhosis.
ASS modulated NOS2 expression
To establish a connection between ASS and NOS2, cells were treated with inhibitors or substrates of ASS. Treatment of HControl with 5 μM citrulline for 24 h -a substrate and inducer of ASS- elevated the expression of ASS by 3.1-fold and of NOS2 by 2.8-fold (Figure 2C). Moreover, transfecting HControl with Ass siRNA decreased both ASS and NOS2 proteins (Figure 2D). Likewise, inhibiting ASS with either 15 μM fumonisin B1, 10 μM mithramycin A or 50 μM α-methyl-d,l-aspartate (α-MDLA) for 24 h -known inhibitors of ASS-, reduced NOS2 expression in HControl (Figure 2E). Thus, modulation of ASS expression regulates NOS2 activity and ultimately NO· production, a mechanism expected to participate in the pathophysiology of ALD.
Binge and chronic ethanol feeding and the urea cycle enzymes
To determine the effects of Ass deficiency in binge and chronic ethanol drinking, mice were either gavaged twice with saline solution or ethanol or were fed with the control or ethanol Lieber-DeCarli diets for 7 wks. Western blot analysis showed a 3-fold induction in ASS protein in both ethanol binged and chronic ethanol-fed WT mice (Figure 3A) yet there was only a slight increase in Ass+/− mice under chronic ethanol consumption (Figure 3B). Chronic ethanol feeding decreased CPS1 expression by ~20% in both WT and Ass+/− mice (Figure 3B). The rest of the enzymes in the urea cycle remained similar under either binge or chronic ethanol feeding (Figure 3A-3B).
Figure 3. Binge and chronic ethanol consumption impair the urea cycle more in Ass+/− than in WT mice.

Western blot analysis for the urea cycle enzymes. The quantification of each signal corrected by that of CALNEXIN is shown for the ethanol binge model (A) and for the chronic ethanol feeding model (B). Liver and serum ammonia and urea (C-E). Results are average values ± SEM. n=8/group; *p<0.05 and **p<0.01 for binge or chronic ethanol vs control. •p<0.05 and ••p<0.01 for Ass+/− vs WT.
Since defects in the urea cycle lead to hyperammonemia and hepatic encephalopathy (7), next we analyzed ammonia and urea levels. Ass+/− mice showed higher liver ammonia but there were no changes in liver urea in both models (Figure 3C-3D). Chronic ethanol treatment increased serum ammonia (not statistically significant) (Figure 3E, left) and reduced serum urea (Figure 3E, right). Thus, these defects reflect functional impairment of the urea cycle by ethanol, which was more noticeable in Ass+/− than in WT mice, hence contributing to liver damage.
Ass deficiency reduced hepatic steatosis in the ethanol binge model but exacerbated it in the chronic ethanol-feeding model
The pathology scoring from hematoxylin and eosin (H&E) stained slides indicated minimal necrosis and inflammation in all mice but revealed the presence of lipid droplets (micro- and macrovesicular steatosis) in ethanol binged WT but not in Ass+/− mice (Figure 4A). This was further quantified by the steatosis grade (Figure 4B) and by the hepatic triglycerides (Figure 4C). Alanine aminotransferase (ALT) activity increased by 2-fold only in ethanol binged WT mice (Figure 4D). In contrast, chronic ethanol feeding caused greater inflammation, necrosis and ductular reaction in Ass+/− than in WT mice (Figure 4E-4F). The steatosis grade (Figure 4F), oil red O staining and morphometry analysis (Supplementary Figure 4A-4B) demonstrated more neutral fat in chronic ethanol-fed Ass+/− than in WT mice, suggesting more liver injury by partial Ass ablation in the chronic ethanol feeding model.
Figure 4. Ass deficiency protects from liver injury in binged mice but exacerbates it in chronic ethanol fed mice.


H&E staining showed increased micro- ( ) and macrovesicular (
 ) steatosis in binged WT compared with Ass+/− mice (A). Steatosis grade (B), liver triglycerides (C) and ALT activity (D). The ethanol Lieber-DeCarli diet caused more inflammation (
 ), micro- (
 ) and macrovesicular (
 ) steatosis in Ass+/− than in WT mice as shown by the H&E staining (E). The scores for inflammation, necrosis, ductular reaction and steatosis are shown in (F). PV: portal vein. Results are average values ± SEM. n=8/group; *p<0.05 and ***p<0.001 for binge or chronic ethanol vs control; •p<0.05 and ••p<0.01 for Ass+/− vs WT.
Ass deficiency reduced nitrosative stress in the ethanol binge model but not in the chronic ethanol-feeding model
In order to investigate the effect of Ass deficiency on NOS2 and NO· generation, immunohistochemistry (IHC) was performed. There was more intense staining for NOS2 (5-fold) and 3-NT residues (10-fold) -the footprint for nitrosative stress- in WT given an ethanol binge compared with Ass+/− mice, which was quantified by morphometry analysis (Figure 5A-5C). Chronic ethanol feeding elevated NOS2 (2-fold, not statistically significant) and 3-NT protein adducts (3-fold) both in WT and in Ass+/− mice (Figure 5D-5F). Western blot analysis showed a 4- and a 2-fold increase in NOS2 in binged WT and Ass+/− mice, respectively (Supplementary Figure 5A, left), while there was only a 2-fold increase in NOS2 expression in both genotypes after chronic ethanol feeding. NOS1 and NOS3 expression remained similar with binge or chronic ethanol feeding in both WT and Ass+/− mice (Supplementary Figure 5A). However, serum nitrites plus nitrates, considered surrogate markers of NOS3 activity, remained similar in the binge model (Supplementary Figure 5B, left), but were lower in chronic ethanol-fed Ass+/− than in WT mice (Supplementary Figure 5B, right).
Figure 5. Ass+/− mice are protected from nitrosative stress induced by an ethanol binge.


IHC for NOS2 protein ( ) (A) and 3-NT residues (
 ) (B) in binged WT and Ass+/− mice. Morphometry analysis for NOS2 and 3-NT staining (C). IHC and morphometry analysis for NOS2 and 3-NT in chronic ethanol-fed WT and Ass+/− mice (D-F). CV: central vein. Results are average values ± SEM. n=8/group; *p<0.05 and **p<0.01 for binge or chronic ethanol vs control; •p<0.05 for Ass+/− vs WT.
ROS -key players in ethanol toxicity- are generated among others by microsomal CYP2E1, which is induced by ethanol itself (15-16). Because alcohol intake stabilizes CYP2E1 against degradation contributing to liver injury, we examined CYP2E1 expression. Western blot analysis showed similar CYP2E1 induction by ethanol binge (Supplementary Figure 6A, left) and by chronic ethanol feeding (Supplementary Figure 6A, right) in WT and in Ass+/− mice. Lastly, IHC for 4-HNE -a lipid peroxidation-end product- was similarly increased by the ethanol binge in both groups of mice (not-statistically significant) (Supplementary Figure 6B); however, the increase was much higher in chronically ethanol-fed Ass+/− than in WT mice (Supplementary Figure 6C).
Ass+/− mice showed lower GSH levels than WT mice after chronic alcohol feeding
Glutathione (GSH) is a key endogenous antioxidant participating in detoxification reactions (17). WT and Ass+/− mice showed similar basal GSH while binge drinking reduced GSH level by 50% in both WT and Ass+/− mice (Supplementary Figure 7). Total and mitochondrial GSH were higher in Ass+/− than in WT mice in the control group chronically fed with high fat diet (Figure 6A). This may have served as a protective mechanism in the ethanol binge model in addition to decreased NO· generation due to impairment of the l-citrulline/NO· cycle. In the chronic ethanol-feeding model; however, both total and mitochondrial GSH decreased only in Ass+/− mice, hence promoting liver injury (Figure 6A). A 20% increase in oxidized GSH occurred in the ethanol-fed Ass+/− compared with WT mice (not shown).
Figure 6. Chronic ethanol feeding reduced the antioxidant defense in Ass+/− mice.

Total and mitochondrial GSH levels in WT and Ass+/− mice chronically fed ethanol (A). Western blot analysis for GCLC and GCLM in WT and Ass+/− mice chronically fed ethanol. The quantification of the intensity of the signals corrected by that of ACTIN is indicated under the blots (B). Catalase (C), GT (D) and GR (E) activities. Results are average values ± SEM. n=8/group; *p<0.05, **p<0.01 and ***p<0.001 for chronic ethanol vs control; •p<0.05 and ••p<0.05 for Ass+/− vs WT.
The decrease in GSH possibly occurred due to a reduction in glutamate-cysteine ligase (GCLC and GCLM), the rate-limiting enzymes for GSH synthesis (Figure 6B). Glutathione-S-transferase (GT) catalyzes the conjugation of GSH to various substrates for detoxifying endogenous compounds. Chronic ethanol feeding induced GT by 3-fold in WT mice and by 2-fold in Ass+/− mice. Furthermore, there was a 20% decrease in glutathione reductase (GR) and catalase activities in the ethanol-fed Ass+/− compared to WT mice (Figure 6C-6E). Lastly, since the urea cycle could also condition amino acid availability for GSH synthesis (i.e. methionine, glutamate and cysteine), we analyzed amino acid content by HPLC. Chronic ethanol feeding increased glutamate and cysteine more in Ass+/− mice than in WT mice, likely affecting GSH synthesis (Supplementary Table 1).
Chronic but not binge ethanol drinking induced more steatosis in Ass+/− than in WT mice
Since the data suggested that Ass+/− developed less steatosis than WT mice after ethanol binge drinking and the opposite occurred in the chronic ethanol model; hence, we studied the expression of key proteins involved in lipolysis and lipogenesis. Peroxisome proliferator-activated receptor-γ (PPARγ) and sterol regulatory element-binding protein-1 (SREBP-1) are lipogenic transcription factors, whereas PPARα regulates lipolysis (18-19). Western blot analysis demonstrated greater reduction in PPARγ and SREBP1 after the ethanol binge in Ass+/− than in WT mice; however, PPARα showed similar expression in both groups (Figure 7A, left). Hence, lipogenesis was impaired in Ass+/− mice after an ethanol binge. In contrast, PPARα, PPARγ and SREBP-1 did not vary after chronic ethanol feeding in WT and Ass+/− mice (Figure 7A, right).
Figure 7. Lipogenesis and lipolysis regulators in the binge and the chronic ethanol feeding models.

Western blot analysis for PPARγ, SREBP-1, PPARα, pAMPKα, AMPKα1, AMPKα2, ACTIN and CALNEXIN in both models in WT and Ass+/− mice (A). Western blot analysis for FAS, ACC2 and CALNEXIN in both models in WT and Ass+/− mice (B). Sirt-1 (C), Pgc1-α (D) and Cpt-1 (E) mRNAs in chronic ethanol-fed WT and Ass+/− mice. Western blot analysis for CPT-II and CALNEXIN in chronically ethanol-fed WT than in Ass+/− mice (F). The quantification of the intensity of all signals corrected by that of ACTIN or CALNEXIN is indicated under the blots. Results are average values ± SEM. n=8/group; *p<0.05 and ***p<0.001 for binge or chronic ethanol vs control; •p<0.05 and ••p<0.01 for Ass+/− vs WT.
AMPK regulates cellular energy homeostasis and promotes fatty acid oxidation by inactivating acetyl-CoA carboxylase (ACC) (20), the rate-limiting enzyme for fatty acid synthesis and a potent inhibitor of CPT1. Ass+/− mice showed lower basal AMPKα than WT mice. While no major difference was detected in ethanol binge drinking (not shown), the basal ratio of pAMPKα to total AMPKα was greatly reduced in Ass+/− mice compared with WT and also by chronic ethanol exposure in both genotypes (Figure 7A, right). Fatty acid synthase (FAS) and ACC2, which provide malonyl-CoA for fatty acid biosynthesis, were analyzed. Binge drinking altered neither FAS nor ACC2 expression (Figure 7B, left), while chronic ethanol feeding reduced FAS in both WT and Ass+/− mice (Figure 7B, right). Fatty acid export into the plasma was also similar in both ethanol-fed groups (not shown).
SIRT-1 inactivates SREBP-1 via deacetylation (19). While no differences were observed in the binge model (not shown), chronic ethanol feeding increased Sirt-1 (Figure 7C) and Pgc-1α (Figure 7D) mRNAs more in WT than in Ass+/− mice and no differences were observed in Acc mRNA (not shown).
Ass+/− mice had higher CPT-I activity than WT mice
CPT-I is the rate-limiting enzyme in fatty acid catabolism for the conversion of long-chain fatty acids into long-chain acylcarnitines whereas CPT-II is responsible for the release of long-chain fatty acids from carnitine inside the mitochondrial matrix for fatty acid β-oxidation (21). Although no changes were observed by ethanol binge drinking (not shown), Cpt1 mRNA (Figure 7E) and CPT-II protein (Figure 7F) were induced in chronic ethanol feeding in both WT and Ass+/− mice. The ratio of free carnitine (C0) to long-chain acylcarnitine (C16+C18) is an indicator of CPT-I activity. Ass+/− mice had higher CPT-I activity (lower C0/C16+C18 ratio) (control group: 32.7±12.2; ethanol group: 31.2±5.8) compared with WT mice (control group: 52.8±15.6; ethanol group: 56.0±19.7) but chronic ethanol feeding did not affect CPT-I activity (p<0.05 for Ass+/− vs WT). However, CPT-II protein expression was significantly increased by ethanol feeding in WT mice compared with Ass+/− mice (Figure 7F); hence, β-oxidation was impaired in chronic ethanol fed Ass+/− mice. Thus, although Ass+/− mice may have efficient fatty acid transport into the mitochondria for β-oxidation, the decrease in CPT-II under chronic ethanol drinking impaired the efficiency of this pathway, leading to fat accumulation.
DISCUSSION
Up-regulation of NOS2 along with generation of RNS plays a major role in alcohol-induced liver injury (22). The overwhelming research on the production of NO· has been focused on the different isoforms of NOS. However, a renewal of interest in the regulation of ASS has recently emerged as a result of its possible rate-limiting role for high-output NO· synthesis (2). Using an integrated proteomics and systems biology approach we identified NOS2 along with ASS -the rate-limiting enzyme in the urea and l-citrulline/NO· cycles- as significantly co-induced under chronic ethanol consumption in rodents, which was also validated in human samples.
In addition, ASS, ASL, ARG1 and 3-NT residues were up-regulated in both hepatocytes isolated from chronic ethanol-fed rats and in ALD and cirrhotic patients. Moreover, NOS2 was regulated by altering ASS expression in hepatocytes. Treatment with l-citrulline, an inducer of ASS, increased the expression of both ASS and NOS2, while downregulation of ASS by siRNA or other inhibitors significantly reduced NOS2 expression. Since the urea cycle is key for hepatic amino acid content, this result suggested that ASS may control NOS2 by modulating substrate availability in the l-citrulline/NO· cycle. Thus, the correlation between both enzymes and the induction of nitrosative stress prompted us to study the contribution of ASS to the pathogenesis ALD using in vivo models of ethanol binge and chronic ethanol drinking.
Although we initially speculated that partial deletion of Ass would confer protection from liver injury under both ethanol-drinking schemes, the in vivo data suggested that protection occurred only under an ethanol binge. This difference was likely due to a lack of ASS induction in the acute versus the chronic model of ethanol drinking and to effects on oxidative stress, lipid peroxidation, fatty acid β-oxidation and perhaps NOS3 impairment. Therefore, ASS may have distinctive roles depending on the stage of ALD.
WT mice showed up-regulation of ASS in the binge and the chronic ethanol feeding models whereas the rest of the urea cycle enzymes remained similar. The increased ASS expression in WT was consistent with the increased ASS expression in human cirrhotic and alcoholic liver samples. While Ass+/− mice displayed no significant changes in any enzyme in the binge model; however, there was a decrease in CPS1 under chronic alcohol feeding, which could lead to hyperammonemia and thus to liver injury. Similar blood alcohol levels were found in WT and Ass+/− mice indicating that alcohol metabolism was not affected by Ass deficiency (not shown). Although ASS increased in cirrhotic and alcoholic patients, partial Ass ablation exacerbated chronic alcohol induced liver injury in mice. This finding suggested that elevated ASS expression during liver injury could have a protecting role.
Partial Ass ablation protected from ethanol binge-induced liver injury since Ass+/− mice developed less nitrosative stress and steatosis than WT mice. This was likely due to lower NOS2, limited NO· generation and 3-NT protein adduct formation due to lack of ASS induction by the ethanol binge. Although all three isoforms of NOS are expressed in the liver, it is likely that the extent of nitrosative stress was merely due to NOS2 derived NO· since the expression of NOS1 and NOS3 and serum nitrates plus nitrites were not altered by binge drinking. The expression of PPARγ and SREBP-1, two lipogenic transcription factors, was down-regulated by ethanol binge in Ass+/− compared with WT mice, whereas PPARα, a lipolytic factor, was unaffected; thus, preventing fat deposition.
Conversely, in the chronic ethanol-feeding model, Ass+/− mice showed greater hepatic inflammation, necrosis, ductular reaction and steatosis than WT mice. This was accompanied by high ammonia in liver and serum and by low urea. Ammonia is known for inhibiting fatty acid oxidation; thus, promoting steatosis. Ethanol oxidation increases the ratio of NADH/NAD+ reducing urea synthesis by inhibiting the oxidative deamination of amino acids that precede the urea cycle (23-24). Increases in NADH also disrupt dehydrogenase-related reactions in the mitochondria thereby suppressing fatty acid β-oxidation (25). Importantly, alcohol also decreases ATP -which is required for the urea cycle (11, 26)- and ATP was significantly decreased in Ass+/− mice chronically fed ethanol (9.7±2.1 vs. 5.7±1.2 nmol/mg protein, p<0.05). Although the expression of the urea cycle enzymes ASL, OTC and ARG1 did not change in chronic ethanol feeding, reduced ATP levels may impair the urea cycle and lead to hyperammonia. It has been shown that hyperammonemia and reduction in urea synthesis occurs both in ALD and in cirrhotic patients (27-29). Despite comparable nitrosative stress in the ethanol-fed mice and the perhaps metabolic induction of ASS in Ass+/− mice, the urea and l-citrulline/NO· cycles remained somewhat dysfunctional as it was also demonstrated by the concentration of amino acids: increased glutamate and arginine and decreased ornithine.
NOS2 expression and 3-NT adducts were comparable between chronic ethanol fed WT and Ass+/− mice; however, serum nitrates plus nitrites decreased in Ass+/− mice but not in WT mice. This could suggest that impaired urea and citrulline/NO· cycles during chronic ethanol feeding may condition NOS3 activity to enhance liver injury as previous work has demonstrated that inhibition of NOS3 enhances alcohol-induced liver injury (7, 30). Although there was no difference in CYP2E1 expression, higher lipid peroxidation occurred in chronic ethanol-fed Ass+/− than in WT mice, suggesting significant oxidative stress-mediated liver injury.
Impairment in cysteine metabolism is associated with fatty liver. Chronic ethanol consumption increased cysteine in Ass+/− compared with WT mice. Furthermore, there was down-regulation in the antioxidant defense in chronically ethanol-fed Ass+/− mice, since total and mitochondrial GSH, GCLC, GCLM, GT, GR and catalase decreased compared with WT mice. In addition, the appearance of LPO-end products likely contributed to liver damage in Ass+/− mice in the chronic ethanol-feeding model.
While no major differences occurred in the lipolysis and lipogenesis factors under chronic ethanol consumption, fatty acid transport into the mitochondria for β-oxidation increased in Ass+/− fed the control diet compared with WT mice, since Ass+/− mice showed higher CPT-I activity (lower C0/C16+C18 ratio). Nevertheless, chronic ethanol feeding impaired β-oxidation because CPT-II, which transports long-chain acylcarnitine to the mitochondrial matrix for production of acetyl-CoA for β-oxidation, decreased in Ass+/− compared with WT mice. The decrease in ATP, Sirt-1 and Pgc-1α mRNAs along with the ratio of pAMPKα to total AMPKα likely facilitated fat deposition. It is also possible that generation of free radicals following ethanol exposure could modify key enzymes for fatty acid β-oxidation (e.g. acyl-CoA dehydrogenase, enoyl-CoA hydratase and β-hydroxy-acyl-CoA dehydrogenase) leading to their inactivation and thus to fat accumulation (31).
Supplementary Material
Acknowledgments
Grant support: US Public Health service grants 5R01 AA017733, 5R01 AA017733-01S1, SP20 AA017067, 5P20 AA017067-01S1 and 5P20 AA017067-03S1 from the National Institute on Alcohol Abuse and Alcoholism (N.N.).
Non-standard abbreviations
- 3-NT
3-nitrotyrosine
- ACC
acetyl-CoA carboxylase
- ALD
alcoholic liver disease
- ALT
alanine aminotransferase
- AMPK
AMP-activated protein kinase
- ARG1
arginase1
- ASL
argininosuccinate lyase
- ASS
argininosuccinate synthase
- CPS
carbamyl phosphate synthase
- CPT
Carnitine palmitoyl transferase
- CYP2E1
cytochrome P450 2E1
- ER
endoplasmic reticulum
- FAS
fatty acid synthase
- GCLC
glutamate-cysteine ligase catalytic subunit
- GCLM
glutamate-cysteine ligase modifier subunit
- GSH
glutathione
- GR
glutathione reductase
- GT
glutathione-S-transferase
- H&E
hematoxylin and eosin
- HControl
hepatocytes from rats fed the control Lieber-DeCarli diet
- HEthanol
hepatocytes from rats fed the ethanol Lieber-DeCarli diet
- ICAT
isotope-coded affinity tag
- IHC
immunohistochemistry
- NO·
nitric oxide
- NOS2
nitric oxide synthase-2
- OTC
ornithine transcarbamylase
- PGC
peroxisomal proliferator-activated receptor coactivator
- PPAR
peroxisome proliferator-activated receptor
- RNS
reactive nitrogen species
- ROS
reactive oxygen species
- SIRT
sirtuin
- SREBP
sterol regulatory element-binding protein
- αMDLA
α-methyl-d,l-aspartate
- WT
wild-type
Footnotes
The authors have no conflict of interest to disclose
REFERENCES
- 1.Morris SM., Jr. Regulation of enzymes of urea and arginine synthesis. Annu Rev Nutr. 1992;12:81–101. doi: 10.1146/annurev.nu.12.070192.000501. [DOI] [PubMed] [Google Scholar]
- 2.Xie L, Gross SS. Argininosuccinate synthetase overexpression in vascular smooth muscle cells potentiates immunostimulant-induced NO production. J Biol Chem. 1997;272:16624–16630. doi: 10.1074/jbc.272.26.16624. [DOI] [PubMed] [Google Scholar]
- 3.Day CP, James OF. Steatohepatitis: a tale of two “hits”? Gastroenterology. 1998;114:842–845. doi: 10.1016/s0016-5085(98)70599-2. [DOI] [PubMed] [Google Scholar]
- 4.Lalor PF, Faint J, Aarbodem Y, Hubscher SG, Adams DH. The role of cytokines and chemokines in the development of steatohepatitis. Semin Liver Dis. 2007;27:173–193. doi: 10.1055/s-2007-979470. [DOI] [PubMed] [Google Scholar]
- 5.Ignarro LJ. Physiology and pathophysiology of nitric oxide. Kidney Int Suppl. 1996;55:S2–5. [PubMed] [Google Scholar]
- 6.Radi R, Cassina A, Hodara R. Nitric oxide and peroxynitrite interactions with mitochondria. Biol Chem. 2002;383:401–409. doi: 10.1515/BC.2002.044. [DOI] [PubMed] [Google Scholar]
- 7.McKim SE, Gabele E, Isayama F, Lambert JC, Tucker LM, Wheeler MD, Connor HD, et al. Inducible nitric oxide synthase is required in alcohol-induced liver injury: studies with knockout mice. Gastroenterology. 2003;125:1834–1844. doi: 10.1053/j.gastro.2003.08.030. [DOI] [PubMed] [Google Scholar]
- 8.Venkatraman A, Shiva S, Wigley A, Ulasova E, Chhieng D, Bailey SM, Darley-Usmar VM. The role of iNOS in alcohol-dependent hepatotoxicity and mitochondrial dysfunction in mice. Hepatology. 2004;40:565–573. doi: 10.1002/hep.20326. [DOI] [PubMed] [Google Scholar]
- 9.Engel K, Hohne W, Haberle J. Mutations and polymorphisms in the human argininosuccinate synthetase (ASS1) gene. Hum Mutat. 2009;30:300–307. doi: 10.1002/humu.20847. [DOI] [PubMed] [Google Scholar]
- 10.Saheki T, Kobayashi K. Mitochondrial aspartate glutamate carrier (citrin) deficiency as the cause of adult-onset type II citrullinemia (CTLN2) and idiopathic neonatal hepatitis (NICCD). J Hum Genet. 2002;47:333–341. doi: 10.1007/s100380200046. [DOI] [PubMed] [Google Scholar]
- 11.Adachi K, Matsuhashi T, Nishizawa Y, Usukura J, Popinigis J, Wakabayashi T. Studies on urea synthesis in the liver of rats treated chronically with ethanol using perfused livers, isolated hepatocytes, and mitochondria. Biochem Pharmacol. 1995;50:1391–1399. doi: 10.1016/0006-2952(95)02023-3. [DOI] [PubMed] [Google Scholar]
- 12.Cascales C, Cascales M, Santos-Ruiz A. Effect of chronic ethanol or acetaldehyde on hepatic alcohol and aldehyde dehydrogenases, aminotransferases and glutamate dehydrogenase. Rev Esp Fisiol. 1985;41:19–27. [PubMed] [Google Scholar]
- 13.Lieber CS, DeCarli LM. The feeding of alcohol in liquid diets: two decades of applications and 1982 update. Alcohol Clin Exp Res. 1982;6:523–531. doi: 10.1111/j.1530-0277.1982.tb05017.x. [DOI] [PubMed] [Google Scholar]
- 14.Shannon PT, Reiss DJ, Bonneau R, Baliga NS. The Gaggle: an open-source software system for integrating bioinformatics software and data sources. BMC Bioinformatics. 2006;7:176. doi: 10.1186/1471-2105-7-176. [DOI] [PMC free article] [PubMed] [Google Scholar]
- 15.Kukielka E, Dicker E, Cederbaum AI. Increased production of reactive oxygen species by rat liver mitochondria after chronic ethanol treatment. Arch Biochem Biophys. 1994;309:377–386. doi: 10.1006/abbi.1994.1127. [DOI] [PubMed] [Google Scholar]
- 16.Wu D, Cederbaum AI. Ethanol consumption by the nursing mother induces cytochrome P-4502E1 in neonatal rat liver. J Pharmacol Exp Ther. 1993;267:560–566. [PubMed] [Google Scholar]
- 17.Scholz RW, Reddy PV, Wynn MK, Graham KS, Liken AD, Gumpricht E, Reddy CC. Glutathione-dependent factors and inhibition of rat liver microsomal lipid peroxidation. Free Radic Biol Med. 1997;23:815–828. doi: 10.1016/s0891-5849(97)00067-1. [DOI] [PubMed] [Google Scholar]
- 18.Deng QG, She H, Cheng JH, French SW, Koop DR, Xiong S, Tsukamoto H. Steatohepatitis induced by intragastric overfeeding in mice. Hepatology. 2005;42:905–914. doi: 10.1002/hep.20877. [DOI] [PubMed] [Google Scholar]
- 19.Purohit V, Gao B, Song BJ. Molecular mechanisms of alcoholic fatty liver. Alcohol Clin Exp Res. 2009;33:191–205. doi: 10.1111/j.1530-0277.2008.00827.x. [DOI] [PMC free article] [PubMed] [Google Scholar]
- 20.Winder WW, Hardie DG. AMP-activated protein kinase, a metabolic master switch: possible roles in type 2 diabetes. Am J Physiol. 1999;277:E1–10. doi: 10.1152/ajpendo.1999.277.1.E1. [DOI] [PubMed] [Google Scholar]
- 21.Bonnefont JP, Djouadi F, Prip-Buus C, Gobin S, Munnich A, Bastin J. Carnitine palmitoyltransferases 1 and 2: biochemical, molecular and medical aspects. Mol Aspects Med. 2004;25:495–520. doi: 10.1016/j.mam.2004.06.004. [DOI] [PubMed] [Google Scholar]
- 22.Oekonomaki E, Notas G, Mouzas IA, Valatas V, Skordilis P, Xidakis C, Kouroumalis EA. Binge drinking and nitric oxide metabolites in chronic liver disease. Alcohol Alcohol. 2004;39:106–109. doi: 10.1093/alcalc/agh030. [DOI] [PubMed] [Google Scholar]
- 23.Aagaard NK, Thogersen T, Grofte T, Greisen J, Vilstrup H. Alcohol acutely down-regulates urea synthesis in normal men. Alcohol Clin Exp Res. 2004;28:697–701. doi: 10.1097/01.alc.0000125355.31808.dc. [DOI] [PubMed] [Google Scholar]
- 24.Berry MN, Gregory RB, Grivell AR, Phillips JW, Schon A. The capacity of reducing-equivalent shuttles limits glycolysis during ethanol oxidation. Eur J Biochem. 1994;225:557–564. doi: 10.1111/j.1432-1033.1994.00557.x. [DOI] [PubMed] [Google Scholar]
- 25.Crabb DW. Recent developments in alcoholism:the liver. Recent Dev Alcohol. 1993;11:207–230. [PubMed] [Google Scholar]
- 26.Young TA, Bailey SM, Van Horn CG, Cunningham CC. Chronic ethanol consumption decreases mitochondrial and glycolytic production of ATP in liver. Alcohol Alcohol. 2006;41:254–260. doi: 10.1093/alcalc/agl017. [DOI] [PubMed] [Google Scholar]
- 27.Maier KP, Talke H, Gerok W. Activities of urea-cycle enzymes in chronic liver disease. Klin Wochenschr. 1979;57:661–665. doi: 10.1007/BF01477666. [DOI] [PubMed] [Google Scholar]
- 28.Schricker T, Albuszies G, Weidenbach H, Beckh KH, Ensinger H, Geisser W, Adler G, et al. [Liver urea and glucose production in patients with alcohol-induced cirrhosis]. Dtsch Med Wochenschr. 1997;122:75–79. doi: 10.1055/s-2008-1047579. [DOI] [PubMed] [Google Scholar]
- 29.Shambaugh GE., 3rd. Urea biosynthesis II. Normal and abnormal regulation. Am J Clin Nutr. 1978;31:126–133. doi: 10.1093/ajcn/31.1.126. [DOI] [PubMed] [Google Scholar]
- 30.Nanji AA, Greenberg SS, Tahan SR, Fogt F, Loscalzo J, Sadrzadeh SM, Xie J, et al. Nitric oxide production in experimental alcoholic liver disease in the rat: role in protection from injury. Gastroenterology. 1995;109:899–907. doi: 10.1016/0016-5085(95)90400-x. [DOI] [PubMed] [Google Scholar]
- 31.Cederbaum AI, Lieber CS, Beattie DS, Rubin E. Effect of chronic ethanol ingestion on fatty acid oxidation by hepatic mitochondria. J Biol Chem. 1975;250:5122–5129. [PubMed] [Google Scholar]
Associated Data
This section collects any data citations, data availability statements, or supplementary materials included in this article.