Abstract
There is a large amount of evidence available about the relative merits of unicompartmental and total knee arthroplasty (UKA and TKA). Based on the same evidence, different people draw different conclusions and as a result, there is great variability in the usage of UKA.
The revision rate of UKA is much higher than TKA and so some surgeons conclude that UKA should not be performed. Other surgeons believe that the main reason for the high revision rate is that UKA is easy to revise and, therefore, the threshold for revision is low. They also believe that UKA has many advantages over TKA such as a faster recovery, lower morbidity and mortality and better function. They therefore conclude that UKA should be undertaken whenever appropriate.
The solution to this argument is to minimise the revision rate of UKA, thereby addressing the main disadvantage of UKA. The evidence suggests that this will be achieved if surgeons use UKA for at least 20% of their knee arthroplasties and use implants that are appropriate for these broad indications.
Cite this article: Bone Joint J 2015;97-B(10 Suppl A):3–8.
Keywords: unicompartmental knee replacement; unicompartmental knee arthroplasty
The burden of knee osteoarthritis (OA) is huge. Epidemiological studies estimate that the lifetime risk of developing symptomatic arthritis of the knee is 50%, with 50% of cases being diagnosed by the age of 55 years.1 International trends suggest that this number will continue to rise substantially, largely because of the ageing population and an increased prevalence of risk factors, particularly obesity.2 The demand is projected to grow by more than 600% by 2030. In 2013, almost 100 000 primary knee arthroplasties were performed within the United Kingdom, an increase of 25% on 2010.3
It is important that patients are offered a treatment which is safe and effective. For a treatment to be safe, it should have minimum risk of major complications including risk of dying, myocardial infarction, thromboembolism and infection. For a treatment to be effective, it should relieve the patient of their symptoms, allowing them to return to a normal life sooner rather than later and to engage in activities of daily living including recreational and social events. In addition, the risk of needing further intervention should be minimal and when the intervention is needed, it should be relatively straightforward, with a predictable outcome.
Two treatment options to treat end-stage knee OA are unicompartmental knee arthroplasty (UKA) and total knee arthroplasty (TKA). UKA replaces only the arthritic part of the joint, while TKA replaces the entire knee joint. While studies demonstrate that up to a half of patients may be suitable for UKA, there is a huge variability in the usage of UKA between surgeons, ranging from 0% to 50% (mean 8%) of all primary knee arthroplasties.4,5 One of the main reasons for this wide variation in practice is that surgeons interpret the evidence about the relative benefits and risks of UKA and TKA in different ways.
In this article, which focuses on National Registry data, we will put forward the arguments used by the proponents of TKA and UKA and explain why this leads to very polarised views. We then highlight the differences and provide solutions.
TKA is better – the glass is half empty
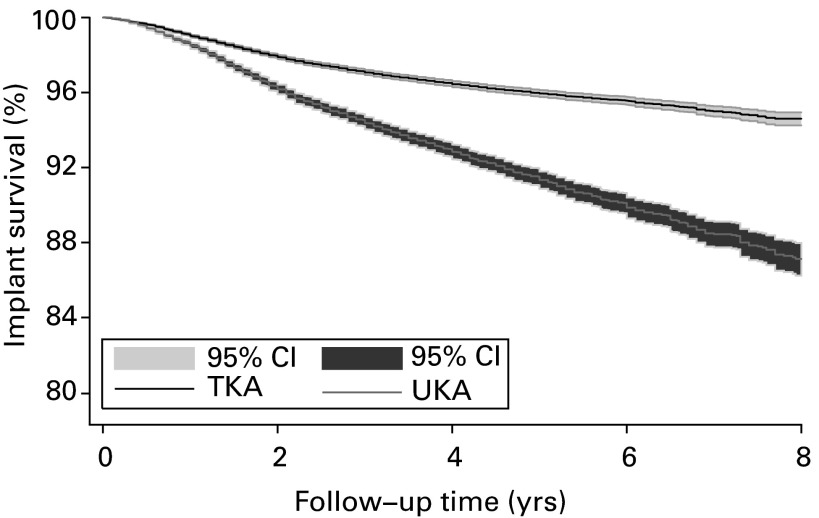
The principal reason National Joint Registries were established was to identify poorly performing implants. It is felt that Registries are ideally suited for this as the numbers of joint arthroplasties studied are very large, thus, differences will be detected early and are likely to be statistically significant. Furthermore, as the data are collected from all surgeons, conclusions based on Registry data should be applicable across a country, which is not necessarily the case for cohort or randomised studies. This type of data should, therefore, be an ideal basis for National Guidelines. In every National Registry the revision rate of UKA is much higher than TKA. For example, in the largest National Registry in the world, the National Joint Registry (NJR) for England, Wales and Northern Ireland, the revision rate is 3.2 times higher for UKA than TKA (Fig. 1).6 Furthermore, in National Registry studies based on patient reported outcome scores (PROMS), UKA has no advantage in terms of satisfaction or functional improvement.7,8 With such a large difference in revision rate and no functional advantage, surgeons should stop using UKA. This would save patients from the increased risk of further surgery and save large sums of money for the health service.9
Fig. 1.
Graph showing the Kaplan-Meier survival of unicompartmental and total knee arthroplasty (UKA and TKA) based on data from the National Joint Registry.4,6 CI, confidence interval.
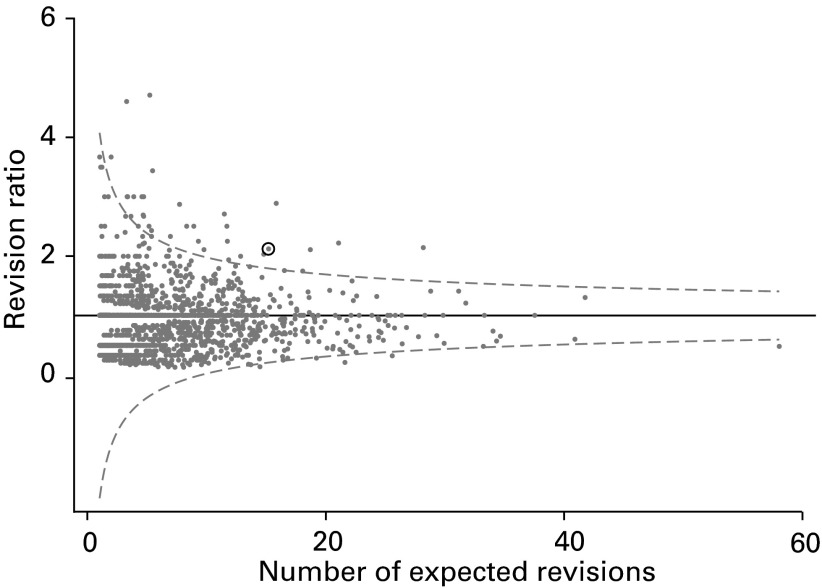
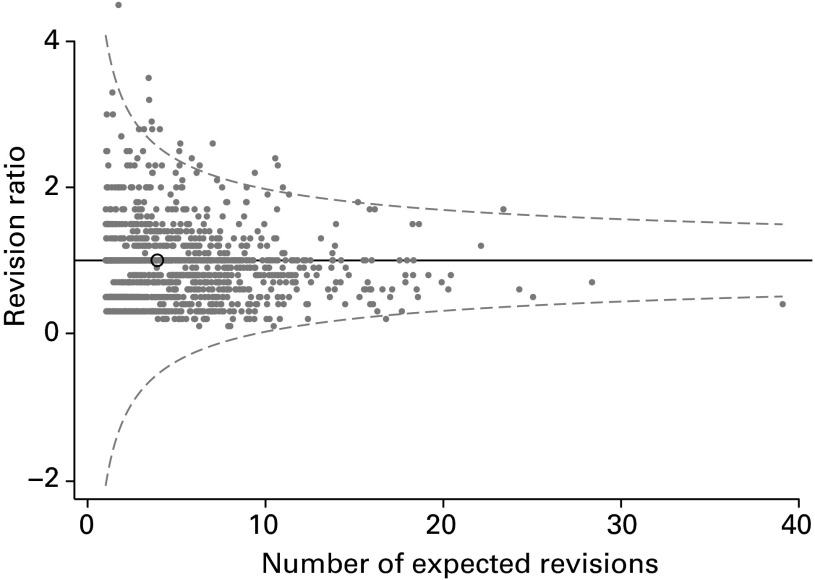
National Registries were also established to identify surgeons with high revision rates and to provide them with the necessary information to help them improve their results. In both Sweden and Australia in recent years there has been a steady decrease in the use of UKA.10,11 This may, in part, be because the Registries have been informing the surgeons of the high revision rate with UKA and encouraging them to stop using it. A very effective outlier system has been established by the NJR. Surgeon’s revision rates for knee arthroplasties are plotted on funnel plots and if the revision rate is more than three standard deviations from the mean they are identified as outliers (Fig. 2). They are then contacted, sent the relevant information and asked to check it, and encouraged to rectify the situation. Surgeons who undertake large numbers of UKA are more likely to be outliers than those who do not. The reason for this is that UKA has a much higher revision rate than TKA. Therefore when data from all knee arthroplasties are combined, surgeons that do UKA as well as TKA will have a higher revision rate than those who just do TKA. As a result, many outliers are surgeons who do UKA and the simplest way they can stop being outliers is to undertake fewer UKAs, or to stop completely.
Fig. 2.
Funnel plot taken from the National Joint Registry for all knee arthroplasties combined for an example surgeon who is an outlier. His knee arthroplasty practice includes a large proportion of unicompartmental knee arthroplasties.
During their training, surgeons learn that there are many contraindications to UKA.12 As surgeons are worried about the revision rate of UKA they will tend to use narrow indications and just operate on patients they would consider to be ideal. The biggest concern about UKA is disease progression in the retained compartments. Many surgeons, therefore, undertake UKA only on patients with medial damage who have pristine lateral and patellofemoral joints. These patients tend to have early arthritis. Knee arthroplasty, both UKA and TKA, is unreliable in early arthritis, with more patients having poor results than in end-stage arthritis.13,14 Therefore a vicious circle may develop in which surgeons, who are anxious about revision of UKA, have narrow indications and do small numbers, and then have a high revision rate. They will further narrow their indications and may eventually stop UKA completely. The high revision rate will then contribute to the high revision rate in the Registries.
UKA is better – the glass is half full
Although there are differences between Registries, they tend to collect data when any joint arthroplasty component is implanted, and generally a revision is considered to have occurred the second time a component is inserted into a particular joint. When a revision occurs, the implant is considered to have failed and a survival analysis is conducted on this basis. If an implant has not been revised, it is considered to be a success even if it is painful and has poor function. Revision is a hard end point, but may be biased because revisions are of different magnitude and may be undertaken at different thresholds. Revisions of UKA tend to be of a lesser magnitude than revision of TKA. UKA revisions are commonly simple conversions to a primary TKA, addition of a lateral UKA (for disease progression after medial UKA) or replacement of a bearing (for fixed bearing wear or mobile bearing dislocation), whereas TKA revisions tend to be complex and involve stems, wedges and stabilised components. Furthermore, the major problems which can occur after TKA such as amputation, knee fusion or death resulting from surgery may not be considered to be revisions, and thus the operation is considered to be a success.15 Therefore, a fairer endpoint with which to compare UKA and TKA is any re-operation.
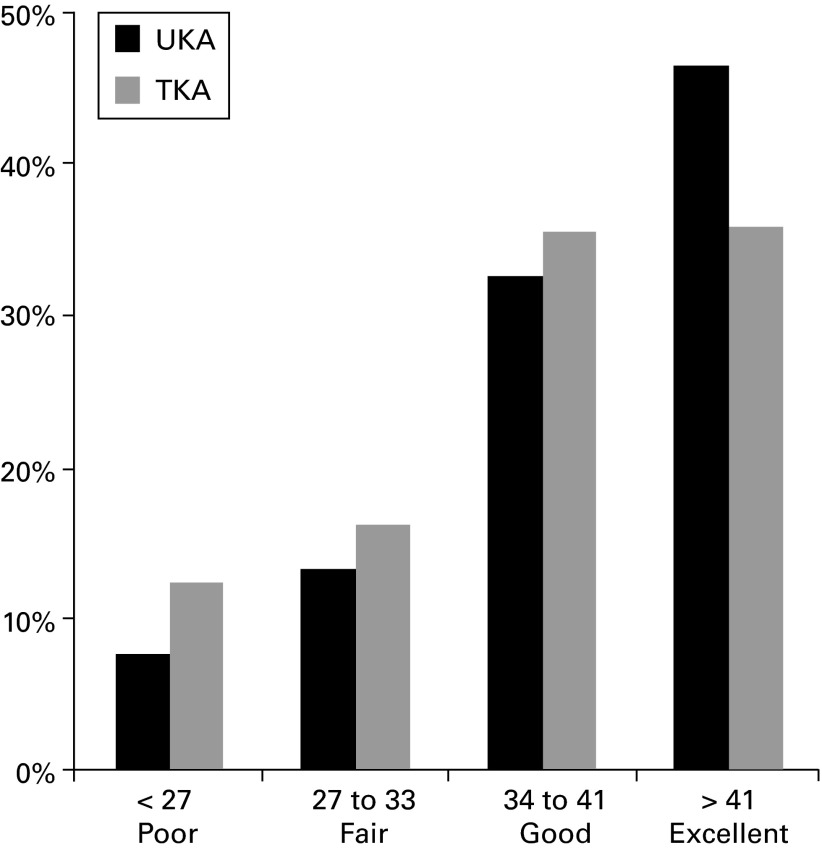
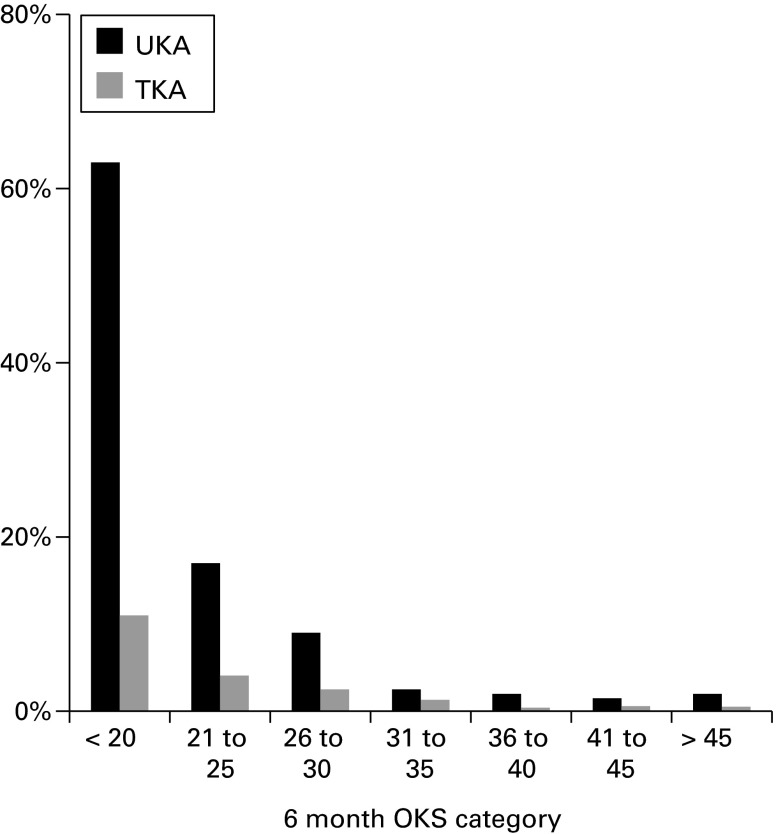
As a revision of a UKA is generally much easier than a revision of a TKA, it is likely that the threshold for revision of UKA is lower than that of TKA, so the higher revision rate would not necessarily suggest that UKA have a worse outcome than TKA. There is good evidence to suggest that this is indeed the case. The New Zealand Joint Registry (NZJR), as well as collecting data about revision, collects Oxford knee scores16 (OKS) at six months after the operation and categorises these into poor, fair, good and excellent.17,18 Data from the NZJR demonstrate that UKAs have more excellent and fewer poor results than TKAs, so the higher revision rate is not because UKAs have more poor results (Fig. 3).15 The NZJR also compares the six-month OKS with the subsequent revision rate. The graph in Figure 4, based on NZJR data, demonstrates that whatever the outcome score, the revision rate of UKA is about five times higher than that of TKA.15 This suggests that factors independent of outcome score increase the revision rate by five times. The most important factor is likely to be a different threshold for revision. The most striking difference in revision rate occurs in patients who have a worse score post-operatively than pre-operatively (OKS less than about 20). These patients have a 10% chance of being revised if they have had a TKA and a 60% chance of being revised if they have had a UKA. Most surgeons would agree that it is an advantage of UKA over TKA that it is relatively straightforward to revise if there is a problem. The consequence of it being easy to revise is that the threshold for revision is lower. As a result, the revision rate is higher, even though the chance of getting a poor result is lower. The higher revision rate of UKA should thus not be considered to be a problem because it is a manifestation of an advantage.
Fig. 3.
Graph showing the percentage of unicompartmental and total knee arthroplasties (UKA and TKA) having poor, fair, good and excellent outcomes according to the Oxford knee score based on data from the New Zealand Joint Registry.15
Fig. 4.
Graph showing the two-year revision rates for unicompartmental and total knee arthroplasty (UKA and TKA) having different Oxford knee score (OKS) categories at six months post-surgery, based on data from the New Zealand Joint Registry.15
When Joint Registries compare UKA and TKA they tend to use raw, unmatched data.19 As UKA tends to be implanted in younger and more active patients than TKA, such comparisons are invalid. The only fair way to compare UKA and TKA is to match patients who have had UKA with those who have had TKA. A matched comparison of UKA and TKA based on NJR data and other large datasets has been undertaken.4 In total, 100 000 knee arthroplasties were matched on a 1:3 basis using propensity score analysis of 20 variables. UKA were found to have many advantages - the length of stay was a mean 1.4 days shorter, the re-admission rate within the first year was two thirds of that found in TKA, intra-operative complications and transfusions were a quarter. Major medical complications, such as thromboembolism, infection, stroke and myocardial infarction occurred between a quarter and a half less frequently. The mortality following UKA was also significantly lower (hazard ratio at 30 days was 0.23, at 90 days it was 0.46 and at eight years it was 0.87). The survival curves (based on death) progressively separated for about four years and thereafter remained parallel, suggesting that effect of surgery on the death rate lasted for four years. The main disadvantage of UKA was that it had a higher revision rate. At eight years the revision rate was 2.1 times higher and the re-operation rate was 1.4 times higher.4
In a separate matched study of about 15 000 patients, the PROMS of UKA and TKA were compared.20 The pre-operative OKS of both UKA and TKA were the same (mean scores of 22). At six months the OKS was significantly better with UKA (mean 38) than TKA (mean 36). Although the difference in mean was small and may not be clinically important, many more patients achieved an excellent OKS (OKS > 41) with UKA (odds ratio (OR) 1.6). The overall EuroQuol21 score was also significantly better with UKA: the four subscales relating to mobility, pain, function and self care were significantly better but, in the subscale of anxiety, there was no significant difference. The level of patient satisfaction was also assessed and significantly more (OR 1.3) patients achieved excellent satisfaction with UKA. There are no other matched comparisons of UKA and TKA based on PROMS from National Registers. An unmatched comparison from the NZJR showed a significantly better mean OKS with UKA (39) than TKA (37).15,22 Similarly, in an unmatched comparison based on NJR data, there was a significantly better mean OKS with UKA (35.5) than TKA (34.0). However, in this study (which had a relatively small number of UKAs) there was no significant difference in the improvement in mean OKS between UKA and TKA when adjusted for other factors.7
The conclusion from these analyses is that UKA are better than TKA and, therefore, that the numbers undertaken should increase. Patients who have UKA recover quicker, have lower mortality and morbidity and have better function. UKA is, however, associated with a higher revision rate, but this is primarily because UKAs are easy to revise, therefore, the threshold for revision is lower. Furthermore, if 100 patients had a UKA instead of a TKA then over an eight-year period there would be one fewer deaths and three more revision operations.4
The solution – fill the glass!
It is clear that despite the evidence being the same, different individuals draw different conclusions. An insight into what is going on can be obtained from an ad hoc survey which was undertaken.23 When knee surgeons were asked whether they performed UKA or not, the majority answered no. However, when asked if they had medial compartment arthritis would they have UKA, the majority answered yes. Clearly surgeons appreciate that UKA gives better outcomes, but are perhaps too concerned about the risk of revision to do UKA themselves. Although there is debate about how much the threshold for revision influences the relative revision rate of UKA and TKA, it certainly does influence it to some extent. Therefore, the revision rate should not be used in isolation to compare UKA and TKA. The Registers should make this clear, as the Danish Joint Register has already done.24
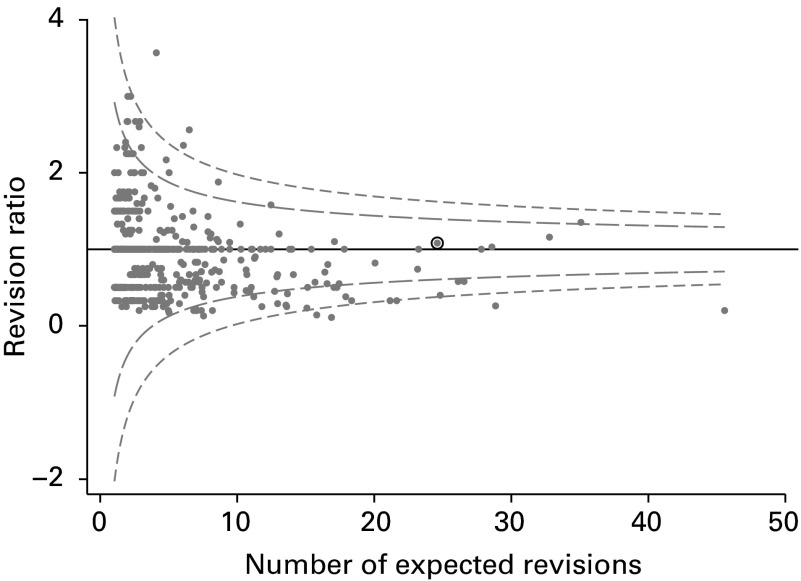
If revision is not a reliable way to compare UKA and TKA, then the outlier system in the NJR should change. The surgeon whose funnel plot is shown in Figure 2 is an outlier for knee arthroplasties (all combined). His funnel plots for both UKA (Fig. 5a) and TKA (Fig. 5b) show that he has an average revision rate for both UKA and TKA, and so he should not be considered to be an outlier. Thus, when identifying outliers, either UKA and TKA should not be combined or the method used to combine them should be altered by adjusting for the relative revision rates of UKA and TKA. There are a number of ways that this can be done from a statistical point of view, for example, by using the weighted mean incidence ratio (WMIR). If a funnel plot was produced, based on WMIR, for all knee arthroplasties combined for this example surgeon, it would correctly demonstrate that he has an average revision rate and is not an outlier.
Figs. 5a - 5b.
Funnel plots for a) total knee arthroplasty and b) unicompartmental knee arthroplasty for a surgeon who is an outlier for all knee arthroplasties combined (Fig. 2).
The revision rate for UKA is much higher in National Registries than in many cohort studies.14 The main reason for this is surgical experience. In the National Registers, most surgeons are undertaking very small numbers whereas, in published series, surgeons tend to undertake large numbers. The data from the NJR show that the most common number of UKAs implanted per surgeon per year is one and the second most common number is two;25 the average number is five. When the number of UKAs performed per surgeon per year were compared with the revision rate, it was found that the surgeons doing small numbers had a very high revision rate.25 The surgeons doing one or two UKAs per year had a 4% failure rate per year which would equate to about a 60% survival at ten years. The revision rate dramatically decreases with increasing numbers. Surgeons undertaking about ten UKAs per year have a revision rate of 2% per year, whereas surgeons undertaking about 30 per year have a revision rate of 1% per year. In the matched comparison, it was found that surgeons doing more than 30 per year had a re-operation/revision rate that was not statistically different from the re-operation/revision rate of TKA.25
As surgeons cannot easily increase the size of their knee arthroplasty practice, the only way they can increase the number of UKAs they implant is by increasing the proportion of knee arthroplasties that are UKAs. In order to do this, they may have to broaden their indications for UKA. If they use broad indications they have to ensure that the implant they use is appropriate for the indications. It is likely that the indications and contraindications may be different for different devices and, in particular, they may be different for mobile and fixed bearing implants. The indications and contraindications for fixed bearing devices were summarised by Kozinn and Scott in 1989,12 but they did not have a good evidence base. The evidence that exists suggests that damage to the patellofemoral joint, obesity, youth and high activity levels should be considered to be contraindications.12,26 In contrast, there is good evidence that with the Oxford UKA (Zimmer Biomet, Bridgend, United Kingdom) provided the main indication antero-medial osteoarthritis (AMOA) is satisfied, these and the other contraindications proposed by Kozinn and Scott12 do not apply.27 AMOA is clearly defined and requires bone-on-bone medial OA, full thickness cartilage laterally, a functionally intact anterior cruciate ligament and a correctable intra-articular deformity. These criteria are satisfied in about 50% of knees requiring arthroplasty, and so the Oxford UKA can be used safely in about 50% of knee arthroplasties. It is not clear in what proportion of knees fixed bearing devices can safely be used. Although some have suggested it is 5% to 10%, it is likely that the figure is higher than this.28
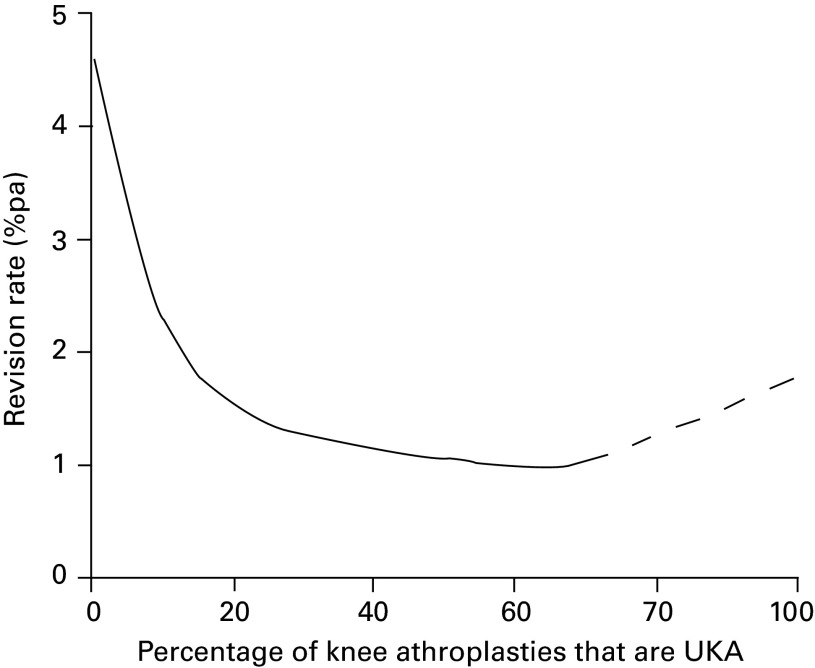
Figure 6 shows the relationship, for the Oxford UKA, between the revision rate and the percentage of a surgeon’s knee arthroplasties that are UKA.29 The shape of the graph is not what would be expected. The revision rate for surgeons with a 10% usage or less is very high. As the usage increases, the revision rate dramatically decreases until 20% usage. Thereafter, with increasing usage, there is a slow but steady decrease in the revision rate, which is at its lowest when usage is at around 50%. With optimal usage (40% to 60%) it was found in the matched study that the re-operation/revision rate of UKA was not statistically different from that of TKA.29 Above 60%, although the data are unreliable because the numbers are small, the revision rate increases, suggesting that very high usage rates should be avoided. With fixed bearing UKA the situation is similar with decreasing revisions rates as usage increases to 20%. However, above 20% the revision rate does not drop further.
Fig. 6.
Graph showing the relationship for the Oxford unicompartmental knee arthroplasty (UKA) between revision rate (revisions per 100 component years) and usage of UKA (the percentage of a surgeon’s knee arthroplasties that are UKA), based on data from the National Joint Registry.
In conclusion, if surgeons want to undertake UKA they should aim for a usage of 20% or more. If they do this they should ensure that the implant they use is appropriate for these broad indications. With usage rates of 20% or more, patients should have all the benefits of UKA without the high revision rate.
References
- 1.Murphy L, Schwartz TA, Helmick CG, et al. Lifetime risk of symptomatic knee osteoarthritis. Arthritis Rheum 2008;59:1207–1213. [DOI] [PMC free article] [PubMed] [Google Scholar]
- 2.Kurtz S, Ong K, Lau E, Mowat F, Halpern M. Projections of primary and revision hip and knee arthroplasty in the United States from 2005 to 2030. J Bone Joint Surg [Am] 2007;89-B:780–785. [DOI] [PubMed] [Google Scholar]
- 3.No authors listed. 11th Annual Report of the National Joint Registry for England, Wales and Northern Ireland. National Joint Registry. (date last accessed 20 July 2015).
- 4.Liddle AD, Judge A, Pandit H, Murray DW. Adverse outcomes after total and unicompartmental knee replacement in 101,330 matched patients: a study of data from the National Joint Registry for England and Wales. Lancet 2014;384:1437–1445. [DOI] [PubMed] [Google Scholar]
- 5.Willis-Owen CA, Brust K, Alsop H, Miraldo M, Cobb JP. Unicondylar knee arthroplasty in the UK National Health Service: an analysis of candidacy, outcome and cost efficacy. Knee 2009;16:473–478. [DOI] [PubMed] [Google Scholar]
- 6.No authors listed. 10th Annual Report of the National Joint Registry for England, Wales and Northern Ireland. National Joint Registry. (date last accessed 20 July 2015).
- 7.Baker PN, Petheram T, Jameson SS, et al. Comparison of patient-reported outcome measures following total and unicondylar knee replacement. J Bone Joint Surg [Br] 2012;94-B:919–927. [DOI] [PubMed] [Google Scholar]
- 8.Robertsson O, Dunbar M, Pehrsson T, Knutson K, Lidgren L. Patient satisfaction after knee arthroplasty: a report on 27,372 knees operated on between 1981 and 1995 in Sweden. Acta Orthop Scand 2000;71:262–267. [DOI] [PubMed] [Google Scholar]
- 9.Briggs T. A national review of adult elective orthopaedic services in England. Getting it right first time. https://www.boa.ac.uk/wp-content/uploads/2015/03/GIRFT-National-Report-Mar15.pdf (date last accessed 20 July 2015).
- 10.No authors listed. Hip and Knee Arthroplasty Annual Report. Australian Orthopaedic Association National Joint Replacement Registry. https://aoanjrr.dmac.adelaide.edu.au/ (date last accessed 20 July 2015).
- 11.No authors listed. Annual Report 2013. Swedish Knee Arthoplasty Register. (date last accessed 20 July 2015).
- 12.Kozinn SC, Scott R. Unicondylar knee arthroplasty. J Bone Joint Surg [Am] 1989;71-A:145–150. [PubMed] [Google Scholar]
- 13.Niinimäki TT, Murray DW, Partanen J, Pajala A, Leppilahti JI. Unicompartmental knee arthroplasties implanted for osteoarthritis with partial loss of joint space have high re-operation rates. Knee 2011;18:432–435. [DOI] [PubMed] [Google Scholar]
- 14.Pandit H, Gulati A, Jenkins C, et al. Unicompartmental knee replacement for patients with partial thickness cartilage loss in the affected compartment. Knee 2011;18:168–171. [DOI] [PubMed] [Google Scholar]
- 15.Goodfellow JW, O’Connor JJ, Murray DW. A critique of revision rate as an outcome measure: re-interpretation of knee joint registry data. J Bone Joint Surg [Br] 2010;92-B:1628–1631. [DOI] [PubMed] [Google Scholar]
- 16.Murray DW, Fitzpatrick R, Rogers K, et al. The use of the Oxford hip and knee scores. J Bone Joint Surg [Br] 2007;89-B:1010–1014. [DOI] [PubMed] [Google Scholar]
- 17.No authors listed. Fifteen Year Report. January 1999 to December 2013. The New Zealand Joint Registry. (date last accessed 20 July 2015).
- 18.Kalairajah Y, Azurza K, Hulme C, Molloy S, Drabu KJ. Health outcome measures in the evaluation of total hip arthroplasties--a comparison between the Harris hip score and the Oxford hip score. J Arthroplasty 2005;20:1037–1041. [DOI] [PubMed] [Google Scholar]
- 19.No authors listed. 7th Annual Report. National Joint Registry for England and Wales. (date last accessed 20 July 2015).
- 20.Liddle AD, Pandit H, Judge A, Murray DW. Patient reported outcomes following total and unicompartmental knee replacement: a study of 14,076 matched patints from the National Joint Register for England and Wales. Bone Joint J 2015;97-B:793–801. [DOI] [PubMed] [Google Scholar]
- 21.Hurst NP, Kind P, Ruta D, Hunter M, Stubbings A. Measuring health-related quality of life in rheumatoid arthritis: validity, responsiveness and reliability of EuroQol (EQ-5D). Br J Rheumatol 1997;36:551–559. [DOI] [PubMed] [Google Scholar]
- 22.No authors listed. The New Zealand Joint Registry. Ten year report: January 1999 – December 2008. (date last accessed 20 July 2015).
- 23.No authors listed. Survey undertaken at the Knee Society Open meeting. American Academy of Orthopaedic Surgeons Annual Meeting, 2013.
- 24.No authors listed. Danish Knee Arthoplasty Register Annual Report 2010. https://www.knee.dk/groups/dkr/pdf/DKRreportEnglish2010.pdf (date last accessed 20 July 2015).
- 25.Liddle AD, Pandit H, Judge A, Murray DW. The effect of surgical caseload on revision rate following total and unicompartmental knee replacement. J Bone Joint Surg Am . In press. [DOI] [PubMed]
- 26.Argenson JN, Blanc G, Aubaniac JM, Parratte S. Modern unicompartmental knee arthroplasty with cement: a concise follow-up, at a mean of twenty years, of a previous report. J Bone Joint Surg [Am] 2013;95-A:905–909. [DOI] [PubMed] [Google Scholar]
- 27.Pandit H, Jenkins C, Gill HS, et al. Unnecessary contraindications for mobile-bearing unicompartmental knee replacement. J Bone Joint Surg [Br] 2011;93-B:622–628. [DOI] [PubMed] [Google Scholar]
- 28.Stern SH, Becker MW, Insall JN. Unicondylar knee arthroplasty. An evaluation of selection criteria. Clin Orthop Relat Res 1993;286:143–148. [PubMed] [Google Scholar]
- 29.Liddle AD, Pandit H, Judge A, Murray DW. Optimizing Outcomes Following Unicompartmental Knee Replacement: Insights from a Study of 25,982 Cases (Scientific Exhibit SE11) [abstract]. American Academy of Orthopaedic Surgeons Annual Meeting , 2015.


