

Abstract
Epilepsy is a complex disorder involving neurological alterations that lead to the pathological development of spontaneous, recurrent seizures. For decades, seizures were thought to be largely repetitive, and had been examined at the macrocircuit level using electrophysiological recordings. However, research mapping the dynamics of large neuronal populations has revealed that seizures are not simply recurrent bursts of hypersynchrony. Instead, it is becoming clear that seizures involve a complex interplay of different neurons and circuits. Herein, we will review studies examining microcircuit changes that may underlie network hyperexcitability, discussing observations from network theory, computational modeling, and optogenetics. We will delve into the idea of hub cells as pathological centers for seizure activity, and will explore optogenetics as a novel avenue to target and treat pathological circuits. Finally, we will conclude with a discussion on future directions in the field.
Epileptic seizures involve the complex interplay of many neurons and circuits. Computational modeling, network theory, and optogenetics studies indicate that hub cells and the microcircuits they control may play a key role.
Epileptic seizures are large-scale events, in which synchronous neural spiking activity occurs throughout a brain region (Penfield and Jasper 1954). Traditionally, scalp and intracranial electroencephalography (EEG) have been used to record electrical activity during seizures, and have played important roles in the evaluation and management of patients with epilepsy (Smith 2005; Mansouri et al. 2012). However, EEG has notable limitations in terms of spatiotemporal sensitivity because of the fact that it is essentially an average measurement of the activity of large populations of cells; it is not able to discern the firing patterns of individual neurons, or even activity at the level of microcircuits, which defines the most fundamental connections between neurons (Buzsáki et al. 2012). Therefore, although we can detect functional abnormalities in the network and pinpoint the general location of these abnormalities, the mechanisms that govern seizure activity are largely unknown (van Mierlo et al. 2014).
To begin to understand seizures as the result of aberrant circuit connections, we needs to be able to monitor the activity of populations of neurons with sufficient spatial resolution. Recently, more precise recordings of individual cells using a techniques such as two-photon microscopy or single-unit recordings have shown that, surprisingly, seizures are not as repetitive and homogeneous as originally viewed. Instead, there is complex circuit communication associated with epileptiform activity (Truccolo et al. 2011; Feldt Muldoon et al. 2013). Contributions of specific neuronal populations have been observed to be variable, and certain well-connected networks appear to play a greater role in the initiation and progression of large-scale network events (Morgan and Soltesz 2008; Keller et al. 2010; Sabolek et al. 2012). In addition, work from high-level network theory and data-driven computational studies have modeled how altered neural circuit connections can trigger seizure activity (Santhakumar et al. 2005; Dyhrfjeld-Johnsen et al. 2007; Morgan and Soltesz 2008; Bullmore and Sporns 2009). These experimental breakthroughs and theoretical and computational models have been important in advancing our knowledge of how seizures initiate and propagate through the brain. Better understanding of these circuits would open new avenues in the development of interventions that can target and treat epileptic networks.
Here, we will review recent findings regarding microcircuit changes that may underlie network hyperexcitability in seizures, bringing in findings from studies using network theory, data-driven computational modeling, and optogenetic technology. In particular, we will discuss the idea of hub cells as pathological niduses for seizure activity. In addition, we will explore applications of optogenetics, as a tool to unravel the large number of microcircuit changes in epilepsy, and also as a potential novel avenue for precise targeting of pathological circuits and noninvasive treatment. Finally, we will conclude with a brief discussion on future directions and goals in the field of epilepsy research on microcircuits.
HETEROGENEITY IN EPILEPTIFORM ACTIVITY: EXAMINING SEIZURES AT THE MICROCIRCUIT LEVEL
EEG has been successfully used in epilepsy to observe the hypersynchronous activity that occurs during seizures (van Mierlo et al. 2014). Because this hypersynchronous activity often involves large areas of the brain, it has been a major challenge to observe brainwave patterns at the level of the neurons and their individual connections. Therefore, it has been assumed that hypersynchrony is just that, large populations of neurons firing together in an abnormal manner. With the advent of technologies such as two-photon microscopy and sophisticated calcium dyes, we have begun to learn more about what occurs during seizures at a microscopic scale (Coulter et al. 2011). It has become possible to visualize the activity of hundreds of neurons during large-scale population events to gain insight into the brain’s dynamics at the microstructure level and the alterations that occur in epilepsy (Rochefort et al. 2008).
In fact, when neuronal activity was mapped in the hippocampal granule cell layer in the mouse, there were, surprisingly, clusters of synchronous cells in both nonepileptic and epileptic animals, but, notably, major structural and functional differences between the clusters from epileptic versus nonepileptic animals existed (Fig. 1) (Feldt Muldoon et al. 2013). In particular, the clusters found in epileptic animals were much more compact—the same number of cells spanned less than half the volume of neuronal clusters from nonepileptic animals, and also fired with high correlation with large-scale synchronous network events (Fig. 1B,C) (Feldt Muldoon et al. 2013). In contrast, clusters from nonepileptic animals fired continuously and independently from network events (Fig. 1B) (Feldt Muldoon et al. 2013). It is possible that these spatially compact clusters are densely connected and able to maintain synchronous activity more effectively than more dispersed clusters. Nevertheless, the importance of such observations highlights what can be learned about the altered microcircuitry that may underlie the broad activity normally observed in seizures.
Figure 1.

Neuronal cluster recruitment during epileptiform events. (A) Spatially localized clusters of neurons in the granule cell layer from tissue from an epileptic animal showing synchronous firing patterns are demarcated by polygons. (B,C) Spatial mapping and activation frequency of neuronal clusters from tissue from a control (B) and an epileptic animal (C). Lighter cluster shades indicate lower frequency of activation. (D, top) Raster plot of the activity of clusters diagrammed in A, represented by short vertical lines in corresponding colors; the height of the individual colored lines indicates the number of cells composing the cluster. Vertical gray lines extending the entire raster plot designate detected large-scale network events. (D, bottom) Fraction of active clusters over time. (From Feldt Muldoon et al. 2013; adapted, with permission, provided by the PNAS open access option.)
This is not the entire story with regard to cluster recruitment, however. There is also a remarkable degree of variability in the cell populations that are recruited during seizure events, both in experimental models as well as in human patients with epilepsy. Surprisingly, in tissue from epileptic animals, the synchronous neuronal clusters did not always fire during large-scale network events (Fig. 1D) (Feldt Muldoon et al. 2013). Instead, the pattern of cluster recruitment was nonuniform, showing large heterogeneity between macroscopically “recurrent” epileptiform events at the scale of microcircuits (Feldt Muldoon et al. 2013). This heterogeneity is not limited to laboratory models, as patients have shown nonuniform recruitment of neuronal populations during initiation and progression of epileptiform events (Keller et al. 2010; Truccolo et al. 2011; Sabolek et al. 2012). Even between sequential seizures, the fraction of active neurons was highly variable, with different populations of neurons participating in sequential events; this appeared independent of neuronal class type, as it was evident for interneurons and principal neurons (Keller et al. 2010; Truccolo et al. 2011). Additionally, even among neurons that were frequently active during seizures, the spiking patterns of those cells did not repeat between consecutive seizures (Truccolo et al. 2011), and the path of propagation during large-scale bursts of activity changed between episodes (Sabolek et al. 2012). These results highlight the existence of variable paths of epileptiform synchronization dynamics in the recruitment of pathological neuronal clusters.
Although we have been able to observe the dynamics of hundreds of individual neurons, showing the vast heterogeneity of large network synchronizations in epilepsy, important challenging questions remain. What cell populations are critical in the recruitment of specific microcircuits involved in the generation of epileptiform events, and how do individual neurons come together to give rise to these events? Furthermore, considering the high dimensionality and complexity of seizure events, how can we rationalize and quantify the data to better model and understand how the underlying structural connectivity of the network is related to large-scale synchronization? Importantly, being able to do so would better enable prediction of how certain disease states are the result of alterations in specific cell populations and circuits. Although many of these questions have not been addressed yet by experimental methods, network theory gives us the first glimpses into how such questions may be approached.
NETWORK MODELS DESCRIBE MICROCIRCUIT BRAIN CONNECTIVITY
Network Analysis: Important Parameters and Key Concepts
An emerging approach that has the potential to offer important insights into our understanding of microcircuit alterations in epilepsy is based on high-level network analysis of neuronal ensembles (Fornito et al. 2013; Sporns 2013). Drawing analogies from other disciplines, such as social sciences, information technologies, or genetics, in which large networks of interactions are analyzed using mathematical and statistical tools, it is insightful to abstract and analyze neuronal assemblies as networks consisting of nodes (neurons) connected to each other via links (synaptic connections). At this level of description, the neuroanatomical and electrophysiological properties are essentially set aside and the focus is on understanding how general properties in the connectivity pattern of a network may allow or disallow certain functions, and how modifications of these properties relate to pathological conditions.
Ideas drawn from network theory have been particularly fruitful in describing which organizational principles of microcircuits are important to allow synchrony across distant populations of neurons. This is especially relevant in the context of epilepsy. Although long-range synchrony is a characteristic dynamic feature of healthy cortical assemblies and is important in processes such as γ brain wave oscillations or the unification of disconnected place fields (Brun et al. 2002; Buzsáki and Draguhn 2004; Fries 2009), misregulation of long-range synchrony is thought to contribute to ictal activity (Netoff and Schiff 2002; Mormann et al. 2003; Cymerblit-Sabba and Schiller 2010; Kramer et al. 2010).
For large-scale synchronization to be possible, both in normal and pathological states, information needs to flow rapidly, locally, and globally. It is important to understand these network characteristics using theoretical and computational methods to determine the most relevant and consequential network alterations in epilepsy and epileptogenesis, and to guide experimental studies. Several mathematical parameters have been used to understand how large-scale synchrony can arise from local and global connections (Telesford et al. 2011). Two fundamental variables necessary to evaluate the degree of connectivity are the clustering coefficient C and the characteristic path length L. The clustering coefficient C estimates the density of connections locally between neighboring neurons. In assessing the compactness of the network as a whole, the characteristic path length L, defined as the average number of monosynaptic connections in the shortest path connecting two cells, is an important metric to consider. Because the travel time of a signal between two spatially remote locations should not be prohibitively long to maintain synchrony across the entirety of the network, the characteristic path length L sets an upper threshold on the maximum number of synaptic relays between two distant neurons. Together, these variables quantitatively assess network structure relevant to synchrony, and therefore allow objective comparisons to be made between normal and pathological networks (Stam 2014).
Achieving Small Worldness: High Clustering and Short Path Length, and Highly Connected Nodes
The small-world phenomenon is commonly used to describe a network that has rich local and global connections—a high clustering coefficient C as well as a small characteristic path length L (Watts and Strogatz 1998). One method to obtain a small-world network via random connections is through dense connectivity (Wang and Buzsáki 1996), but an issue that arises is that a prohibitively large number of long-range connections are required for network synchronization. This problem becomes particularly relevant for large networks because of the fact that total wiring length grows linearly with the number of neurons in the network, so connection density comes at the cost of wiring efficiency (Buzsáki et al. 2004).
So, how can a network show the small-world property while avoiding extensive use of costly long-range connections? An elegant solution was proposed first by Watts and Strogatz (1998). They considered the case of a regular network with exclusively local connections, in which each node is connected only to its k closest spatial neighbors. They found that when this network is minimally modified by randomizing a small fraction of the local connections (with probability p < 0.05, each connection from a given node to one of its neighbors was modified to target a neuron randomly selected across the entire network), the small-world property naturally emerges. This elegantly introduced the idea that a network with mostly local connections and a small number of highly connected “outlier” nodes can be sufficient to endow the network with dynamic properties reminiscent of those observed in cortical assemblies.
Experimental Evidence of Cortical Small-World Networks and “Hub” Cells
A particularly interesting feature of the network theoretical approach is that it does not require detailed neuroanatomical assumptions, and yet provides testable predictions that can guide and complement experimental manipulations. A brain region in which the predictions of network theory (Morgan and Soltesz 2008) have been tested is the developing hippocampus (Bonifazi et al. 2009). The developing hippocampus has been a system of choice because large-scale network synchronizations can be measured as giant depolarizing potentials (Ben-Ari 2001), and also because the network underlying the generation of these synchronizations is confined locally to the hippocampal CA3 region in slices (Menendez de la Prida and Sanchez-Andres 2000), permitting a more straightforward experimental strategy. As an additional benefit, the hippocampus in general is highly studied and well characterized for many areas of study, including in epilepsy. Analyzing calcium activity of the dentate gyrus, CA3 and CA1 regions in the developing hippocampus of rats and mice in vitro slices, Bonifazi and colleagues drew a functional connectivity map of several hundreds of neurons. They showed the existence of essentially two populations: a large population of weakly interconnected, neighboring neurons and a small, special population of cells with high connectivity (Bonifazi et al. 2009).
By performing simultaneous single-cell stimulations and multineuron calcium activity recordings, it was found that, although perturbations applied to weakly connected neurons did not affect the large-scale dynamics of the network, stimulation of a small number of the highly connected neurons triggered network-wide synchrony (Bonifazi et al. 2009). Interestingly, when the cells were “fate mapped” via genetic markers to determine the details of their origin, it was discovered that a subpopulation of these distinctively influential cells were born very early during embryonic stages and survived into adulthood (Picardo et al. 2011; Marissal et al. 2012). These super-connected cells, therefore, seem to play a key role in neural development and maturation, and they continue to powerfully modulate large-scale network dynamics in the adult brain (Picardo et al. 2011; Marissal et al. 2012).
These studies strongly suggest that the organization of cortical circuits is indeed governed by the same universal properties as other large-scale networks—it aims primarily to optimize the flow of information and resources used (Buzsáki et al. 2004; Bullmore and Sporns 2009). Importantly, it also illustrates that a small population of superconnected neurons are endowed with the capability of influencing and even coordinating the dynamics of remote microcircuits. “Hub” is now a prevailing term to designate such neurons, as they share the common characteristics of high anatomical connectivity and the ability to orchestrate synchronicity of a large population of cells (Bonifazi et al. 2009; Picardo et al. 2011; Marissal et al. 2012; Cossart 2014). In the context of epilepsy, hub cells may be thought of as a “microscopic epileptic focus” or a relatively small group of cells that can control and coordinate microcircuits and recruit larger macrocircuits to lead to generalized seizure activity.
DATA-DRIVEN COMPUTATIONAL MODELS TO UNCOVER THE EFFECTS OF MICROCIRCUIT ALTERATIONS IN EPILEPSY: SMALL WORLDNESS AND HUB NEURONS IN THE EPILEPTIC HIPPOCAMPAL DENTATE GYRUS
Descriptive network models provide useful, simplified frameworks to understand the connection between a given topological organization and the dynamics of neuronal assemblies (Sporns 2014). To also incorporate detailed, biologically relevant data, including intrinsic neuronal electrophysiological properties, and to model how alterations in these properties and in the microcircuitry can affect network activity, computational modeling is becoming an increasingly important tool to tease apart the numerous changes that contribute to epilepsy and epileptogenesis. One brain region of particular interest in the field of epilepsy has been the hippocampal dentate gyrus, which undergoes complex structural and functional transformations in chronic epilepsy and in epileptogenesis (Santhakumar et al. 2005; Case and Soltesz 2011). “End-folium sclerosis” refers to these alterations that occur to the dentate gyrus in association with temporal lobe epilepsy, and includes two hallmark changes: hilar cell loss and mossy fiber (granule cell axon) sprouting (Sanchez et al. 2012). The link between these microcircuit changes and ictal activity has been highlighted in a series of computational studies seeking to uncover how newly sprouted mossy fiber rewiring and hilar cell loss lead to increased dentate hyperexcitability (Lytton et al. 1998; Howard et al. 2007; Thomas et al. 2010; Tejada and Roque 2014).
Interestingly, results from data-driven, computational simulations indicate that the healthy hippocampal dentate gyrus has characteristics of a well-connected, small-world network (Dyhrfjeld-Johnsen et al. 2007). Additionally, the implementation of progressive levels of end-folium sclerosis (simulated in the models as mossy fiber sprouting and hilar cell loss) had the surprising effect of further increasing small worldness of the network at submaximal levels of sclerosis, therefore leading to increased network hyperexcitability (Santhakumar et al. 2005; Dyhrfjeld-Johnsen et al. 2007; Morgan and Soltesz 2008). Despite the loss of large proportions of highly connected hilar mossy cells and interneurons, which would be expected to severely reduce network connectivity globally, pathologic mossy fiber sprouting locally was able to compensate (in a network theory sense) for the hilar cell loss. In fact, mossy fiber sprouting was sufficient to spread activity coming from the cortex to the entire network of granule cells (Santhakumar et al. 2005; Dyhrfjeld-Johnsen et al. 2007).
However, at higher levels of sclerosis, the robust activity amplifying effects of granule cell axon sprouting could not sufficiently compensate for the loss of long-range projecting, globally connected mossy cells, leading ultimately to the transition of the hippocampal dentate gyrus to a more regular network (Dyhrfjeld-Johnsen et al. 2007). This shift is seen at 80% granule cell axon sprouting and mossy cell loss, when the dentate gyrus model network reaches a maximum level of hyperexcitability. These results not only support the functional role of network topology, but are also consistent with observations from tissue samples from patients with particularly pharmacoresistant forms of temporal lobe epilepsy, where cell counts reveal an average loss of only ∼80% of hilar mossy cells in the hippocampus, even in the most severe cases of end-folium sclerosis (Blümcke et al. 2000; Gabriel et al. 2004).
Demonstration of the epileptic dentate gyrus as an enhanced small-world network also raises the issue of the existence of putative hubs in the dentate network in epilepsy. Because of the potentially central nature of hub neurons in synchronization of the network, changes in topology that affect hubs are likely to have important consequences on the dynamics of the neuronal assembly. However, to what extent are hypersynchronous discharges attributable to aberrant connections involving newly formed or existing hub cells? Functional computational models simulating new, pathological granule cell-to-granule cell connections in several biologically plausible ways showed that, although random connections between newly sprouted mossy fibers displayed no significant effect on the network (Fig. 2B) (Morgan and Soltesz 2008), the incorporation of only 5% of richly connected (four to seven times more connected) granule cells was sufficient to substantially increase dentate excitability (Fig. 2A,C) (Morgan and Soltesz 2008). These highly interconnected cells acted as hubs in the network that propagated and amplified activity. Although experimental evidence of operational hub cells in epilepsy remains an open question, this study emphasizes the enormous consequences of the pathological development of only a few highly connected cells in the dentate gyrus network (Morgan and Soltesz 2008).
Figure 2.
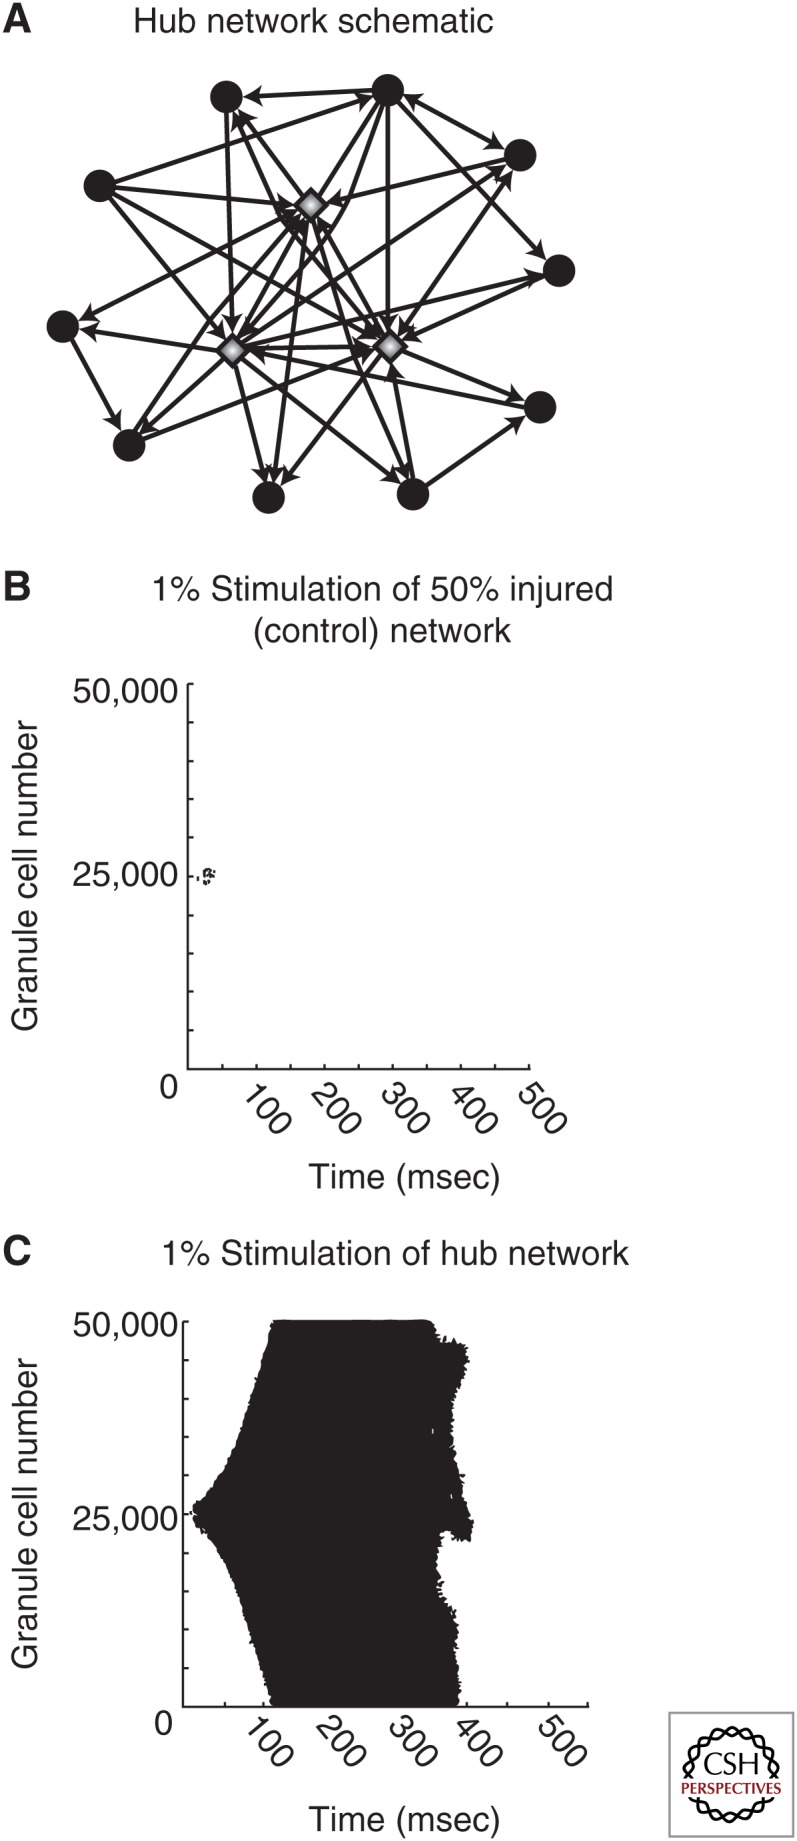
Granule cell hubs greatly increase dentate network excitability. (A) Schematic of a hub network. Granule cell hubs (gray diamonds) are four- to sevenfold more highly connected compared with average granule cells (black circles). (B and C) Raster plots of granule cell activity in a moderately injured dentate network (50% hilar cell loss, 50% of maximal mossy fiber sprouting) following perforant path stimulation to 1% of the cell population, where (B) new granule cell-to-granule cell connections are made randomly or (C) 5% of the granule cells serve as hubs. (From Morgan and Soltesz 2008; adapted, with permission, from the authors.)
OPTOGENETIC TARGETING OF SPECIFIC CIRCUITS IN EPILEPSY
Applications of Optogenetics in Closed-Loop Seizure Detection and Control
Considering the complexity of epilepsy, more complete understanding of the circuits involved would greatly aid the development of newer treatments that have increased specificity, minimal invasiveness, and few side effects, while maintaining the ability to treat a wide range of epilepsies. With the emergence of a powerful technique called optogenetics, it has become possible to better elucidate the microcircuits involved in epilepsy by allowing unprecedented cell-specific, spatial, and temporal control of neural activity (Aravanis et al. 2007; Boyden 2011; Deisseroth 2011). By targeting expression of ion-conducting opsins, which can either depolarize or hyperpolarize neurons when stimulated by light, previously unattainable goals, such as the modulation of the activity of only one cell population in a small area of the brain, is now possible (Deisseroth 2011). In a very short time, optogenetics has led to tremendous progress in understanding the complex neural circuitry and the precise functional consequences of circuit alterations. Furthermore, the repertoire of optogenetic tools is ever expanding to include opsins with altered ion specificity and increased effectiveness (Berndt et al. 2014; Chuong et al. 2014), and this technology is being used to research possible treatments for a multitude of neurological disorders, including epilepsy, Parkinson’s disease, and Alzheimer’s disease (Gradinaru et al. 2009; Krook-Magnuson and Soltesz 2015; Yamamoto et al. 2015).
By using optogenetics to control the activity of specific circuits, important discoveries have been made regarding the circuits involved in epileptiform activity in in vitro and in vivo seizure or epilepsy models (Tønnesen et al. 2009; Kokaia 2011; Wykes et al. 2012; Armstrong et al. 2013; Krook-Magnuson et al. 2013, 2014; Paz et al. 2013; Rossignol et al. 2013; Sukhotinsky et al. 2013; Berglind et al. 2014; Ledri et al. 2014). Soon after early experiments showing optogenetic control of seizure-like events in hippocampal culture preparations (Tønnesen et al. 2009), several in vivo studies showed that optogenetics can be used to manipulate specific neuronal circuits within rodent models of epilepsy to control seizures (Wykes et al. 2012; Armstrong et al. 2013; Krook-Magnuson et al. 2013, 2014; Paz et al. 2013). Their success in stopping or delaying seizure progression by using optogenetics to inhibit a small percentage of principal cells indicated the potential for optogenetics as a promising therapeutic in epilepsy.
A key aspect of using optogenetics in seizure suppression is the temporal control that allows the manipulation of neural activity only during seizure events. This requires use of closed-loop seizure-detection systems, in which seizures are recorded in real time and light is delivered in response to seizures. Closed-loop seizure-detection systems have been used to respond to seizures in real time with electrical stimulation, but such techniques cannot specifically target microcircuits and instead affect many cell types as well as neighboring areas of the brain (Osorio et al. 2005; Liang et al. 2011; Nelson et al. 2011; Berényi et al. 2012). With optogenetics, however, recent studies revealed that closed-loop optogenetic intervention can significantly stop seizures in rodent models of epilepsy by targeting appropriate local or even long-range connections to the seizure focus (Krook-Magnuson et al. 2013, 2014; Paz et al. 2013). In particular, the ability to target long-range connections permits a powerful way to intervene, especially in cases in which the seizure focus is in an inaccessible area of the brain. In studies of temporal lobe epilepsy, targeting hippocampal neurons contralateral to the seizure focus was as effective at suppressing seizures as intervening at the focus itself (Krook-Magnuson et al. 2013). Even more surprising, optogenetic modulation of a structure as physically distant as the cerebellum could also control seizures originating in the hippocampus (Krook-Magnuson et al. 2014), showing that perhaps there are certain “gates” or “chokepoints” that can be effective in optogenetic suppression of seizures. This phenomenon is not limited to seizures in temporal lobe epilepsy, as it has been shown that seizures arising from cortical stroke could be controlled by optogenetically targeting long-range thalamic connections to the cortex (Paz et al. 2013).
Until this point, most of the work applying optogenetics to rodent models of epilepsy relied heavily on using the inhibitory chloride pump halorhodopsin to suppress the activity of principal cells (Fig. 3A–E) (Krook-Magnuson et al. 2013). Would targeting of GABAergic cells, a much smaller population, be equally effective at controlling seizures? Interestingly, when the excitatory cation channel channelrhodopsin was expressed only in parvalbumin-expressing interneurons and light stimulus was applied within a small area of the hippocampus, this was effective in stopping a significant number of spontaneous seizures—both electrographic and behavioral (Fig. 3F–I) (Krook-Magnuson et al. 2013). These findings have important implications, especially because parvalbumin-expressing neurons make up a very small percentage of the hippocampal neuronal population, so optogenetic stimulation affected <5% of cells exposed to light and yet was still able to effectively prevent behavioral seizures (Krook-Magnuson et al. 2013).
Figure 3.

Optogenetic suppression of neural activity in the hippocampus controls spontaneous seizure activity in the unilateral intrahippocampal kainate model of temporal lobe epilepsy. (A) To produce animals expressing halorhodopsin (HR) within excitatory neurons, CamKII-Cre animals were crossed with those carrying Cre-dependent HR. (B) Example of electrographic seizures detected (vertical green line) in Cam-HR mice, triggering delivery of no light or amber light (589 nm) to the hippocampus, as indicated by the amber line. (C–D) Data from Cam-HR mice showing the percentage of seizures that stop (C) within 5 sec of light stimulus, or (D) within 1 sec of light stimulus. (E) The normalized postdetection seizure duration. (F) To produce animals expressing channelrhodopsin (ChR2) within inhibitory neurons, animals expressing parvalbumin (PV)-Cre were crossed with those expressing Cre-dependent ChR2. (G) Example of electrographic seizures detected in PV-ChR2 mice, triggering the delivery of no light or blue light (473 nm), as indicated by the blue bar. (H–I) Data from PV-ChR2 mice showing (H) the percentage of seizures that stop within 5 sec of light stimulus, and (I) the normalized postdetection seizure duration. Error bars, s.e.m. (From Krook-Magnuson et al. 2013; adapted, with permission, from the authors.)
Future Challenges and Directions of Optogenetic Application to Epilepsy
These studies show that closed-loop optogenetic intervention of seizures is a promising technique that may have applications for therapeutics in the future. As an extension of these studies, if optogenetic intervention can be achieved by targeting hub cells, which are theoretically an even smaller population of neurons that can centrally control brain activity, the “footprint” caused by altering the normal composition of neurons will be very small. For example, mossy cells in the hilus of the hippocampus are known to have extensive connections to other hippocampal neurons (one mossy cell projects onto >30,000 granule cells) (Dyhrfjeld-Johnsen et al. 2007), and may represent an important target for seizure suppression, in which modulation of just a few hub cells would be sufficient to control seizures while minimally interfering with normal brain functions.
Although the current achievements in treating seizure propagation using careful optogenetic control of neural microcircuits are remarkable, at this point, a true translation of optogenetics to epilepsy treatment will require much groundwork in controlled optogenetic expression and less invasive light delivery systems. As shown in many rodent model studies, viral vectors are currently the most effective method of introducing opsins into the brain (Ji and Neugebauer 2012; Bentley et al. 2013), but current use of viral vectors in patients is limited, although promising advances in gene therapy continue to be made in the treatment of neurological conditions, such as Parkinson’s disease (Bartus et al. 2014). Although current methods of light delivery to activate opsins in rodent models involve directing optical fibers into the brain, new opsins have been developed that can be transcranially stimulated in rodents, eliminating the need for intracranial optical fiber implants (Chuong et al. 2014). As both the field of optogenetics and the study of potential hub cells in epilepsy move forward, there is certainly a possibility that there will someday be safe and controlled methods to express opsins in specific neuronal circuit components in patients, along with safe and long-lasting methods to deliver light to these cells.
CONCLUDING REMARKS
Many advances have been made in dissecting the complex microcircuit changes in epilepsy with the use of powerful techniques that allow visualization, recording, and manipulation of specific populations of neurons. However, more progress needs to be made to fully understand what causes the abnormal circuit connections in epilepsy. For example, hub cells in epilepsy are still yet to be identified in vivo, and it is still not fully understood how neural circuits are recruited during seizures.
To answer these questions, innovative methods are constantly being developed and continue to add to our growing knowledge of this serious and prevalent disorder. Super-resolution microscopy is a major advancement that allows visualization of single ion channels and receptors (Dani et al. 2010; Testa et al. 2012; Dudok et al. 2014), and has great potential to improve our understanding of how changes in the number, activity, and localization of these proteins deregulate local network activity and contribute to seizures. The development of miniaturized microscopes that can be implanted to observe cell dynamics during freely moving behavior (Wilt et al. 2009; Ghosh et al. 2011; Ziv et al. 2013) has provided opportunities to study microcircuit alterations in chronically epileptic animals. New optogenetic tools are also expanding at an astounding pace—opsins that are more sensitive or have different channel dynamics are allowing for even finer manipulation of network activity (Chuong et al. 2014; Dhakal et al. 2014; Hochbaum et al. 2014; McIsaac et al. 2014). As experimental methods progress, computational tools for modeling neural networks likewise continue to become more complex and powerful. There have been important advances in large-scale modeling of the hippocampal networks (Case et al. 2012; Schneider et al. 2012, 2014; Bezaire and Soltesz 2013), which can give insights into cellular and circuit alterations that may lead to synchronous activity and seizures, improving and guiding experimental designs. These efforts to elucidate the microcircuitry underlying the generation and recurrence of epileptic activity will continue to open avenues in the development of increasingly specific and effective treatments for this complex neurological disorder.
ACKNOWLEDGMENTS
This work is funded by U.S. National Institutes of Health (NIH) Grants NS35915 and NS74702 (I.S.), F31NS086429 (A.B.), and T32NS45440 (H.K.).
Footnotes
Editors: Gregory L. Holmes and Jeffrey L. Noebels
Additional Perspectives on Epilepsy: The Biology of a Spectrum Disorder available at www.perspectivesinmedicine.org
REFERENCES
- Aravanis AM, Wang LP, Zhang F, Meltzer LA, Mogri MZ, Schneider MB, Deisseroth K. 2007. An optical neural interface: In vivo control of rodent motor cortex with integrated fiberoptic and optogenetic technology. J Neural Eng 4: S143–S156. [DOI] [PubMed] [Google Scholar]
- Armstrong C, Krook-Magnuson E, Oijala M, Soltesz I. 2013. Closed-loop optogenetic intervention in mice. Nat Protoc 8: 1475–1493. [DOI] [PMC free article] [PubMed] [Google Scholar]
- Bartus RT, Weinberg MS, Samulski RJ. 2014. Parkinson’s disease gene therapy: Success by design meets failure by efficacy. Mol Ther 22: 487–497. [DOI] [PMC free article] [PubMed] [Google Scholar]
- Ben-Ari Y. 2001. Developing networks play a similar melody. Trends Neurosci 24: 353–360. [DOI] [PubMed] [Google Scholar]
- Bentley JN, Chestek C, Stacey WC, Patil PG. 2013. Optogenetics in epilepsy. Neurosurg Focus 34: E4. [DOI] [PubMed] [Google Scholar]
- Berényi A, Belluscio M, Mao D, Buzsáki G. 2012. Closed-loop control of epilepsy by transcranial electrical stimulation. Science 337: 735–737. [DOI] [PMC free article] [PubMed] [Google Scholar]
- Berglind F, Ledri M, Sørensen AT, Nikitidou L, Melis M, Bielefeld P, Kirik D, Deisseroth K, Andersson M, Kokaia M. 2014. Optogenetic inhibition of chemically induced hypersynchronized bursting in mice. Neurobiol Dis 65: 133–141. [DOI] [PubMed] [Google Scholar]
- Berndt A, Lee SY, Ramakrishnan C, Deisseroth K. 2014. Structure-guided transformation of channelrhodopsin into a light-activated chloride channel. Science 344: 420–424. [DOI] [PMC free article] [PubMed] [Google Scholar]
- Bezaire MJ, Soltesz I. 2013. Quantitative assessment of CA1 local circuits: Knowledge base for interneuron–pyramidal cell connectivity. Hippocampus 23: 751–785. [DOI] [PMC free article] [PubMed] [Google Scholar]
- Blümcke I, Suter B, Behle K, Kuhn R, Schramm J, Elger CE, Wiestler OD. 2000. Loss of hilar mossy cells in Ammon’s horn sclerosis. Epilepsia 41: S174–S180. [DOI] [PubMed] [Google Scholar]
- Bonifazi P, Goldin M, Picardo MA, Jorquera I, Cattani A, Bianconi G, Represa A, Ben-Ari Y, Cossart R. 2009. GABAergic hub neurons orchestrate synchrony in developing hippocampal networks. Science 326: 1419–1424. [DOI] [PubMed] [Google Scholar]
- Boyden ES. 2011. Optogenetics: Using light to control the brain. Cerebrum 2011: 16. [PMC free article] [PubMed] [Google Scholar]
- Brun VH, Otnass MK, Molden S, Steffenach HA, Witter MP, Moser MB, Moser EI. 2002. Place cells and place recognition maintained by direct entorhinal–hippocampal circuitry. Science 296: 2243–2246. [DOI] [PubMed] [Google Scholar]
- Bullmore E, Sporns O. 2009. Complex brain networks: Graph theoretical analysis of structural and functional systems. Nat Rev Neurosci 10: 186–198. [DOI] [PubMed] [Google Scholar]
- Buzsáki G, Draguhn A. 2004. Neuronal oscillations in cortical networks. Science 304: 1926–1929. [DOI] [PubMed] [Google Scholar]
- Buzsáki G, Geisler C, Henze DA, Wang XJ. 2004. Interneuron diversity series: Circuit complexity and axon wiring economy of cortical interneurons. Trends Neurosci 27: 186–193. [DOI] [PubMed] [Google Scholar]
- Buzsáki G, Anastassiou CA, Koch C. 2012. The origin of extracellular fields and currents—EEG, ECoG, LFP and spikes. Nat Rev Neurosci 13: 407–420. [DOI] [PMC free article] [PubMed] [Google Scholar]
- Case M, Soltesz I. 2011. Computational modeling of epilepsy. Epilepsia 52: 12–15. [DOI] [PMC free article] [PubMed] [Google Scholar]
- Case MJ, Morgan RJ, Schneider CJ, Soltesz I. 2012. Computer modeling of epilepsy. In Jasper’s basic mechanisms of the epilepsies, 4th ed. (ed. Noebels JL, et al. ). National Center for Biotechnology Information, Bethesda, MD. [PubMed] [Google Scholar]
- Chuong AS, Miri ML, Busskamp V, Matthews GAC, Acker LC, Sørensen AT, Young A, Klapoetke NC, Henninger MA, Kodandaramaiah SB, et al. 2014. Noninvasive optical inhibition with a red-shifted microbial rhodopsin. Nat Neurosci 17: 1123–1129. [DOI] [PMC free article] [PubMed] [Google Scholar]
- Cossart R. 2014. Operational hub cells: A morpho-physiologically diverse class of GABAergic neurons united by a common function. Curr Opin Neurobiol 26: 51–56. [DOI] [PubMed] [Google Scholar]
- Coulter DA, Yue C, Ang CW, Weissinger F, Goldberg E, Hsu FC, Carlson GC, Takano H. 2011. Hippocampal microcircuit dynamics probed using optical imaging approaches. J Physiol 589: 1893–1903. [DOI] [PMC free article] [PubMed] [Google Scholar]
- Cymerblit-Sabba A, Schiller Y. 2010. Network dynamics during development of pharmacologically induced epileptic seizures in rats in vivo. J Neurosci 30: 1619–1930. [DOI] [PMC free article] [PubMed] [Google Scholar]
- Dani A, Huang B, Bergan J, Dulac C, Zhuang X. 2010. Superresolution imaging of chemical synapses in the brain. Neuron 68: 843–856. [DOI] [PMC free article] [PubMed] [Google Scholar]
- Deisseroth K. 2011. Optogenetics. Nat Methods 8: 26–29. [DOI] [PMC free article] [PubMed] [Google Scholar]
- Dhakal KR, Gu L, Shivalingaiah S, Dennis TS, Morris-Bobzean SA, Li T, Perrotti LI, Mohanty SK. 2014. Non-scanning fiber-optic near-infrared beam led to two-photon optogenetic stimulation in-vivo. PLoS ONE 9: e111488. [DOI] [PMC free article] [PubMed] [Google Scholar]
- Dudok B, Barna L, Ledri M, Szabo SI, Szabaditis E, Pinter B, Woodhams SG, Henstridge CM, Balla GY, Nyilas R, et al. 2014. Cell type-specific STORM superresolution imaging reveals nanoscale organization of cannabinoid signaling at hippocampal GABAergic synapses. Nat Neurosci 18: 75–86. [DOI] [PMC free article] [PubMed] [Google Scholar]
- Dyhrfjeld-Johnsen J, Santhakumar V, Morgan RJ, Huerta R, Tsimring L, Soltesz I. 2007. Topological determinants of epileptogenesis in large-scale structural and functional models of the dentate gyrus derived from experimental data. J Neurophysiol 97: 1566–1587. [DOI] [PubMed] [Google Scholar]
- Feldt Muldoon S, Soltesz I, Cossart R. 2013. Spatially clustered neuronal assemblies comprise the microstructure of synchrony in chronically epileptic networks. Proc Natl Acad Sci 10: 3567–3572. [DOI] [PMC free article] [PubMed] [Google Scholar]
- Fornito A, Zalesky A, Breakspear M. 2013. Graph analysis of the human connectome: Promise, progress, and pitfalls. NeuroImage 80: 426–444. [DOI] [PubMed] [Google Scholar]
- Fries P. 2009. Neuronal γ-band synchronization as a fundamental process in cortical computation. Annu Rev Neurosci 32: 209–224. [DOI] [PubMed] [Google Scholar]
- Gabriel S, Njunting M, Pomper JK, Merschhemke M, Sanabria ERG, Eilers A, Kivi A, Zeller M, Meencke HJ, Cavalheiro EA, et al. 2004. Stimulus and potassium-induced epileptiform activity in the human dentate gyrus from patients with and without hippocampal sclerosis. J Neurosci 24: 10416–10430. [DOI] [PMC free article] [PubMed] [Google Scholar]
- Ghosh KK, Burns LD, Cocker ED, Nimmerjahn A, Ziv Y, Gamal AE, Schnitzer MJ. 2011. Miniaturized integration of a fluorescence microscope. Nat Methods 8: 871–878. [DOI] [PMC free article] [PubMed] [Google Scholar]
- Gradinaru V, Mogri M, Thompson KR, Henderson JM, Deisseroth K. 2009. Optical deconstruction of parkinsonian neural circuitry. Science 324: 354–359. [DOI] [PMC free article] [PubMed] [Google Scholar]
- Hochbaum DR, Zhao Y, Farhi SL, Klapoetke N, Werley CA, Kapoor V, Zou P, Kralj JM, Maclaurin D, Smedemark-Margulies N, et al. 2014. All-optical electrophysiology in mammalian neurons using engineered microbial rhodopsins. Nat Methods 11: 825–833. [DOI] [PMC free article] [PubMed] [Google Scholar]
- Howard AL, Neu A, Morgan RJ, Echegoyen JC, Soltesz I. 2007. Opposing modifications in intrinsic currents and synaptic inputs in post-traumatic mossy cells: Evidence for single-cell homeostasis in a hyperexcitable network. J Neurophysiol 97: 2394–2409. [DOI] [PubMed] [Google Scholar]
- Ji G, Neugebauer V. 2012. Modulation of medial prefrontal cortical activity using in vivo recordings and optogenetics. Mol Brain 5: 36. [DOI] [PMC free article] [PubMed] [Google Scholar]
- Keller CJ, Truccolo W, Gale JT, Eskandar E, Thesen T, Carlson C, Devinsky O, Kuzniecky R, Doyle WK, Madsen JR, et al. 2010. Heterogeneous neuronal firing patterns during interictal epileptiform discharges in the human cortex. Brain 133: 1668–1681. [DOI] [PMC free article] [PubMed] [Google Scholar]
- Kokaia M. 2011. Light-activated channels in acute seizures. Epilepsia 52: 16–18. [DOI] [PubMed] [Google Scholar]
- Kramer MA, Eden UT, Kolaczyk ED, Zepeda R, Eskandar EN, Cash SS. 2010. Coalescence and fragmentation of cortical networks during focal seizures. J Neurosci 30: 10076–10085. [DOI] [PMC free article] [PubMed] [Google Scholar]
- Krook-Magnuson E, Armstrong C, Oijala M, Soltesz I. 2013. On-demand optogenetic control of spontaneous seizures in temporal lobe epilepsy. Nat Commun 4: 1376. [DOI] [PMC free article] [PubMed] [Google Scholar]
- Krook-Magnuson E, Szabo GG, Armstrong C, Oijala M, Soltesz I. 2014. Cerebellar directed optogenetic intervention inhibits spontaneous hippocampal seizures in a mouse model of temporal lobe epilepsy. eNeuro 1: e2014. [DOI] [PMC free article] [PubMed] [Google Scholar]
- Krook-Magnuson E, Soltesz I. 2015. Beyond the hammer and the scalpel: Selective circuit control for the epilepsies. Nat Rev Neurosci 18: 331–338. [DOI] [PMC free article] [PubMed] [Google Scholar]
- Ledri M, Madsen MG, Nikitidou L, Kirik D, Kokaia M. 2014. Global optogenetic activation of inhibitory interneurons during epileptiform activity. J Neurosci 34: 3364–3377. [DOI] [PMC free article] [PubMed] [Google Scholar]
- Liang SF, Liao YC, Shaw FZ, Chang DW, Young CP, Chiueh H. 2011. Closed-loop seizure control on epileptic rat models. J Neural Eng 8: 045001–045010. [DOI] [PubMed] [Google Scholar]
- Lytton WW, Hellman KM, Sutula TP. 1998. Computer models of hippocampal circuit changes of the kindling model of epilepsy. Artif Intell Med 13: 81–97. [DOI] [PubMed] [Google Scholar]
- Mansouri A, Fallah A, Valiante TA. 2012. Determining surgical candidacy in temporal lobe epilepsy. Epilepsy Res Treat 2012: 1–16. [DOI] [PMC free article] [PubMed] [Google Scholar]
- Marissal T, Bonifazi P, Picardo MA, Nardou R, Petit LF, Baude A, Fishell GJ, Ben-Ari Y, Cossart R. 2012. Pioneer glutamatergic cells develop into a morpho-functionally distinct population in the juvenile CA3 hippocampus. Nat Commun 3: 1316. [DOI] [PMC free article] [PubMed] [Google Scholar]
- McIsaac RS, Engqvist MKM, Wannier T, Rosenthal AZ, Herwig L, Flytzanis NC, Imasheva ES, Lanyi JK, Balashov SP, Gradinaru V, et al. 2014. Directed evolution of a far-red fluorescent rhodopsin. Proc Natl Acad Sci 111: 13034–13039. [DOI] [PMC free article] [PubMed] [Google Scholar]
- Menendez de la Prida L, Sanchez-Andres JV. 2000. Heterogeneous populations of cells mediate spontaneous synchronous bursting in the developing hippocampus through a frequency-dependent mechanism. Neuroscience 97: 227–241. [DOI] [PubMed] [Google Scholar]
- Morgan RJ, Soltesz I. 2008. Nonrandom connectivity of the epileptic dentate gyrus predicts a major role for neuronal hubs in seizures. Proc Natl Acad Sci 105: 6179–6184. [DOI] [PMC free article] [PubMed] [Google Scholar]
- Mormann F, Kreuz T, Andrzejak RG, David P, Lehnertz K, Elger CE. 2003. Epileptic seizures are preceded by a decrease in synchronization. Epilepsy Res 53: 173–185. [DOI] [PubMed] [Google Scholar]
- Nelson TS, Suhr CL, Freestone DR, Lai A, Halliday AJ, McLean KJ, Burkitt AN, Cook MJ. 2011. Closed-loop seizure control with very high frequency electrical stimulation at seizure onset in the GAERS model of absence epilepsy. Int J Neural Syst 21: 163–173. [DOI] [PubMed] [Google Scholar]
- Netoff TI, Schiff SJ. 2002. Decreased neuronal synchronization during experimental seizures. J Neurosci 22: 7297–7307. [DOI] [PMC free article] [PubMed] [Google Scholar]
- Osorio I, Frei MG, Sunderam S, Giftakis J, Bhavaraju NC, Schaffner SF, Wilkinson SB. 2005. Automated seizure abatement in humans using electrical stimulation. Ann Neurol 57: 258–268. [DOI] [PubMed] [Google Scholar]
- Paz JT, Davidson TJ, Frechette ES, Delord B, Parada I, Peng K, Deisseroth K, Huguenard JR. 2013. Closed-loop optogenetic control of thalamus as a tool for interrupting seizures after cortical injury. Nat Neurosci 16: 64–70. [DOI] [PMC free article] [PubMed] [Google Scholar]
- Penfield W, Jasper H. 1954. Epilepsy and the functional anatomy of the human brain. Little Brown, Boston. [Google Scholar]
- Picardo MA, Guigue P, Bonifazi P, Batista-Brito R, Allene C, Ribas A, Fishell G, Baude A, Cossart R. 2011. Pioneer GABA cells comprise a subpopulation of hub neurons in the developing hippocampus. Neuron 71: 695–709. [DOI] [PMC free article] [PubMed] [Google Scholar]
- Rochefort NL, Jia H, Konnerth A. 2008. Calcium imaging in the living brain: Prospects for molecular medicine. Trends Mol Med 14: 389–399. [DOI] [PubMed] [Google Scholar]
- Rossignol E, Kruglikov I, van den Maagdenberg AMJM, Rudy B, Fishell G. 2013. CaV2.1 ablation in cortical interneurons selectively impairs fast-spiking basket cells and causes generalized seizures. Ann Neurol 74: 209–222. [DOI] [PMC free article] [PubMed] [Google Scholar]
- Sabolek HR, Swiercz WB, Lillis KP, Cash SS, Huberfeld G, Zhao G, Ste Marie L, Clemenceau S, Barsh G, Miles R, et al. 2012. A candidate mechanism underlying the variance of interictal spike propagation. J Neurosci 32: 3009–3021. [DOI] [PMC free article] [PubMed] [Google Scholar]
- Sanchez RM, Ribak CE, Shapiro LA. 2012. Synaptic connections of hilar basal dendrites of dentate granule cells in a neonatal hypoxia model of epilepsy. Epilepsia 53: 98–108. [DOI] [PubMed] [Google Scholar]
- Santhakumar V, Aradi I, Soltesz I. 2005. Role of mossy fiber sprouting and mossy cell loss in hyperexcitability: A network model of the dentate gyrus incorporating cell types and axonal topography. J Neurophysiol 93: 437–453. [DOI] [PubMed] [Google Scholar]
- Schneider CJ, Bezaire M, Soltesz I. 2012. Toward a full-scale computational model of the rat dentate gyrus. Front Neural Circuits 6: 83. [DOI] [PMC free article] [PubMed] [Google Scholar]
- Schneider CJ, Cuntz H, Soltesz I. 2014. Linking macroscopic with microscopic neuroanatomy using synthetic neuronal populations. PLoS Comput Biol 10: e1003921. [DOI] [PMC free article] [PubMed] [Google Scholar]
- Smith SJM. 2005. EEG in the diagnosis, classification, and management of patients with epilepsy. J Neurol Neurosurg Psychiatry 76: ii2–ii7. [DOI] [PMC free article] [PubMed] [Google Scholar]
- Sporns O. 2013. Structure and function of complex brain networks. Dialogues Clin Neurosci 15: 247–262. [DOI] [PMC free article] [PubMed] [Google Scholar]
- Sporns O. 2014. Contributions and challenges for network models in cognitive neuroscience. Nat Neurosci 17: 652–660. [DOI] [PubMed] [Google Scholar]
- Stam CJ. 2014. Modern network science of neurological disorders. Nat Rev Neurosci 15: 683–695. [DOI] [PubMed] [Google Scholar]
- Sukhotinsky I, Chan AM, Ahmed OJ, Rao VR, Gradinaru V, Ramakrishnan C, Deisseroth K, Majewska AK, Cash SS. 2013. Optogenetic delay of status epilepticus onset in an in vivo rodent epilepsy model. PLoS ONE 8: e62013. [DOI] [PMC free article] [PubMed] [Google Scholar]
- Tejada J, Roque AC. 2014. Computational models of dentate gyrus with epilepsy-induced morphological alterations in granule cells. Epilepsy Behav 38: 63–70. [DOI] [PubMed] [Google Scholar]
- Telesford QK, Simpson SL, Burdette JH, Hayasaka S, Laurienti PJ. 2011. The brain as a complex system: Using network science as a tool for understanding the brain. Brain Connect 1: 295–308. [DOI] [PMC free article] [PubMed] [Google Scholar]
- Testa I, Urban NT, Jakobs S, Eggeling C, Willig KI, Hell SW. 2012. Nanoscopy of living brain slices with low light levels. Neuron 75: 992–1000. [DOI] [PubMed] [Google Scholar]
- Thomas EA, Reid CA, Petrou S. 2010. Mossy fiber sprouting interacts with sodium channel mutations to increase dentate gyrus excitability. Epilepsia 51: 136–145. [DOI] [PubMed] [Google Scholar]
- Tønnesen J, Sørensen AT, Deisseroth K, Lundberg C, Kokaia M. 2009. Optogenetic control of epileptiform activity. Proc Natl Acad Sci 106: 12162–12167. [DOI] [PMC free article] [PubMed] [Google Scholar]
- Truccolo W, Donoghue JA, Hochberg LR, Eskandar EN, Madsen JR, Anderson WS, Brown EN, Halgren E, Cash SS. 2011. Single-neuron dynamics in human focal epilepsy. Nat Neurosci 14: 635–641. [DOI] [PMC free article] [PubMed] [Google Scholar]
- Van Mierlo P, Papadopoulou M, Carrette E, Boon P, Vandenberghe S, Vonck K, Marinazzo D. 2014. Functional brain connectivity from EEG in epilepsy: Seizure prediction and epileptogenic focus localization. Prog Neurobiol 121C: 19–35. [DOI] [PubMed] [Google Scholar]
- Wang XJ, Buzsáki G. 1996. γ Oscillation by synaptic inhibition in a hippocampal interneuronal network model. J Neurosci 16: 6402–6413. [DOI] [PMC free article] [PubMed] [Google Scholar]
- Watts DJ, Strogatz SH. 1998. Collective dynamics of “small-world” networks. Nature 393: 440–442. [DOI] [PubMed] [Google Scholar]
- Wilt BA, Burns LD, Wei Ho ET, Ghosh KK, Mukamel EA, Schnitzer MJ. 2009. Advances in light microscopy for neuroscience. Annu Rev Neurosci 32: 435–506. [DOI] [PMC free article] [PubMed] [Google Scholar]
- Wykes RC, Heeroma JH, Mantoan L, Zheng K, Macdonald DC, Deisseroth K, Hashemi KS, Walker MC, Schorge S, Kullmann DM. 2012. Optogenetic and potassium channel gene therapy in a rodent model of focal neocortical epilepsy. Sci Transl Med 4: 161ra152. [DOI] [PMC free article] [PubMed] [Google Scholar]
- Yamamoto K, Tanei ZI, Hashimoto T, Wakabayashi T, Okuno H, Naka Y, Yizhar O, Fenno LE, Fukayama M, Bito H, et al. 2015. Chronic optogenetic activation augments Aβ pathology in a mouse model of Alzheimer disease. Cell Rep 11: 1–7. [DOI] [PubMed] [Google Scholar]
- Ziv Y, Burns LD, Cocker ED, Hamel EO, Ghosh KK, Kitch LJ, El Gamal A, Schnitzer MJ. 2013. Long-term dynamics of CA1 hippocampal place codes. Nat Neurosci 16: 264–266. [DOI] [PMC free article] [PubMed] [Google Scholar]