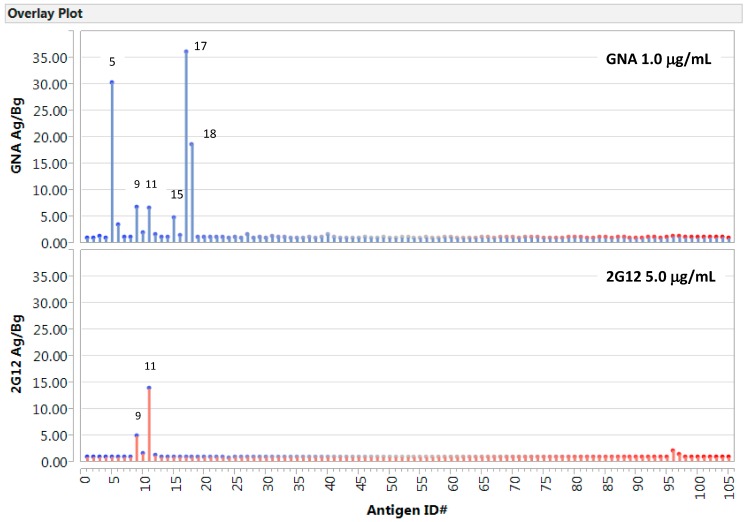
Figure 3.
Carbohydrate microarrays reveal distinct models of glycan recognition by GNA and 2G12, respectively. Antigens spotted include carbohydrates (1–39), lipids/liposomes (40–91), and proteins (92–104). (Upper panel) GNA stain (1.0 µg/mL); (Bottom panel) 2G12 stain (5.0 µg/mL). Results were plotted as antigen-specific reading over background. Corresponding microarray datasets are shown in Supplementary Table S2.

