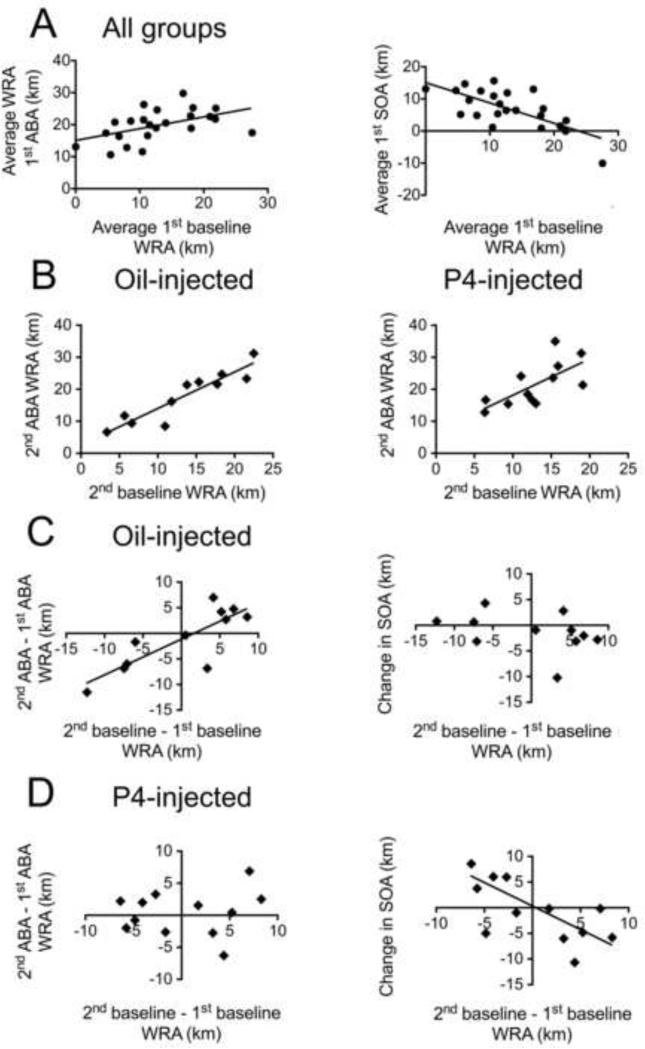
Figure 4. Pre-food restriction baseline WRA is a good predictor of vulnerability to ABA.
The measure of response to ABA induction is WRA during the food restriction period. Vulnerability to ABA is the likeliness that an animal will develop hyperactivity in response to ABA.
Panel A. Baseline WRA for both groups of animals, shown on the x-axis, is the average distance run per 24 hours on the wheel in the two days preceding food restriction in the 1st ABA. Y-axis of left graph shows average distance run per 24 hours on the wheel during the three days of the 1st ABA. The two measures show a positive correlation (R = 0.49, p = 0.01). Y-axis of right graph shows averaged WRA during the 1st ABA adjusted for the 1st baseline WRA, a measure that reflects food- restriction induced increase in activity (SOA). First SOA is negatively correlated with 1st baseline (R = − 0.66, p < 0.0001).
Panel B. 2nd baseline WRA, shown on the x-axis is a good predictor for WRA during the 2nd ABA for the oil- (R = 0.92, p < 0.0001) and P4-injected (R = 0.69, p = 0.012) groups. The first day of food restriction in the 2nd ABA was not included in the average because the mice did not receive an injection on that day.
Panels C and D. Graphs on the left show that the change in vulnerability (plotted on x-axis) is a good predictor for WRA of 2nd ABA compared to the 1st ABA (plotted on y-axis) for the oil-injected (R = 0.79, p = 0.0034) (Panel C) but not for the P4-injected animals (R = 0.12, p = 0.7) (Panel D).
Graphs on the right show that the change in vulnerability is a good predictor for the change in SOA (measurement of the worsening of sensitivity to food restriction) of the P4-injected animals (R = − 0.81, p = 0.0013) (Panel D), but not of the oil-injected animals (R = −0.53, p = 0. 091) (Panel C).

