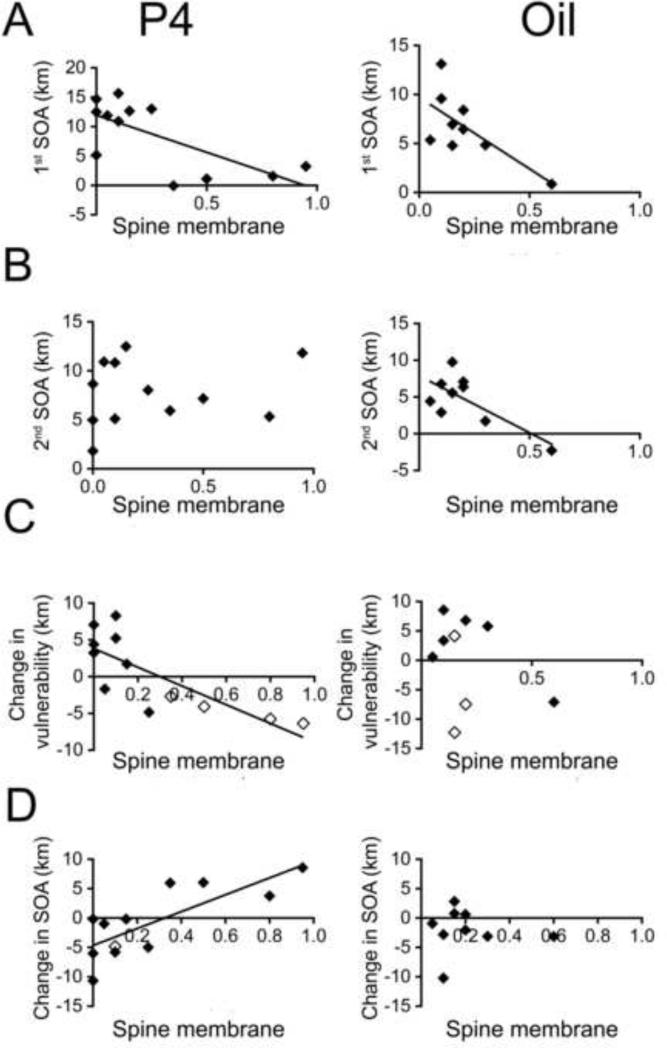
Figure 6. Relations of WRA with α4-immunoreactivity in spines of mice injected with P4 or oil.
Graphs on the left show correlation between α4-immunoreactivity (on the x-axis) and WRA (on the y-axis) for progesteroneP4-injected mice while graphs on the right show corresponding relationships for the oil-injected animals.
Panel A. α4-immunoreactivity at the spine plasma membrane (‘Spine membrane’ in the x-axes), seen as silver-intensified gold (SIG) particles, is significantly correlated with the severity of 1st ABA for the P4- injected (R = −0.69, p = 0.011, left graph) as well as oil-injected (R = −0.69, p = 0.037, right graph) animals.
Panel B. α4-immunoreactivity at the spine plasma membrane is significantly correlated with the severity of 2nd ABA for the oil- injected (R = −0.72, p = 0.027) but not the P4-injected animals.
Panel C. α4-immunoreactivity at the spine plasma membrane is significantly correlated with the change in vulnerability for the P4-injected animals (R = −0.785, p = 0.003) but not for the oil-injected animals. Open diamonds indicate animals that showed behavioral sensitization to the 2nd ABA and filled diamonds indicate animals that did not show sensitization. Panel D. α4-immunoreactivity at the spine membrane is significantly correlated with the change in SOA for the P4-injected animals (R = 0.781, p = 0.003) but not in the oil-injected animals.

