Abstract
Clear cell renal cell carcinoma (ccRCC) is among the most common human malignancies. Long non-coding RNAs (lncRNA) regulate various cellular functions and have been implicated in ccRCC pathogenesis. In order to decipher the molecular biology of this tumor and to identify potential prognostic biomarkers and therapeutic targets, we re-evaluated published lncRNA expression profiling data. An expression profile of 49 lncRNAs allowed discrimination of localized and advanced ccRCC. The expression profile of six lncRNAs transcripts (lnc-ACO1625, lnc-CYP4A22-2/3, lnc-PEAK1.1-1, lnc-PCYOX1L, lnc-VCAN-1, lnc-ZNF180-2) with potential prognostic interest were validated in a cohort of 50 normal renal, 57 localized ccRCC and 45 advanced ccRCC tissues. lnc-ZNF180-2 levels were similar in localized ccRCC and normal renal tissue, but we observed a significant increase of lnc-ZNF180-2 expression in advanced ccRCC tissue. Furthermore, lnc-ZNF180-2 expression levels were an independent predictor of progression-free survival, cancer-specific survival and overall survival in ccRCC patients. We also observed that lnc-CYP4A22-2/3 expression levels allowed discrimination of ccRCC and normal renal tissue. In conclusion, lncRNAs are involved in renal carcinogenesis, and quantification of lnc-ZNF180-2 may be useful for the prediction of ccRCC patients outcome following nephrectomy.
Keywords: Renal cell carcinoma, long non-coding RNA, lncRNA, lnc-ZNF180-2, biomarker, prognosis
Introduction
Renal cell carcinoma (RCC) is one of the most common malignancies: 115,200 new cases and 49,000 deaths were estimated in Europe in 2012 [1]. There is an increasing incidence of RCC in the USA, especially in young patients and high-grade disease [2]. While the resection of small RCC is usually curative, the prognosis of advanced RCC is poor: surgery (cytoreductive nephrectomy, metastasectomy [3]), and targeted therapy [4] improved survival of patients with metastatic RCC, but nonetheless most patients succumb to the disease.
The majority of the genome transcripts are non-coding RNAs, in particular long non-coding RNAs (lncRNA) [5]. lncRNAs are defined as RNA transcripts longer than 200 nucleotides which are not transcribed into a protein. In recent years, it was recognized that lncRNAs are not only transcriptional noise, but have important cellular functions. lncRNA are implicated in gene regulation through a variety of mechanisms, e.g. epigenetic modification of DNA, alternative splicing, posttranscriptional gene regulation and mRNA stability [6]. Various lncRNAs play a crucial role in carcinogenesis: for example, HOTAIR acts as an oncogene in different tumor entities, such as breast, gastric and colorectal cancer and its expression may be used for diagnostic and therapeutic purposes [7]. Emerging evidence indicates the importance of lncRNAs also in the development and progression of RCC. Several expression profiling studies reported dysregulation of lncRNA expression in clear cell renal cell carcinoma (ccRCC) [8-12]. In addition to diagnostic information, lncRNA expression may also be of prognostic interest: dysregulation of several lncRNAs (MALAT1 [13], NBAT-1 [14] and SPRY4-IT1 [15]) was an independent predictor of ccRCC patients’ survival probability. In order to identify novel lncRNAs with prognostic relevance, we re-analyzed lncRNA earlier published microarray expression profiling data and performed quantitative real-time PCR to confirm the findings in an enlarged cohort of ccRCC patients.
Material and methods
Patients
Fresh-frozen tissue samples from patients undergoing partial or radical nephrectomy for renal tumors were prospectively collected in the Biobank at the CIO Cologne Bonn at the University Hospital Bonn. The samples were archived according to standard operating procedures. Snap-frozen tumor and normal tissues from each patient were stored at -80°C. The diagnosis was confirmed by haematoxylin and eosin stained sections by an experienced uropathologist (S.P.). Staging was performed according the 7th edition of the TNM classification from 2009. The clinical-pathological parameters of the study cohort are provided in Table 1. All patients gave written informed consent for the collection of biomaterials. The study was done in accordance with the Helsinki Declaration of 1975 and was approved by the ethic committee at the University Hospital Bonn (number: 280/12).
Table 1.
Clinical-pathological parameters of patients
| Microarray cohort | PCR cohort | ||
|---|---|---|---|
|
|
|||
| ccRCC n=15 (%) | ccRCC n=102 (%) | Normal n=50 (%) | |
| Sex | |||
| male | 10 (66.6) | 74 (67.3) | 34 (68.6) |
| female | 5 (33.3) | 28 (32.7) | 16 (31.4) |
| Age | |||
| mean | 61.2 | 66.0 | 64.9 |
| min-max | 43-86 | 38-89 | 43-89 |
| Pathological stage | |||
| pT1 | 4 (26.7) | 57 (55.9) | n.a. |
| pT2 | 2 (13.3) | 8 (7.8) | n.a. |
| pT3 | 9 (60.0) | 35 (34.3) | n.a. |
| pT4 | 0 (0) | 2 (1.9) | n.a. |
| lymph node metastasis | 0 (0) | 3 (2.9) | n.a. |
| distant metastasis | 1 (6.7) | 16 (15.7) | n.a. |
| Fuhrman grading | |||
| grade 1 | 2 (13.3) | 11 (7.7) | n.a. |
| grade 2 | 11 (73.3) | 68 (76.9) | n.a. |
| grade 3 | 2 (13.3) | 19 (13.5%) | n.a. |
| grade 4 | 0 (0) | 4 (1.9) | n.a. |
n.a., not applicable.
Microarray analysis
Data from an earlier published microarray RNA expression profiling study (Gene Expression Omnibus database: GSE61763 [16]) were used to compare the expression of 32,183 lncRNA transcripts in localized (stage I and II, n=5) and advanced (stage III and IV, n=10) ccRCC tissues. Differentially expressed lncRNA transcripts were identified using the Arraymining software; the Gene Selection module using ENSEMBLE Feature Selection settings was applied for data analysis [17].
RNA isolation
RNA isolation of tissue samples was performed as described earlier [12]: Total RNA was isolated from 50 mg fresh-frozen tissue (Ambion mirVana miRNA Isolation Kit, Foster City, CA, USA) and treated twice with DNase (DNA-free Kit, Ambion). The RNA quantity was determined using a NanoDrop 2000 spectrophotometer (Thermo Scientific, Wilmington, DE, USA). RNA quality was further controlled by gel electrophoresis.
Real-time PCR
Quantitative real-time PCR was used to validate lncRNA expression as described earlier [12]. In brief, 1 µg total RNA was reverse transcribed using the PrimeScript RT Reagent Kit with gDNA Eraser and 5 ng cDNA was used for real-time PCR (1x SYBR Premix Ex Taq II with ROX Plus and 10 pmol/µl PCR primers; all reagents: Takara Bio, Saint-Germain-en-Laye, France). Primer sequences are provided in Table 2. PCR experiments were performed on an ABIPrism 7900 HT Fast Real-Time PCR System (Applied Biosystems, Foster City, CA, USA). Data were analyzed using Qbase+ (Biogazelle) with ACTB and PPIA as reference genes in the 2-∆∆CT algorithm.
Table 2.
Primer sequences for quantitative real-time PCR
| Gene | Forward Primer | Reverse Primer |
|---|---|---|
| ACTB | CCAACCGCGAGAAGATGA | CCAGAGGCGTACAGGGATAG |
| PPIA | ATGCTGGACCCAACACAAAT | TCTTTCACTTTGCCAAACACC |
| lnc-AC016251.1-8 | CTAGCGGTGCCCTTGTGAG | TCGTCAACTGTCCCGTTCTG |
| lnc-CYP4A22-2/3 | ATGCGCATATCAGCCCTGC | CCTCGATGCTTGTGGGATCG |
| lnc-PEAK1.1-1 | CCGCGGCGAGTAGTTAGTTA | TTTGGGCAGATACCTGAGGGG |
| lnc-PCYOX1L-2 | GACAGAACTCTCACCCACGC | GATGGGCTGTTTCTGCCTCT |
| lnc-VCAN-1 | GCAATTAGCCATGGAACTACATC | CTCATGGCCCAATTCCTTC |
| lnc-ZNF180-2 | CAGAGGTAGGGTGGGAAGGA | CTCCCCTCTACAGTCCTGCT |
Statistical analysis
The statistical analysis of quantitative real-time PCR data was performed with SPSS Statistics v21 (IBM, Ehningen, Germany). The Mann-Whitney-U and the Kruskal-Wallis test were applied to correlate tissue entities and clinical-pathological parameters with lncRNA concentrations. Univariate and multivariate Cox regression analysis were employed to determine the effect of lncRNA expression on patients’ survival. Kaplan Meier estimates were used to visualize the impact of lncRNA expression (stratified according median expression levels) on patients’ survival.
Results
Microarray: screening for aberrantly expressed RNA transcripts
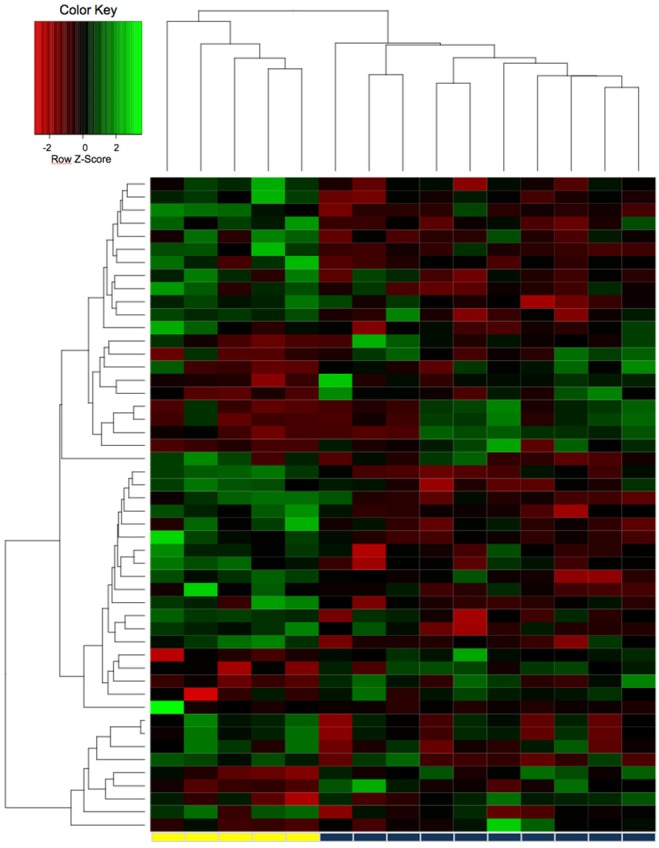
We observed differential expression (defined as log2-fold expression difference >2) of 49 lncRNA transcripts in patients with localized and advanced ccRCC: 17 were upregulated and 32 downregulated in the advanced ccRCC cohort. As shown in Figure 1, the lncRNA expression profile allowed to distinguish accurately between localized and advanced ccRCC tissue samples based on the molecular signature. The differentially expressed lncRNA transcripts are summarized in Table 3.
Figure 1.

The expression profile of 32,183 lncRNA transcripts was obtained in a microarray study with 5 localized and 10 advanced clear cell renal cell carcinoma tissues. The lncRNA expression profile of the 49 most differentially expressed lncRNAs allowed accurate discrimination of localized (yellow bar) and advanced (blue bar) clear cell renal carcinoma tissue.
Table 3.
Summary of differentially expressed lncRNAs in localized and advanced ccRCC
| Upregulated in advanced ccRCC | Downregulated in advanced ccRCC | ||||
|---|---|---|---|---|---|
|
| |||||
| Gene Name | Ensembl ID | log2 fc | Gene Name | Ensembl ID | log2 fc |
| lnc-PEAK1.1-1 | TCONS_00024175 | 3.25 | lnc-KIAA1217-1 | TCONS_00018685 | -4.83 |
| lnc-ANO1-2 | TCONS_00019372 | 3.04 | lnc-TMEM206-5 | TCONS_00002577 | -4.08 |
| lnc-FOXD4-1 | ENST00000416242 | 3.02 | lnc-C11orf46-3 | TCONS_00019270 | -3.67 |
| lnc-CD1B-2 | TCONS_00001695 | 2.90 | lnc-ZNF180-2 | TCONS_00027767 | -3.59 |
| lnc-FAM153C-3 | TCONS_00010852 | 2.73 | lnc-PRKD1-3 | TCONS_00022697 | -3.49 |
| lnc-TTC14-3 | TCONS_00006322 | 2.71 | lnc-FGFBP3-1 | TCONS_00018997 | -3.38 |
| lnc-AC016251.1 | TCONS_00023208 | 2.62 | lnc-C20orf187-2 | ENST00000421788 | -3.33 |
| lnc-ZNF804A-1 | TCONS_00003964 | 2.56 | lnc-ACSL1-2 | TCONS_00009194 | -3.22 |
| lnc-PCYOX1L-2 | TCONS_00010136 | 2.53 | lnc-SLC4A10-2 | ENST00000418335 | -3.14 |
| lnc-CEMP1-1 | ENST00000569852 | 2.51 | lnc-CDH18-5 | ENST00000512978 | -3.14 |
| lnc-NR2F2-8 | ENST00000556053 | 2.49 | lnc-PLEKHA8-3 | ENST00000419103 | -3.00 |
| lnc-BTLA-1 | ENST00000486726 | 2.45 | lnc-MATR3-1 | ENST00000514110 | -2.90 |
| lnc-DLK1-9 | ENST00000442197 | 2.36 | lnc-TPST1-1 | TCONS_00014155 | -2.77 |
| lnc-NR2F2-8 | TCONS_00023536 | 2.32 | lnc-PPIAL4C-6 | ENST00000421174 | -2.77 |
| lnc-NKD1-1 | ENST00000563424 | 2.07 | lnc-WNT1-2 | ENST00000552284 | -2.74 |
| lnc-EMP2-1 | ENST00000566787 | 2.03 | lnc-C20orf196-3 | TCONS_00028492 | -2.73 |
| lnc-VCAN-1 | ENST00000502253 | 2.00 | lnc-HPRT1-1 | TCONS_00017012 | -2.72 |
| lnc-RP11-295D22.1.1-5 | TCONS_00016148 | -2.71 | |||
| lnc-FRG1-4 | TCONS_00008988 | -2.70 | |||
| lnc-SLC44A3-1 | TCONS_00001043 | -2.66 | |||
| lnc-RP11-62N21.1.1-1 | ENST00000510967 | -2.64 | |||
| lnc-CD300C-1 | TCONS_00026160 | -2.64 | |||
| lnc-CCNL1-1 | ENST00000471357 | -2.63 | |||
| lnc-RASA1-3 | ENST00000510087 | -2.6ß | |||
| lnc-SPARCL1-1 | ENST00000507894 | -2.54 | |||
| lnc-SSTR5-2 | ENST00000561511 | -2.50 | |||
| lnc-FAM20C-3 | TCONS_00013286 | -2.48 | |||
| lnc-GSDMC-1 | ENST00000522667 | -2.35 | |||
| lnc-SLC44A3-1 | TCONS_00001042 | -2.33 | |||
| lnc-LARGE-2 | TCONS_00029687 | -2.31 | |||
| lnc-CYP4A22-2/3 | TCONS_00000929 | -2.29 | |||
| lnc-CTH-1 | TCONS_00000044 | -2.26 | |||
Abbreviation: fc, fold change.
Real-time PCR: validation of expression profiling
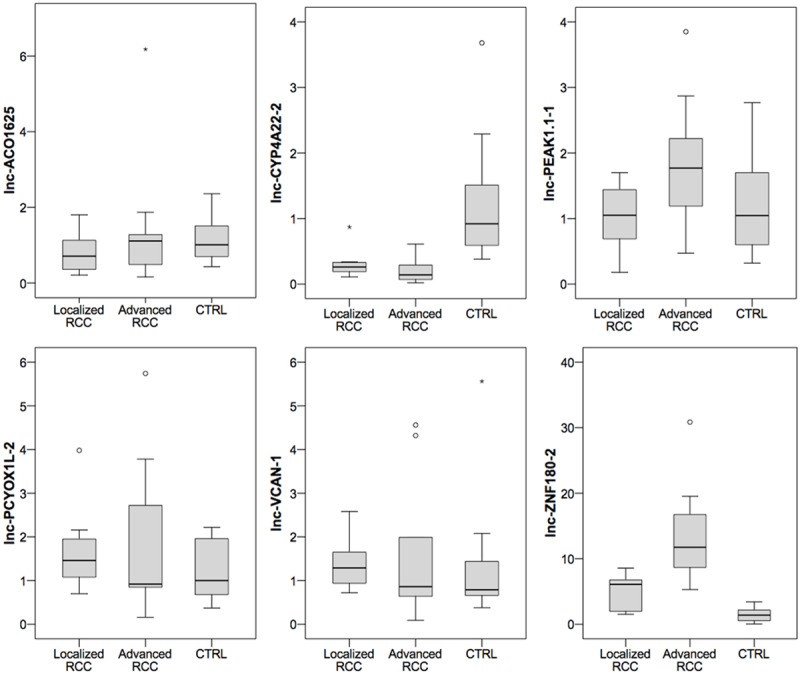
We next investigated the expression of six lncRNAs (lnc-ACO1625, lnc-CYP4A22-2/3, lnc-PEAK1.1-1, lnc-PCYOX1L, lnc-VCAN-1, lnc-ZNF180-2) with potential interest as novel prognostic biomarker. We first studied their expression in a small cohort of 10 normal renal tissues, 9 localized ccRCC and 9 advanced ccRCC tissues; Bonferroni’s adjustment was applied to correct for multiple hypothesis testing (significance concluded at P<0.008 for alpha 0.05). A significant difference in the expression of lnc-CYP4A22-2/3 and lnc-ZNF180-2 (both P<0.001) in ccRCC and normal renal tissue difference was observed, whereas the expression levels of the remaining lncRNAs were similar (P>0.38). The comparison of advanced and localized RCC indicated higher levels of ZNF180-2 (P<0.001) and lncPEAK1.1-1 (P=0.042) in advanced compared to localized ccRCC. Neither lnc-CYP4A22-2/3, lnc-ACO1625, lnc-VCAN-1 nor lnc-PCYOX1L levels were differently expressed in localized and advanced ccRCC tissues (all P>0.16). See Figure 2.
Figure 2.

The expression of 6 lncRNAs was determined in normal renal (CTRL, n=10) and localized (n=9)/advanced (n=9) clear cell renal cell carcinoma tissue to confirm expression differences in advanced and localized carcinoma patients. lnc-CYP4A22-2/3 and lnc-ZNF180-2 were differentially expressed in malignant and normal renal tissue (both P<0.001). Furthermore, lnc-ZNF180-2 was increased (P<0.001) in advanced compared to localized clear cell renal cell carcinoma tissue. lncPEAK1.1-1 (P=0.042) also was slightly increased in advanced compared to localized tumors.
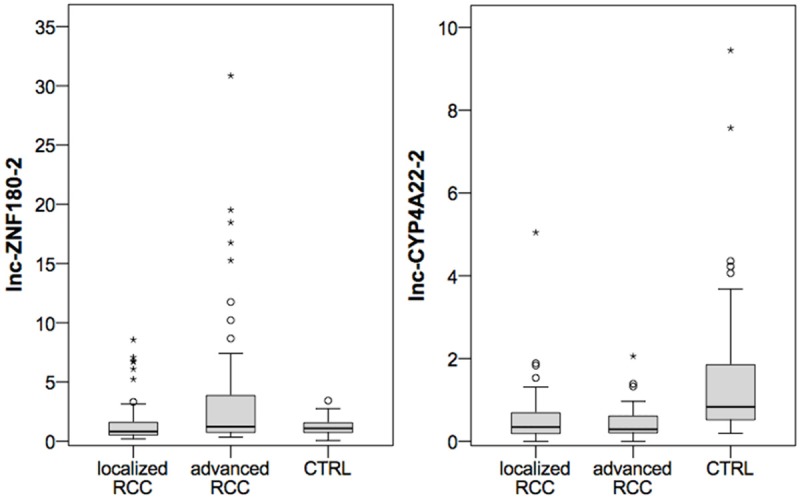
Based on these findings, we further explored lnc-CYP4A22-2/3 and lnc-ZNF180-2 in an enlarged cohort consisting of 50 normal renal, 57 localized ccRCC and 45 advanced ccRCC tissues. We confirmed lnc-CYP4A22-2/3 expression differences in ccRCC and normal renal tissue (mean expression level: 0.53 vs. 1.58; P<0.001). Receiver operator characteristic analysis demonstrated an area under the curve of 0.79 (95% confidence interval 0.71-0.86), thereby indicating potential diagnostic relevance. lnc-ZNF180-2 was no longer different in both cohorts (mean expression level: 2.73 vs. 1.22; P=0.878). As expected from screening experiments, lnc-ZNF180-2 was significantly increased in advanced compared to localized ccRCC tissue (mean expression level: 4.18 vs. 1.57; P=0.010), whereas lnc-CYP4A22-2/3 was similar in both tissue types (mean expression level: 0.44 vs. 0.59; P=0.635). See Figure 3. lnc-CYP4A22-2/3 and lnc-ZNF180-2 levels were not correlated with grading, lymph node or distant metastases (all P>0.7).
Figure 3.

The expression of lnc-CYP4A22-2/3 and lnc-ZNF180-2 in normal renal tissue (CTRL, n=50) localized (n=57) and advanced (n=45) clear cell renal cell carcinoma (ccRCC) is demonstrated using boxplot diagrams. lnc-CYP4A22-2/3 expression is significantly decreased in ccRCC compared to CTRL. The tissue levels of lnc-ZNF180-2 are significantly increased in advanced compared localized ccRCC.
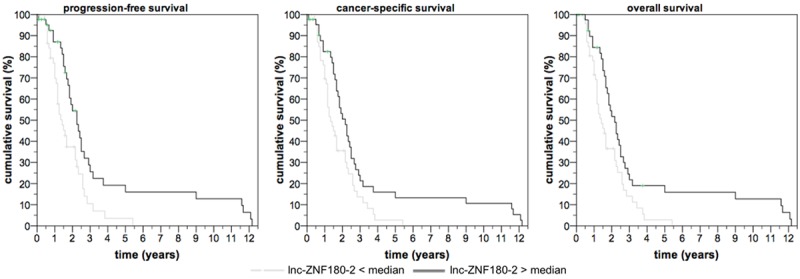
Follow-up information was available for 91 patients, and we determined in this sub-cohort whether the expression of lnc-CYP4A22-2/3 or lnc-ZNF180-2 was correlated with patient outcome following surgery. We observed a shorter period of progression-free survival (P=0.002, hazard ratio 0.79, 95% confidence interval 0.693-0.920), cancer-specific survival (P=0.010, hazard ratio 0.86, 95% CI 0.772-0.966) and overall survival (P=0.014, hazard ratio 0.86, 95% CI 0.776-0.972) following nephrectomy in patients with lower levels of lnc-ZNF180-2 in the univariate Cox regression analysis. A multivariate Cox regression model, which also included pT-stage, lymph node metastasis, distant metastases and grading, confirmed the independent prognostic value of lnc-ZNF180-2 for the prediction of progression-free, cancer-specific and overall survival. See Table 4 and Figure 4. lnc-CYP4A22-2/3 was not predictive for survival (P>0.14).
Table 4.
Multivariate cox regression analysis for the impact of lnc-ZNF180-2 expression on progression-free survival, cancer-specific survival and overall survival
| P-value | Hazard ratio | 95% confidence interval | ||
|---|---|---|---|---|
| Progression-free survival | lnc-ZNF180-2 | 0.002 | 0.803 | 0.699-0.922 |
| pT-stage | 0.824 | 0.970 | 0.742-1.268 | |
| pN-stage | 0.471 | 2.793 | 0.171-45.663 | |
| pM-stage | 0.306 | 0.344 | 0.045-2.657 | |
| grading | 0.034 | 2.222 | 1.061-4.653 | |
| Cancer-specific survival | lnc-ZNF180-2 | 0.009 | 0.865 | 0.777-0.964 |
| pT-stage | 0.871 | 0.979 | 0.761-1.260 | |
| pN-stage | 0.746 | 0.705 | 0.085-5.857 | |
| pM-stage | 0.240 | 1.746 | 0.689-4.424 | |
| grading | 0.101 | 1.830 | 0.888-3.770 | |
| Overall survival | lnc-ZNF180-2 | 0.012 | 0.871 | 0.782-0.970 |
| pT-stage | 0.495 | 0.913 | 0.702-1.187 | |
| pN-stage | 0.759 | 0.717 | 0.086-5.974 | |
| pM-stage | 0.164 | 1.945 | 0.763-4.962 | |
| grading | 0.076 | 1.929 | 0.933-3.990 |
Figure 4.

Low levels of lnc-ZNF180-2 in tumor tissue are predictive of progression-free (log rank P=0.005), cancer-specific (log rank P=0.019) and overall survival (log rank P=0.013) in patients undergoing partial or radical nephrectomy for clear cell renal cell carcinoma.
Bioinformatic prediction of lncRNA function
Using the catRAPID omics algorithm [18], we determined whether lncZNF-180-2 interacts with proteins. A high rating score (>2.5) was observed for proteins involved in RNA-splicing/processing (TIA1, HNRH1, HNRH2, HNRH3, HNRNPF, SRSF2, SRSF2, U2AF), alternative splicing (PTBP1, SRSF2), and inhibition of microRNA (pri-let7) biogenesis (LIN28B).
Discussion
In the era of personalized medicine, molecular biomarkers could help the physician in clinical decision making [19]. So far, there are no biomarkers available for patients with ccRCC. In the past years, lncRNAs were suggested as new diagnostic and prognostic candidate biomarkers [8-15] for these patients. In order to identify a novel prognostic biomarker, we re-analyzed an lncRNA expression microarray dataset [12,16]. The expression profiles of localized and advanced ccRCC samples were different, and we identified 49 differentially expressed lncRNA transcripts so far not reported in the current literature. A validation study using quantitative real-time PCR confirmed significant upregulation (2.6 fold) of lnc-ZNF180-2 in advanced ccRCC compared to localized ccRCC tissue. The large size of the cohort (50 normal renal, 57 localized ccRCC and 45 advanced ccRCC tissues) used for validation allows a profound assumption on the dysregulation of lnc-ZNF180-2 in advanced ccRCC and represents a strength of our study; patient cohorts in previous studies were distinctly smaller [8-15]. Furthermore, follow-up information was available for a subset of 91 patients, and the expression of lnc-ZNF180-2 was predictive of ccRCC patients outcome: multivariate Cox regression analyses demonstrated that low levels of lnc-ZNF180-2 were correlated with poorer progression-free, cancer-specific and overall survival independent of pT-stage, grading and metastases. Thus, lnc-ZNF180-2 could be a useful adjunct prognostic biomarker for patients with ccRCC. A bioinformatic analysis using the catRAPID omics algorithm [18] indicated that lnc-ZNF-180-2 may be involved in regulation RNA splicing via RNA-protein-interactions as specific binding motifs are detectable in proteins of the RNA splicing machinery (e.g. TIA1, HNRH1, HNRH2, HNRH3, HNRNPF, SRSF2, U2AF, PTBP1). Binding sites are also available in LIN28B, which has an inhibitory effect on the pri-let7 microRNA biogenesis [20]. Thereby, lnc-ZNF180-2 may regulate various cellular processes at the level of transcription and promote ccRCC progression.
We also determined lnc-CYP4A22-2/3 expression in the validation cohort. Although not differently expressed in localized and advanced ccRCC, we observed a 3-fold downregulation in ccRCC compared to normal renal tissue. Thereby, lnc-CYP4A22 expression allowed discrimination of normal and ccRCC tissue with an area under the curve of 0.79, suggesting this lncRNA could be of diagnostic interest. The failure to confirm expression changes of other investigated lncRNAs (lnc-ACO1625, lnc-PEAK1.1-1, lnc-PCYOX1L, lnc-VCAN-1) highlights the need for internal validation to confirm microarray expression data.
In conclusion, we have identified a novel prognostic lncRNA, namely lnc-ZNF180-2, which allows identification of patients with poor prognosis ccRCC. Similar to other lncRNAs, lnc-ZNF180-2 may regulate RNA splicing through RNA-protein-interactions.
Acknowledgements
The tissue samples were collected within the framework of the Biobank of the Center for Integrated Oncology Cologne Bonn at the University Hospital Bonn. Sven Perner is supported by a grant of the Rudolf Becker Foundation.
Disclosure of conflict of interest
None.
References
- 1.Ferlay J, Steliarova-Foucher E, Lortet-Tieulent J, Rosso S, Coebergh JW, Comber H, Forman D, Bray F. Cancer incidence and mortality patterns in Europe: estimates for 40 countries in 2012. Eur J Cancer. 2013;49:1374–1403. doi: 10.1016/j.ejca.2012.12.027. [DOI] [PubMed] [Google Scholar]
- 2.King SC, Pollack LA, Li J, King JB, Master VA. Continued Increase in Incidence of Renal Cell Carcinoma, Especially in Young Patients and High Grade Disease: United States 2001 to 2010. J Urol. 2014;191:1665–70. doi: 10.1016/j.juro.2013.12.046. [DOI] [PMC free article] [PubMed] [Google Scholar]
- 3.La Rochelle J, Wood C, Bex A. Refining the use of cytoreductive nephrectomy in metastatic renal cell carcinoma. Semin Oncol. 2013;40:429–435. doi: 10.1053/j.seminoncol.2013.05.007. [DOI] [PubMed] [Google Scholar]
- 4.Albiges L, Choueiri T, Escudier B, Galsky M, George D, Hofmann F, Lam T, Motzer R, Mulders P, Porta C, Powles T, Sternberg C, Bex A. A Systematic Review of Sequencing and Combinations of Systemic Therapy in Metastatic Renal Cancer. Eur Urol. 2015;67:100–10. doi: 10.1016/j.eururo.2014.04.006. [DOI] [PubMed] [Google Scholar]
- 5.Kapranov P, Cheng J, Dike S, Nix DA, Duttagupta R, Willingham AT, Stadler PF, Hertel J, Hackermuller J, Hofacker IL, Bell I, Cheung E, Drenkow J, Dumais E, Patel S, Helt G, Ganesh M, Ghosh S, Piccolboni A, Sementchenko V, Tammana H, Gingeras TR. RNA maps reveal new RNA classes and a possible function for pervasive transcription. Science. 2007;316:1484–1488. doi: 10.1126/science.1138341. [DOI] [PubMed] [Google Scholar]
- 6.Chen G, Wang Z, Wang D, Qiu C, Liu M, Chen X, Zhang Q, Yan G, Cui Q. LncRNADisease: a database for long-non-coding RNA-associated diseases. Nucleic Acids Res. 2013;41:D983–986. doi: 10.1093/nar/gks1099. [DOI] [PMC free article] [PubMed] [Google Scholar]
- 7.Hajjari M, Salavaty A. HOTAIR: an oncogenic long non-coding RNA in different cancers. Cancer Biol Med. 2015;12:1–9. doi: 10.7497/j.issn.2095-3941.2015.0006. [DOI] [PMC free article] [PubMed] [Google Scholar]
- 8.Qin C, Han Z, Qian J, Bao M, Li P, Ju X, Zhang S, Zhang L, Li S, Cao Q, Lu Q, Li J, Shao P, Meng X, Zhang W, Yin C. Expression Pattern of Long Non-Coding RNAs in Renal Cell Carcinoma Revealed by Microarray. PLoS One. 2014;9:e99372. doi: 10.1371/journal.pone.0099372. [DOI] [PMC free article] [PubMed] [Google Scholar]
- 9.Yu G, Yao W, Wang J, Ma X, Xiao W, Li H, Xia D, Yang Y, Deng K, Xiao H, Wang B, Guo X, Guan W, Hu Z, Bai Y, Xu H, Liu J, Zhang X, Ye Z. LncRNAs expression signatures of renal clear cell carcinoma revealed by microarray. PLoS One. 2012;7:e42377. doi: 10.1371/journal.pone.0042377. [DOI] [PMC free article] [PubMed] [Google Scholar]
- 10.Fachel AA, Tahira AC, Vilella-Arias SA, Maracaja-Coutinho V, Gimba ER, Vignal GM, Campos FS, Reis EM, Verjovski-Almeida S. Expression analysis and in silico characterization of intronic long noncoding RNAs in renal cell carcinoma: emerging functional associations. Mol Cancer. 2013;12:140. doi: 10.1186/1476-4598-12-140. [DOI] [PMC free article] [PubMed] [Google Scholar]
- 11.Malouf GG, Zhang J, Yuan Y, Comperat E, Roupret M, Cussenot O, Chen Y, Thompson EJ, Tannir NM, Weinstein JN, Valero V, Khayat D, Spano JP, Su X. Characterization of long non-coding RNA transcriptome in clear-cell renal cell carcinoma by next-generation deep sequencing. Mol Oncol. 2015;9:32–43. doi: 10.1016/j.molonc.2014.07.007. [DOI] [PMC free article] [PubMed] [Google Scholar]
- 12.Blondeau JJ, Deng M, Syring I, Schrodter S, Schmidt D, Perner S, Muller SC, Ellinger J. Identification of novel long non-coding RNAs in clear cell renal cell carcinoma. Clin Epigenetics. 2015;7:10. doi: 10.1186/s13148-015-0047-7. [DOI] [PMC free article] [PubMed] [Google Scholar]
- 13.Zhang HM, Yang FQ, Chen SJ, Che J, Zheng JH. Upregulation of long non-coding RNA MALAT1 correlates with tumor progression and poor prognosis in clear cell renal cell carcinoma. Tumour Biol. 2015;36:2947–2955. doi: 10.1007/s13277-014-2925-6. [DOI] [PubMed] [Google Scholar]
- 14.Xue S, Li QW, Che JP, Guo Y, Yang FQ, Zheng JH. Decreased expression of long non-coding RNA NBAT-1 is associated with poor prognosis in patients with clear cell renal cell carcinoma. Int J Clin Exp Pathol. 2015;8:3765–3774. [PMC free article] [PubMed] [Google Scholar]
- 15.Zhang HM, Yang FQ, Yan Y, Che JP, Zheng JH. High expression of long non-coding RNA SPRY4-IT1 predicts poor prognosis of clear cell renal cell carcinoma. Int J Clin Exp Pathol. 2014;7:5801–5809. [PMC free article] [PubMed] [Google Scholar]
- 16.Deng M, Blondeau JJ, Schmidt D, Perner S, Müller SC, Ellinger J. Identification of novel differentially expressed lncRNA and mRNA transcripts in clear cell renal cell carcinoma by expression profiling. Genomics Data. 2015;5:173–175. doi: 10.1016/j.gdata.2015.06.016. [DOI] [PMC free article] [PubMed] [Google Scholar]
- 17.Glaab E, Garibaldi JM, Krasnogor N. ArrayMining: a modular web-application for microarray analysis combining ensemble and consensus methods with cross-study normalization. BMC Bioinformatics. 2009;10:358. doi: 10.1186/1471-2105-10-358. [DOI] [PMC free article] [PubMed] [Google Scholar]
- 18.Agostini F, Zanzoni A, Klus P, Marchese D, Cirillo D, Tartaglia GG. catRAPID omics: a web server for large-scale prediction of protein-RNA interactions. Bioinformatics. 2013;29:2928–2930. doi: 10.1093/bioinformatics/btt495. [DOI] [PMC free article] [PubMed] [Google Scholar]
- 19.Ellinger J, Muller SC, Dietrich D. Epigenetic biomarkers in the blood of patients with urological malignancies. Expert Rev Mol Diagn. 2015;15:505–516. doi: 10.1586/14737159.2015.1019477. [DOI] [PubMed] [Google Scholar]
- 20.Wang T, Wang G, Hao D, Liu X, Wang D, Ning N, Li X. Aberrant regulation of the LIN28A/LIN28B and let-7 loop in human malignant tumors and its effects on the hallmarks of cancer. Mol Cancer. 2015;14:125. doi: 10.1186/s12943-015-0402-5. [DOI] [PMC free article] [PubMed] [Google Scholar]


