

Abstract
Please cite this paper as: Kelly et al. (2012) The significance of increased influenza notifications during spring and summer of 2010–11 in Australia. Influenza and Other Respiratory Viruses. DOI: 10.1111/irv.12057.
Background & objective During the temperate out‐of‐season months in Australia in late 2010 and early 2011, an unprecedented high number of influenza notifications were recorded. We aimed to assess the significance of these notifications.
Methods For Australia, we used laboratory‐confirmed cases notified to the WHO FluNet surveillance tool; the percentage of these that were positive; notifications by state and influenza type and subtype; and surveillance data from Google FluTrends. For the state of Victoria, we used laboratory‐confirmed notified cases and influenza‐like illness (ILI) proportions. We compared virus characterisation using haemagglutination‐inhibition assays and phylogenetic analysis of the haemagglutinin gene for seasonal and out‐of‐season notifications.
Results The increase in notifications was most marked in tropical and subtropical Australia, but the number of out‐of‐season notifications in temperate Victoria was more than five times higher than the average of the previous three seasons. However, ILI proportions in spring‐summer were not different to previous years. All out‐of‐season viruses tested were antigenically and genetically similar to those tested during either the 2010 or 2011 influenza seasons. An increase in the number of laboratories testing for influenza has led to an increase in the number of tests performed and cases notified.
Conclusion An increase in influenza infections in spring‐summer of 2010–11 in tropical and temperate Australia was not associated with any differences in virus characterisation compared with viruses that circulated in the preceding and following winters. This increase probably reflected a natural variation in out‐of‐season virus circulation, which was amplified by increased laboratory testing.
Keywords: Influenza, notifications, surveillance
Introduction
A wide range of data is used worldwide to assess the timing and relative magnitude of influenza seasons. These include notified cases of laboratory‐confirmed influenza to government health authorities; 1 syndromic surveillance of influenza‐like illness (ILI) from general practitioners (GPs) and hospital emergency departments; 1 web‐based ILI surveillance; 2 , 3 school and work absenteeism; 1 and data from prescriptions 4 and medical call centres. 5 In addition, Google Flu trends provides syndromic data for a number of countries. 6 These data sources usually provide comparable information on influenza seasons. 7 , 8
The influenza season in temperate Australia usually occurs for a variable period of approximately 8–20 weeks between May and October. In the tropical and subtropical north of Australia, influenza is more likely to demonstrate the tropical pattern of low level endemicity with one or two variable peaks during the year. 1 Over many years, data from notifiable disease and syndromic surveillance programmes have provided consistent estimates of the relative magnitude of influenza seasons in the state of Victoria 9 and Australia. 10 , 11 However, during the influenza A(H1N1)pdm09 pandemic in 2009, a divergent trend emerged when a record number of laboratory‐confirmed cases were notified while ILI activity was comparable to 2003 and 2007. 12 During the summer months in 2010–11 and 2011–12, periods not normally associated with influenza virus circulation in temperate Australia, an increase in notified cases was recorded in Victoria and in Australia as a whole. We hypothesised that a true increase in influenza virus circulation in spring‐summer in temperate Australia may have been amplified by an increase in laboratory testing and used available surveillance data sources to test this hypothesis.
Methods
We used a variety of approaches to attempt to understand the evolving relationship between notified laboratory‐confirmed influenza and ILI surveillance data. For Australia, we extracted cases of laboratory‐confirmed influenza and the number of diagnostic influenza tests performed by week which were notified to the World Health Organization (WHO) FluNet surveillance tool from the three National Influenza Centres in Australia between 2007 and 2011. 13 We then calculated the percentage of all these tests that were positive for influenza. We further examined the distribution of the notified out‐of‐season cases by state and by influenza type and subtype. For Victoria, we compared the number of notified laboratory‐confirmed influenza cases by month with the proportion of total consultations presenting as ILI from the Victoria influenza surveillance programme between 2001 and 2012. Finally, we examined proportions of ILI consultations for Australia and by state from Google Flu Trends. 3
WHO Global Influenza Surveillance and Response System FluNet
A network of National Influenza Centres and other national influenza reference laboratories in Australia contribute to the WHO Global Influenza Surveillance and Response System (GISRS). These laboratories provide virological data on influenza including type, subtype and total number of tests processed. The total number of influenza‐positive specimens from Australia was extracted from the GISRS FluNet interactive database for the years 2007–12 inclusive, 13 and the total number of specimens tested was used to calculate the percentage positive. Data were not available by state.
Notified laboratory‐confirmed influenza
Laboratory‐confirmed influenza is a notifiable disease in Australia. Notified cases from all states and territories are collated by the Australian Department of Health and Ageing and are publicly available on the National Notifiable Diseases Surveillance System. 14 The number of cases notified by month from Australia and by state was extracted from this database for the years 2008–2012.
ILI surveillance
General practitioner sentinel surveillance (GPSS) is conducted in Victoria by the Victorian Infectious Diseases Reference Laboratory (VIDRL) in partnership with the state Department of Health. The surveillance programme runs from week 18 (beginning of May) to week 40 (end of September), extended to week 44 (end of October) from 2007. GPs submit weekly counts of their total number of consultations and the number of consultations where the patient presented with an ILI, from which an ILI proportion per 1000 consultations is calculated.
The Melbourne Medical Deputising Service (MMDS) is the largest medical locum service in Australia and has contributed to the Victorian influenza surveillance scheme since 2003, with data available retrospectively from 1998. The service provides an out‐of‐hours, 7 day a week medical care to people in their own home or aged care facility. From the password‐protected database of the deputising service, we extracted weekly data on ILI diagnoses by GPs from the service and calculated the ILI proportion per 1000 consultations. These data are accessible year round.
Search queries for influenza‐related terms as a proportion of total searches 6 were extracted from the Google Flu Trends website by Australian state. 3 These queries provide syndromic surveillance from all Australian states over a number of years. Data from the Google search are available year round and were extracted from January 2006 to October 2012.
Detailed antigenic and genetic analysis
Antigenic and genetic characterisations of viruses from influenza cases notified in Australia from November 2010 to April 2011 were obtained from the WHO Collaborating Centre for Reference and Research on Influenza in Melbourne. During this period, 5185 cases were notified, and a convenience sample of 594 influenza viruses (12% of notifications) from these cases was isolated in MDCK cells and analysed in a haemagglutination‐inhibition assay to determine antigenic properties. The haemagglutinin (HA) gene from 92 influenza isolates was sequenced and compared by phylogenetic analysis with HA sequences from other strains collected outside of Australia during the out‐of‐season period and from Australian strains collected prior to November 2011 and after April 2011.
Ethics statement
Data in this study were collected, used and reported under the legislative authorisation of the Victorian Public Health and Wellbeing Regulations 2009 and did not require Human Research Ethics Committee approval. All data were anonymous.
Results
In Australia during the temperate out‐of‐season period in 2010–11, the total number of tests for influenza and percentage positive of all tests reported to FluNet was higher than seen during corresponding periods in the previous 4 years (Figure 1). Influenza notifications remained above historical out‐of‐season numbers in the spring‐summer of 2011–12, but not to the same extent as in the corresponding period in 2010–11 (Table 1). The increase in 2010–11 was noted in all states, although most obvious in Queensland and the Northern Territory (Table 1). For subtropical Queensland, temperate Victoria and temperate South Australia, the increase in 2010–11 compared with previous years was about fivefold, while in the predominantly tropical Northern Territory, the increase was more than 10‐fold (Table 1). An increase in the percentage of positive tests accompanied the increase in laboratory‐confirmed notifications during spring and early summer of 2010–11 (Figure 1).
Figure 1.
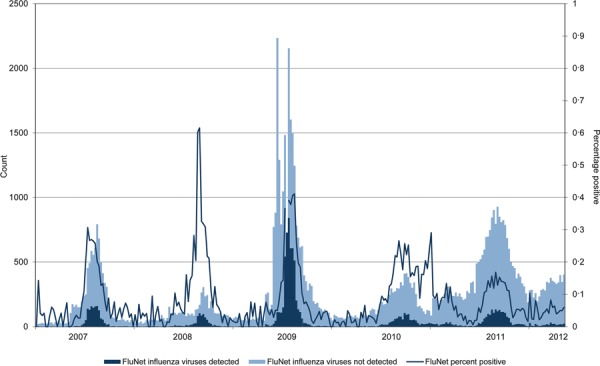
Influenza notifications, Australia, and percentage positive tests from the World Health Organization (WHO) FluNet surveillance tool, 2007–2011.
Table 1.
Number of notifications and circulating subtypes by state, 2008–2012
| Number of notifications | Circulating subtype (%) 2010/2011 | Number of notifications | ||||||
|---|---|---|---|---|---|---|---|---|
| November 2008–April 2009 | November 2009–April 2010 | November 2010–April 2011 | A H1N1pdm09 | A H3N2 | B B/Bris/60 | B B/Flor/4 | November 2011–April 2012 | |
| ACT | 25 | 13 | 26 | – | – | – | – | 52 |
| NSW | 580 | 281 | 698 | 57% | 11% | 32% | 0% | 584 |
| NT | 48 | 19 | 471 | 32% | 51% | 18% | 0% | 70 |
| QLD | 225 | 408 | 2450 | 43% | 48% | 9% | 0% | 852 |
| SA | 125 | 133 | 514 | – | – | – | – | 351 |
| TAS | 26 | 26 | 48 | – | – | – | – | 28 |
| VIC | 104 | 140 | 587 | 59% | 26% | 12% | 3% | 498 |
| WA | 143 | 125 | 402 | 52% | 14% | 34% | 0% | 575 |
| Total | 1276 | 1145 | 5196 | – | – | – | – | 3010 |
From the convenience sample of 594 viruses detected out‐of‐season and tested at the WHO Collaborating Centre for Reference and Research on Influenza in Melbourne, viruses were characterised as predominantly influenza A(H1N1)pdm09 (n = 272) and A(H3N2) (n = 238) with occasional detections of influenza B (n = 84), virtually all (81/84) of which belonged to the B/Victoria/2/87‐lineage. There were differences in the proportion of virus types or subtypes by states. In temperate Victoria, New South Wales and Western Australia, more than half of all viruses detected were influenza A(H1N1)pdm09, all of which were antigenically and genetically similar. However, influenza A(H3N2) was more likely to be detected in the tropical and subtropical Northern Territory and Queensland (Table 1).
The out‐of‐season viruses were not antigenically distinct from those circulating either before or after this period. The HA gene from 92 out‐of‐season isolates (46 A(H1N1)pdm09, 28 A(H3N2) and 18 influenza B) was sequenced and included in a phylogenetic analysis of each HA type/subtype for Australian and international viruses from January 2010 to October 2011. For all virus types and subtypes, the out‐of‐season viruses showed a high degree of genetic heterogeneity within each of their respective type/subtypes and were spread widely across the phylogenetic tree, with the majority of viruses showing genetic similarity to strains tested during the 2011 winter season, while some strains remained genetically similar to viruses from the 2010 winter season.
In temperate Victoria between 2001 and 2009, an average of 52 cases was notified during the out‐of‐season summer period (November to April). However, between November 2010 and April 2011, 587 notifications were recorded, representing more than five times the average out‐of‐season of 108 notifications from the previous 3 years (2007–09), in a period when the substantial majority of notifications were laboratory‐confirmed (Figure 2). However, in contrast to the laboratory‐confirmed notifications, the ILI proportion from the MMDS syndromic surveillance system during the out‐of‐season summer period was similar to the proportion in previous years in Victoria (Figure 2). Since 2009, influenza notifications in Victoria have increased so that notifications are no longer correlated to the state‐based ILI syndromic surveillance data. In 2010, ILI proportions were similar to the ILI proportions in 2012, but the number of notifications to October 2012 was four times the number for the corresponding period in 2010 (Figure 3). Google Flu Trends did not demonstrate any out‐of‐season increase in influenza searches in Australia as a whole, or within any Australian state or territory in 2010–11 (Figure 4).
Figure 2.
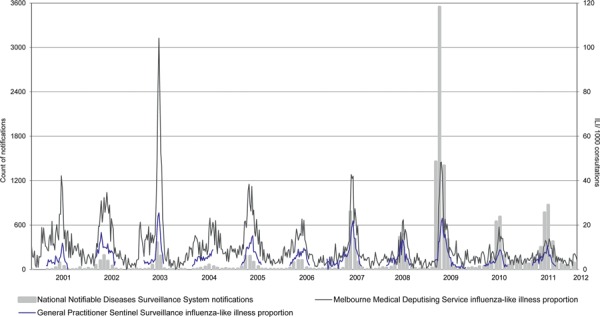
Influenza‐like illness (ILI) proportions in patients attending sentinel general practitioners (GPs), the Melbourne Medical Deputising Service (MMDS) and Victorian influenza notifications to the National Notifiable Diseases Surveillance System, 2001–2012.
Figure 3.
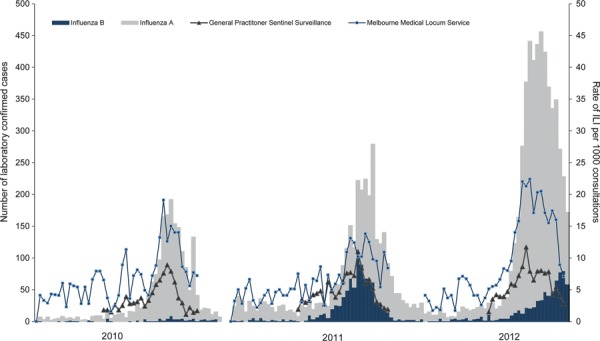
Routinely notified cases of laboratory‐confirmed influenza and proportion of general practitioner sentinel surveillance (GPSS) and Melbourne Medical Deputising Service (MMDS) influenza‐like illness (ILI), Victoria, 1 January 2010 to present.
Figure 4.
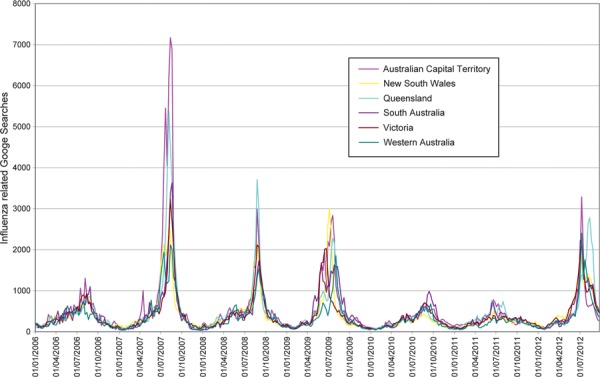
Google Flu Trends influenza searches 2006–2012.
Discussion
Overlapping data sources have shown increases in the number of laboratory‐confirmed influenza notifications in the spring and summer months of 2010–11 in temperate Victoria, and in Australia as a whole. This increase, albeit at a lower level, extended into the summer of 2011–12. As was the case in 2009 in the northern hemisphere, an increase in out‐of‐season influenza detections could have been a pandemic signal, but the 2010–11 viruses were not distinct from those circulating in 2010 9 or 2011. 15 No specific responses to the increased notifications were implemented at the time.
The introduction of an item number for influenza PCR testing in the Australian Medicare benefits schedule in 2004 16 ensured that there was a contribution from public funding for influenza testing from that time. This has resulted in a steady increase in influenza testing, evident from 2007 possibly because of heightened awareness of influenza in Australia due to highly publicised deaths associated with influenza in children in the state of Western Australia, 1 but more evident after the pandemic of 2009. The increased testing has occurred year round.
Compared with previous years, the influenza notifications of spring and early summer 2010–11 were associated with a higher proportion of tests that were positive for influenza, suggesting a real increase in disease. 8 However, our understanding of out‐of‐season circulation and, indeed, influenza seasonality remains unclear. 17 Influenza is known to circulate at relatively low levels out of season in Australia as shown by the available notification data. A recent study conducted during the heightened testing that occurred following the pandemic of 2009 found evidence for an extended transmission chain of H3N2 in New York during spring, suggesting that out‐of‐season transmission may be more widespread than is generally acknowledged. 18 It thus seems likely that increased testing has amplified the detection of out‐of‐season influenza viruses, especially since the heightened awareness of influenza after the pandemic of 2009.
The increased number of notifications was most pronounced in the two subtropical and tropical regions of northern Australia. While increases in other jurisdictions during the summer of 2010–11 were of the order of fivefold, the increase in the Territory was double this. The changes in the Northern Territory may be explained by the inclusion of the Northern Territory surveillance scheme into the Australian Sentinel Practice Research Network in March 2010, resulting in an opportunity for sentinel GPs in the Northern Territory to increase testing for influenza after that date. 19 Moreover, increased testing may have occurred in conjunction with changes in climate and rainfall in Queensland during the summer of 2010–11, conditions that may have been favourable for influenza transmission. 20 , 21
The high number of summer notifications led some commentators at the time to claim that Australia was destined for an unusually severe – and possibly devastating – influenza season in 2011. 22 , 23 However, at the end of the year, the influenza season of 2011 was characterised as mild to moderate in Victoria. 24 ILI surveillance systems that assessed ILI year round showed that the out‐of‐season pattern was not different to the pattern of previous years. This was seen specifically in state‐based systems in Victoria 25 and in Google Flu Trends. 23 On introduction into Australia, Google Flu Trends used syndromic and laboratory data from Victoria for calibration, 25 and we have subsequently demonstrated reliable correlation between Google Flu Trends and ILI syndromic surveillance in Victoria. 7 , 26 Furthermore, the Australian Web‐based syndromic surveillance system, Flu Tracking, did not show any increases in reported cough and fever during the spring and early summer of 2010–11. 27
Based on the findings of the study, it is difficult to determine the precise cause of the increased influenza notifications observed in the spring and early summer months of 2010–11, predominantly in tropical Australia but also evident in the temperate states. However, our analysis suggests a genuine increase in out‐of‐season virus circulation leading to increased infections. This increase was amplified by an increase in testing that had become most pronounced after the pandemic of 2009. The viruses from this period were not due to a single emergent variant, but instead were made up of A(H1N1)pdm09, A(H3N2) and B viruses that were similar to viruses seen during the 2011 season. No ILI surveillance system recorded a similar out‐of‐season increase in 2010–11, but the sensitivity of these systems to detect a truly aberrant increase in out‐of‐season influenza virus circulation has never been tested. We conclude that unusual patterns of influenza are best interpreted by reference to a range of surveillance systems and that rapid strain identification is critical to understanding unexpected influenza detections.
Acknowledgements and funding
We gratefully acknowledge the ongoing support of GPs and their practice staff participating in the general practice surveillance system and the continued involvement of the MMDS in influenza surveillance in Victoria. We thank the Victorian Government Department of Health for provision of notification data. We thank James Fielding for comments on an early draft of this manuscript. We thank staff of the Viral Identification Laboratory at VIDRL and staff from the WHO Collaborating Centre for Reference and Research on Influenza, especially Robert Shaw, Helen Sjogren and Chris Durrant for performing haemagglutination‐inhibition assays, and Naomi Komadina, Yi‐Mo Deng, Natalie Caldwell and Pina Iannello for performing genetic analyses. The Melbourne WHO Collaborating Centre for Reference and Research on Influenza is funded by the Australian Government Department of Health and Ageing. Influenza surveillance in Victoria is supported by the Victorian Department of Health.
Conflict of interest
We the authors state that none of us has a commercial or other association that might pose a conflict of interest.
Previous presentation of information: None of the data in this manuscript have been presented elsewhere.
References
- 1. Owen R, Barr IG, Pengilley A, Liu C, Paterson B, Kaczmarek M. Annual report of the National Influenza Surveillance Scheme, 2007. Commun Dis Intell 2008; 32:208–226. [DOI] [PubMed] [Google Scholar]
- 2. Carlson SJ, Dalton CB, Durrheim DN, Fejsa J. Online Flutracking survey of influenza‐like illness during pandemic (H1N1) 2009, Australia. Emerg Infect Dis 2010; 16:1960–1962. [DOI] [PMC free article] [PubMed] [Google Scholar]
- 3. Google . Available at http://www.google.org/flutrends/intl/en_us/au/. Flu Trends Australia (Accessed 09 Nov 2011).
- 4. Greene SK, Kulldorff M, Huang J et al. Timely detection of localized excess influenza activity in Northern California across patient care, prescription, and laboratory data. Stat Med 2011; 30:549–559. [DOI] [PMC free article] [PubMed] [Google Scholar]
- 5. Baxter R. Surveillance lessons from first‐wave pandemic (H1N1) 2009, Northern California, USA. Emerg Infect Dis 2010; 16:504–506. [DOI] [PMC free article] [PubMed] [Google Scholar]
- 6. Cook S, Conrad C, Fowlkes AL, Mohebbi MH. Assessing Google flu trends performance in the United States during the 2009 influenza virus A (H1N1) pandemic. PLoS ONE 2011; 6:e23610. [DOI] [PMC free article] [PubMed] [Google Scholar]
- 7. Coory M, Grant K, Kelly H. Influenza‐like illness surveillance using a deputising medical service corresponds to surveillance from sentinel general practices. Euro Surveill 2009; 14:pii: 19387. [PubMed] [Google Scholar]
- 8. Lambert SB, Faux CE, Grant KA et al. Influenza surveillance in Australia: we need to do more than count. Med J Aust 2010; 193:43–45. [DOI] [PubMed] [Google Scholar]
- 9. Grant KAFL, Kaczmarek M, Hurt AC, Kostecki R, Kelly HA, Fielding JE. Continued dominance of pandemic A (H1N1) 2009 influenza in Victoria, Australia in 2010. WPSAR 2011;2: Available at http://www.wpro.who.int/wpsar (Accessed 09 Nov 2011). [DOI] [PMC free article] [PubMed] [Google Scholar]
- 10. Australian Government Department of Health and Ageing . Australian influenza surveillance report No. 6, 2012. 2012. [cited 2012 4 August]; Available at http://www.health.gov.au/internet/main/publishing.nsf/Content/cda‐ozflu‐no6‐12.htm (Accessed 01 Nov 2012).
- 11. Governement of Western Australia DoH, Public Health, Virus WAtch . Available at http://wwwpublichealthwagovau/3/487/3/virus_watchpm. (Accessed 01 Nov 2012). 2012.
- 12. Fielding J, Higgins N, Gregory J et al. Pandemic H1N1 influenza surveillance in Victoria, Australia, April ‐ September, 2009. Euro Surveill 2009; 14:pii:19368. [DOI] [PubMed] [Google Scholar]
- 13. World Health Organization . Global Influenza Surveillance and Response System (GISRS), FluNet. Available at http://www.who.int/gho/epidemic_diseases/influenza/virological_surveillance/en/index.html (Accessed 14 Nov 2011).
- 14. Australian Government Department of Health and Ageing National Notifiable Diseases Surveillance System . Available at http://www9.health.gov.au/cda/source/CDA‐index.cfm (Accessed 01 Nov 2012).
- 15. Fielding JEGK, Tran T, Kelly HA. Moderate influenza vaccine effectiveness in Victoria, Australia, 2011. Euro Surveill 2012; 17:pii: 20115. [PubMed] [Google Scholar]
- 16. Australian Government Department of Health and Ageing . Medicare Benefits Schedule Online. Available at http://wwwmbsonlinegovau/internet/mbsonline/publishingnsf/Content/MBSOnline‐2000 (Accessed 14 Nov 2011). 2000 to 2009.
- 17. Tamerius J, Nelson MI, Zhou SZ, Viboud C, Miller MA, Alonso WJ. Global influenza seasonality: reconciling patterns across temperate and tropical regions. Environ Health Perspect 2011; 119:439–445. [DOI] [PMC free article] [PubMed] [Google Scholar]
- 18. Ghedin E, Wentworth DE, Halpin RA et al. Unseasonal transmission of H3N2 influenza A virus during the swine‐origin H1N1 pandemic. J Virol 2010; 84:5715–5718. [DOI] [PMC free article] [PubMed] [Google Scholar]
- 19. Australian Sentinel Practices Research Network . Available at http://www.racgp.org.au/aspren. (Accessed 01 Nov 2012). 2012.
- 20. Alonso WJ, Viboud C, Simonsen L, Hirano EW, Daufenbach LZ, Miller MA. Seasonality of influenza in Brazil: a traveling wave from the Amazon to the subtropics. Am J Epidemiol 2007; 165:1434–1442. [DOI] [PubMed] [Google Scholar]
- 21. Moura FE, Perdigao AC, Siqueira MM. Seasonality of influenza in the tropics: a distinct pattern in northeastern Brazil. Am J Trop Med Hyg 2009; 81:180–183. [PubMed] [Google Scholar]
- 22. Bucci N. Four‐fold increase in flu sufferers. The Age. 2011. Available at http://www.theage.com.au/national/fourfold‐increase‐in‐flu‐sufferers‐20110719‐1hmq0.html. (Accessed 19 July 2011).
- 23. Betts M. Australia in the grip of a flu outbreak. Herald Sun. 2011. Available at http://news.smh.com.au/breaking‐news‐national/flu‐outbreak‐grips‐australia‐20110719‐1hmrk.html. (Accessed 19 July 2011).
- 24. Victorian Infectious Diseases References Laboratory . The Victorian Influenza Vaccine Effectiveness Audit. Available at https://www.victorianflusurveillance.com.au/; https://www.victorianflusurveillance.com.au/ (Accessed 09 Nov 2011).
- 25. Google . Available at http://www.google.org/flutrends/intl/en_us/about/faq.html (Accessed 09 Nov 2011). Flu Trends FAQs.
- 26. Kelly H, Grant K. Interim analysis of pandemic influenza (H1N1) 2009 in Australia: surveillance trends, age of infection and effectiveness of seasonal vaccination. Euro Surveill 2009; 14:Pii: 19288. [DOI] [PubMed] [Google Scholar]
- 27. FluTracking . Available at http://www.flutracking.net/ (Accessed 09 Nov 2011).