

Abstract
Introduction
Previous influenza pandemics had second and on occasion third waves in many countries that were at times more severe than the initial pandemic waves.
Objective
This study aims to determine the seroepidemiology of successive waves of H1N1pdm09 infections in Singapore and the overall risks of infection.
Methods
We performed a cohort study amongst 838 adults, with blood samples provided upon recruitment and at 5 points from 2009 to 2011 and tested by haemagglutination inhibition (HI) with A/California/7/2009 (H1N1pdm09). Surveys on key demographic and clinical information were conducted at regular intervals, and associations between seroconversion and these variables were investigated.
Results
After the initial wave from June to September 2009, second and third waves occurred from November 2009 to February 2010 and April to June 2010, respectively. Seroconversion was 13·5% during the first wave and decreased to 6·2% and 6·8% in subsequent waves. Across the three waves, the elderly and those with higher starting HI titres were at lower risk of seroconversion, while those with larger households were at greater risk. Those with higher starting HI titres were also less likely to have an acute respiratory infection.
Conclusions
The second and third waves in Singapore had lower serological attack rates than the first wave. The elderly and those with higher HI titres had lower risk, while those in larger households had higher risk of seroconversion.
Keywords: Epidemic waves, H1N1pdm09, haemagglutination inhibition, risk factors, seroconversion, seroepidemiology
Introduction
The 1918 influenza A H1N1 pandemic caused second and third waves in many countries that were more severe than the initial pandemic wave,1 and more severe follow‐on waves were also observed in some countries during the 1957 and 1968 influenza pandemics.2, 3 It was therefore a concern that after the influenza A (H1N1pdm09) pandemic that spread rapidly across the world in 2009,4 additional waves of infection would follow the initial wave. Several questions about the epidemiology of successive epidemic waves remain unanswered – Are individuals infected in the initial epidemic wave protected in subsequent waves? Are there changes in age distribution and other risk factors between epidemic waves? Do these risk factors explain the differences in infection rates across waves? It is therefore important to explore the epidemiology of H1N1pdm09 infections after the first epidemic wave.
Tropical regions are important in the understanding of influenza transmission as their seasonal patterns differ substantially from temperate regions in which influenza outbreaks usually occur in winter. In the tropics, influenza has a high baseline incidence and occasionally more than one seasonal epidemic a year.5, 6, 7 In addition, global influenza epidemics may be influenced by the overlapping epidemic transmission within tropical and subtropical South‐East Asia.8 Singapore is a tropical city‐state and global transportation hub in South‐East Asia, wherein the first wave of the H1N1pdm09 epidemic started in June 2009 with sustained community transmission, with an epidemic wave peaking in early August and subsiding by September 2009.9, 10 To determine the seroconversion rates to H1N1pdm09 as a marker for infection rates during the first wave in Singapore, a serological cohort study was initiated amongst a community cohort of adults before the start of widespread community transmission.11
To address the questions described above, we followed the cohort for an additional 2 years to determine the epidemiology of subsequent waves of H1N1pdm09 infections after the first epidemic wave and whether there were differences in risk factors for infection between the different waves.
Methods
Overview of study design
We performed a cohort study amongst individuals aged 21–75 recruited from the Multiethnic Cohort (MEC) of the Singapore Consortium of Cohort Studies. We enrolled 838 subjects at the start of community transmission in Singapore, comprising new and existing MEC participants who consented to participation.11 Subjects provided baseline blood samples (Sample 1 collected from 29 June 2005 to 27 June 2009) upon recruitment (4% new samples, 96% banked samples during their original recruitment) and several additional blood samples listed below and depicted in Figure 1.
Figure 1.
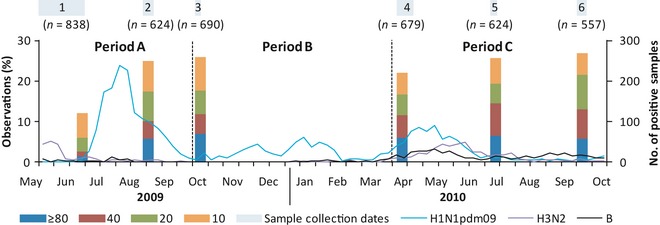
Time course of serological analyses and H1N1pdm09 cases detected by the National laboratory surveillance system. Line graph – Weekly number of H1N1pdm09 (blue), H3N2 (purple) and influenza B (black) cases detected by the National Public Health Laboratory. Bar graphs –% of serological samples with the corresponding antibody titres for each blood sample.
Sample 2 (collected from 20 August 2009 to 29 August 2009): During the first epidemic wave about 4 weeks after the epidemic had peaked to capture seroconversion until the peak of the first wave.
Sample 3 (6 October 2009–11 October 2009): At least 4 weeks after epidemic activity had subsided to capture seroconversion during the first wave.
Sample 4 (8 April 2010–22 April 2010): Before the midyear epidemic period in April to July, the most frequent epidemic period in Singapore,5 and after the 2nd most common epidemic period which typically occurs from November to February.
Sample 5 (2 July 2010–8 July 2010): 10–12 weeks after sample 4 to capture midyear epidemic wave seroconversions.
Sample 6 (19 September 2010–27 September 2010): 10–12 weeks after sample 5 to test whether there were substantive changes in seroincidence after the midyear epidemic wave.
To verify that the chosen sampling periods corresponded to our anticipated epidemic waves, we analysed the number of H1N1pdm09‐positive samples sent to the National Public Health Laboratory from sentinel primary healthcare clinics which had been requested to submit samples of cases that met the World Health Organization influenza‐like illness (ILI) criteria.
Questionnaire survey
We conducted a baseline survey on key demographic variables and additional repeat surveys covering the sample collection periods to capture self‐reported influenza vaccination events and any new‐onset fever and respiratory symptoms. During the initial epidemic wave, six surveys were conducted fortnightly, ending with sample 3. Subsequently, we conducted three additional surveys timed to coincide with each of the later samples (4–6) to cover vaccination events and illness episodes from the time of the last sample collection; the survey frequency was reduced to minimize the burden of data collection on study participants in view of the extended period of study.
Blood sampling and laboratory testing
For each sample, up to 10 ml of venous blood was obtained from participants. Sera were pre‐treated with receptor destroying enzyme (Denka‐Seiken, Japan) before enzyme inactivation by addition of an equal volume of 1·6% trisodium citrate and incubation at 56°C for 30 minutes. The haemagglutination inhibition (HI) assay with A/California/7/2009 (H1N1pdm09) was performed according to standard protocols at the World Health Organization Collaborating Centre for Reference and Research on Influenza in Melbourne, Australia, as previously described.11, 12 Titres were expressed as the reciprocal of the highest dilution, to a maximum tested dilution of 1:1280, of serum where haemagglutination was prevented. This study was approved by the institutional review board of the National University of Singapore.
Data and statistical analysis
We simplified our analysis by grouping seroconversion events detected into three epidemic periods (Figure 1). We defined period A as the period between samples 1 and 2/3 (26 May 2009–3 October 2009), period B between samples 2/3 and 4 (4 October 2009–3 April 2010) and period C between samples 4 and 5/6 (4 April 2010–18 September 2010). The end dates correspond to the last day of the epidemiological week before the first sample of the succeeding period was taken to account for the lag between infection and serological response,13 while the start dates corresponded to the detection of the first case of H1N1pdm09 in Singapore9 for period A and the day after the end of the preceding period for B and C. The three periods corresponded approximately to the initial wave (period A) and two subsequent periods of increased activity in accordance with historical expectations of influenza epidemic seasons at the end (period B) and middle of the year (period C), respectively. Comparisons were made for each subject in the respective periods only if the subject contributed a sample before the start of the period and one additional sample thereafter. Seroconversion was defined as a fourfold or greater increase in antibody titre from a previous serum sample, including instances in periods A and C where the increase was observed between non‐consecutive samples (i.e. samples 1–3 and 4–6, respectively).
Geometric mean titres (GMTs) were estimated by assigning a value of 5 for titres below 10 and a value of 1280 for titres of 1280 or higher. When analysing for the effect of vaccination experience (Figure 2), GMTs were compared against those from unvaccinated controls, with analytic weights used to adjust for the effects of age distribution. For the analyses of likely infections during a defined period, participants who seroconverted between any successive pairs of blood samples (taking into account missing samples) were considered as having serological evidence of infection during that period; for periods B and C, those who reported influenza vaccination within the corresponding time period were excluded, since at that time, influenza vaccine formulations sold in Singapore contained A/California/7/2009 (H1N1pdm09).
Figure 2.
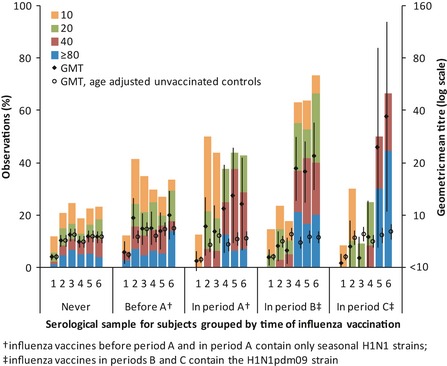
Distribution of titres by influenza vaccination experience corresponding to the sample periods. Bar graphs –% of observations with the corresponding titre. Closed diamond and open circles with error bars – geometric mean titre (GMT) for observations of respective vaccination experience as indicated on x‐axis and unvaccinated controls adjusted for age; †influenza vaccines before period A and in period A contain only seasonal H1N1 strains; ‡influenza vaccines in periods B and C contain the H1N1pdm09 strain.
Univariate and multivariate logistic regression (including all variables from the univariate analysis) was used to investigate whether seroconversion in each period (epidemic wave) was associated with demographic and household characteristics from the baseline survey data (collected in mid‐June 2009), previous vaccination against seasonal influenza (i.e. with vaccines not containing H1N1pdm09), HI titres at the start of that period, as well as seroconversion to A/California/7/2009 (H1N1) in the preceding period (applicable to periods B and C). In addition, we grouped observations from all three periods by treating them as clustered data grouped by each participant while using robust standard errors. We also tested for possible interaction between the various factors and the epidemic period to determine whether factors associated with infection changed over successive epidemic waves. Observations from individuals who previously received vaccines containing the H1N1pdm09 strain (from period B onwards) were excluded because seroconversion has been shown not to be a reliable endpoint for detecting infection in those who previously received a matched vaccine.14 Finally, we also investigated whether self‐reported acute respiratory illness (ARI) episodes (as an alternative outcome measure independent of seroconversion to detect possible H1N1pdm09 infection) were associated with baseline HI titres and influenza vaccination. Statistical analyses were performed by Stata 10.0 (StataCorp, College Station, TX, USA).
Results
Weekly numbers of H1N1pdm09‐positive samples from the national laboratory surveillance system, together with the serological results, are shown in Figure 1. Following the initial epidemic wave from June to September 2009, there was an additional period of increased H1N1pdm09 activity from November 2009 to February 2010 and another from April to June 2010. The occurrence of these latter periods of activity supports our decision to group the analysis into three periods, subsequently described as the 1st, 2nd and 3rd epidemic waves (periods A, B and C). There was also a concurrent rise in samples positive for H3N2 and influenza B from April 2010 onwards, indicating that H1N1pdm09 did not emerge as the sole circulating influenza strain in Singapore. There was a major shift in antibody titre distribution between samples 1 and 2 and no significant difference between samples 2 and 3. In spite of H1N1pdm09 activity in period B, there was a slight decrease in the proportion with titres ≥10 from samples 3 to 4, followed by an increase particularly at titres ≥40 from samples 4 to 5 and no significant change between samples 5 and 6.
The characteristics of the subjects over successive periods are shown in Table 1. Seven hundred and twenty seven subjects contributed samples (one sample at the beginning and one at the end of the period) in period A (1st wave), 650 in period B (2nd wave) and 649 in period C (3rd wave). There was no significant change in the distribution of demographic and household characteristics over the successive periods. In the enrolment survey, 9·8% reported having previously received influenza vaccines, while 2·2% reported receiving influenza vaccine in period A. These seasonal influenza vaccines that did not contain the H1N1pdm09 strain as the monovalent H1N1pdm09 vaccine (and subsequently the trivalent vaccine containing H1N1pdm09) were available only from October 2009. In periods B and C, 5·7% and 1·7%, respectively, received influenza vaccine formulations containing the H1N1pdm09 strain. In total, 13·5% of subjects seroconverted in period A (which would correspond to the 1st infection wave), while 8·3% and 7·7% of subjects seroconverted in periods B and C. After excluding those who received vaccines containing the H1N1pdm09 strain, this was reduced to 6·2% and 6·8%, respectively. Only 4 individuals seroconverted more than once – 2 in period B and 2 in period C (one each with prior seroconversions in periods A and B). In addition, the relative proportions of influenza activity determined through the number of H1N1pdm09‐positive samples amongst ILI samples in the national surveillance system and the seroconversion rates in this study were consistent across the periods (see Table 2).
Table 1.
Comparison of study variables over successive survey periods
| No. of subjects by period | ||||
|---|---|---|---|---|
| Enrolment, n = 838 | Period A, n = 727 | Period B, n = 650 | Period C, n = 649 | |
| Age as of 1 January 2009 | ||||
| 20–24 | 92 (11·0) | 78 (10·7) | 64 (9·8) | 66 (10·2) |
| 25–29 | 66 (7·9) | 50 (6·9) | 43 (6·6) | 41 (6·3) |
| 30–34 | 59 (7·0) | 51 (7·0) | 46 (7·1) | 44 (6·8) |
| 35–39 | 93 (11·1) | 81 (11·1) | 71 (10·9) | 72 (11·1) |
| 40–44 | 144 (17·2) | 128 (17·6) | 117 (18·0) | 117 (18·0) |
| 45–49 | 154 (18·4) | 139 (19·1) | 125 (19·2) | 125 (19·3) |
| 50–54 | 97 (11·6) | 84 (11·6) | 75 (11·5) | 77 (11·9) |
| 55–59 | 69 (8·2) | 63 (8·7) | 59 (9·1) | 56 (8·6) |
| ≥60 | 64 (7·6) | 53 (7·3) | 50 (7·7) | 51 (7·9) |
| Sex | ||||
| Male | 353 (42·1) | 295 (40·6) | 259 (39·8) | 262 (40·4) |
| Female | 485 (57·9) | 432 (59·4) | 391 (60·2) | 387 (59·6) |
| Household size, mean (range) | 4·7 (1–14) | 4·7 (1–14) | 4·7 (1–13) | 4·7 (1–13) |
| Had children aged <5 years | ||||
| No | 678 (80·9) | 584 (80·3) | 523 (80·5) | 526 (81·0) |
| Yes | 160 (19·1) | 143 (19·7) | 127 (19·5) | 123 (19·0) |
| Had children aged 5–19 years | ||||
| No | 325 (38·8) | 272 (37·4) | 242 (37·2) | 241 (37·1) |
| Yes | 513 (61·2) | 455 (62·6) | 408 (62·8) | 408 (62·9) |
| Reported influenza vaccine in respective surveysa | ||||
| No | 756 (90·2) | 711 (97·8) | 613 (94·3) | 638 (98·3) |
| Yes | 82 (9·8) | 16 (2·2) | 37 (5·7) | 11 (1·7) |
| Seroconverted | ||||
| No | – | 629 (86·5) | 596 (91·7) | 599 (92·3) |
| Yes | – | 98 (13·5) | 54 (8·3) | 50 (7·7) |
| Serological evidence of infectionb | ||||
| No | – | 629 (86·5) | 575 (93·8) | 564 (93·2) |
| Yes | – | 98 (13·5) | 38 (6·2) | 41 (6·8) |
Unless otherwise stated, numbers in brackets are column percentages.
Influenza vaccines reported at enrolment and within period A would contain only seasonal influenza strains, while those reported within periods B and C would contain the H1N1pdm09 strain.
For periods B and C, excludes observations from individuals who received vaccines containing the H1N1pdm09 strain.
Table 2.
Comparison of H1N1pdm09‐positive cases amongst influenza‐like illness (ILI) samples submitted to the National Public Health Laboratory and seroconversion rates from this study by study period
| Period of epidemic activity by epidemiological week | H1N1pdm09 positive in ILI samples (%)a | % seroconverted (%)b | PCR versus SCc ratio |
|---|---|---|---|
| Period A: 2009 week 21 to 2009 week 39 | 1468 (52·1) | 13·5% (51·0) | 1·02 |
| Period B: 2009 week 40 to 2010 week 10 | 612 (21·7) | 6·2% (23·4) | 0·93 |
| Period C: 2010 week 14 to 2010 week 36 | 739 (26·1) | 6·8% (25·6) | 1·02 |
| Entire study period | 2819 (100) | 26·5% (100)d | 1·00 |
Numbers in brackets are the proportionate incidence occurring in the period.
Based on number of ILI samples testing positive for H1N1pdm09 at the National Public Health Laboratory.
Excludes observations from individuals reporting receipt of vaccines against H1N1pdm09.
Ratio of percentages in respective columns.
Based on the sum of seroconversions in all three periods, with each period having an equal weight.
Figure 2 shows the distribution of titres across the 6 serological samples in the respective periods when subjects reported influenza vaccination. While antibody titres rose in the samples taken immediately after vaccination, the change between samples 1 and 3 amongst those vaccinated in period A was not substantively different from what would be expected from H1N1pdm09 infections when compared against unvaccinated controls after adjusting for age; higher GMTs from samples 4 to 6 were observed because 38% of those vaccinated in period A also subsequently received the H1N1pdm09 vaccine in period B. The effect of receiving the H1N1pdm09 vaccine is demonstrated clearly in those vaccinated in periods B and C, where there is a significant change in GMT between samples 3 and 4 and between samples 4 and 6, respectively – not observed in those who were never vaccinated. This is also clear when comparing seroconversions between unvaccinated and vaccinated individuals in the three periods. In period A, 18·8% of those who reported receiving the seasonal influenza vaccine seroconverted compared with 13·4% of those who did not (P = 0·465). In periods B and C, 43·2% and 54·6% of those who reported receiving the vaccine seroconverted compared with 6·2% and 6·8% of those who did not (P < 0·001 in both cases). As it is not possible to distinguish between seroconversions due to infection and those due to vaccination, we excluded those who reported vaccination in periods B and C from subsequent analyses for the specific periods when vaccination took place.
Figure 3 shows the differences in age distribution of infections across time periods. There were significantly fewer infections in the 20–24 age group in period B compared with A and also significantly fewer infections in the 40–49 age group in periods B and C compared with A. Within most age groups, there is an inverse relationship between seroconversion during a period and the proportion with antibodies by HI during the start of the period. In all age groups, seroconversions in period A resulted in higher titres at the end of the period (sample 2/3), which were then accompanied by fewer seroconversions in period B in all except the age groups 25–29 (Figure 3C) and 55–59 (Figure 3I). We also observed a decrease from samples 2/3 to sample 4 in the proportion with titres ≥10 for all ages below 50, accompanied by a subsequent increase in seroconversions in period C in the age group 20–24 (Figure 3B) and the three age groups spanning 35–49 (Figure 3E–G).
Figure 3.
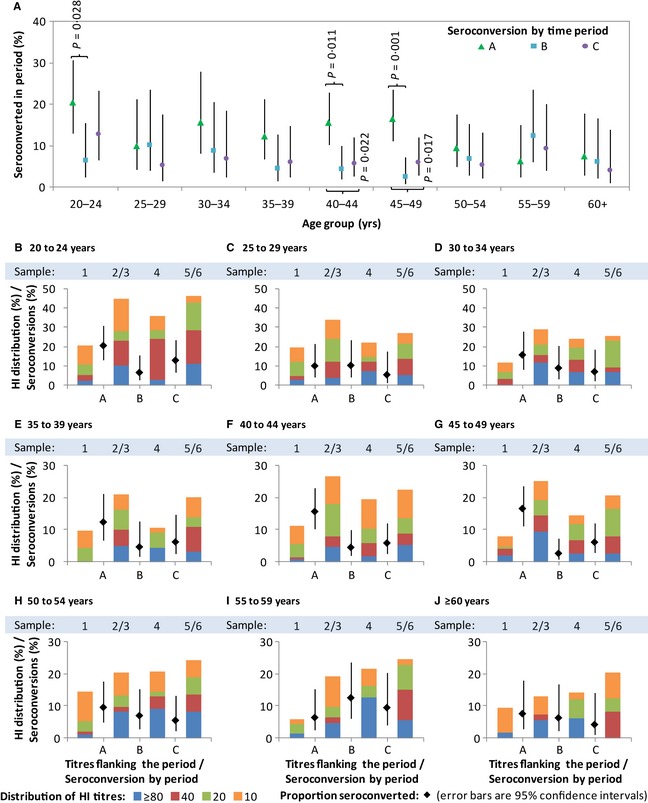
Seroconversion rates and distributions of HI antibody titres by time period and age group. Graph A shows seroconversion rate by time period and age group. Graphs B–J show, within each age group, seroconversion rates (in dots with error bars) by time period and HI distributions (in coloured bars) by sample number. Sample 2/3 refers to sample 3 when available and sample 2 when sample 3 is not available; sample 5/6 refers to sample 6 when available and sample 5 when sample 6 is not available. Observations from individuals following receipt of influenza vaccination in periods B and C were excluded.
Figure 4 shows the results of univariate and multivariate analyses to evaluate the association of variables with seroconversion amongst subjects within each period and across all three periods combined. After adjusting for the effect of other covariates, in particular the HI titres at the start of that period, periods B and C still had overall lower odds of seroconversion than period A. Significantly higher odds of seroconversion between the youngest (age <25 years) and older age groups were observed only in period A (Figure 4A), although the combined analysis does suggest that those aged 50 and above had a lower odds of infection over the three epidemic periods (Figure 4D). Women consistently had significantly lower odds of seroconversion than men in period B and in the combined analysis (Figure 4B,D). Households with more members (larger household size) were associated with higher odds of seroconversion in periods A and C and in the combined analysis. There was an inverse relationship between HI titres at the start of the period and seroconversion during that period across all three periods, although this was statistically significant on multivariate analyses only in period A and in all three periods combined. Seroconversion in the previous period was associated with lower odds of seroconversion on univariate analysis, but not after adjusting for the effect of HI titres in the preceding period, which was the dominant factor. We found no significant relationship between self‐reported prior receipt of seasonal vaccine on odds of seroconversion. On testing for interactions between time period and other covariates in the combined analysis, the only significant interactions detected were those confirming a difference between periods A and B in the effect of having household members of different ages (Figure 4A versus 4B).
Figure 4.
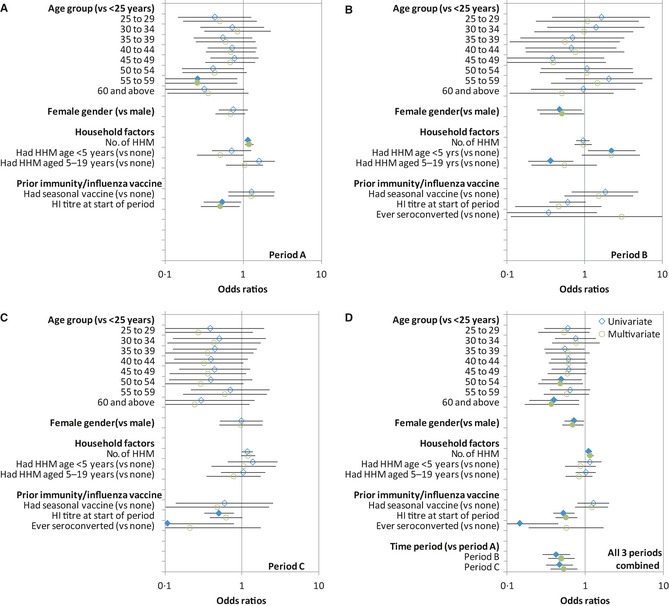
Univariate and multivariate analyses of possible risk factors for serological evidence of infection with influenza H1N1pdm09. Graphs A–C show the odds ratios for seroconversion on univariate (blue diamonds) and multivariate (green circles) analyses with 95% error bars comparing the different variables to the base variable indicated in the y‐axis, for periods A–C, respectively, while graph D shows the same analysis but for all three periods combined. Multivariate models include all variables shown for the corresponding univariate analyses in the respective panels. Closed symbols and open symbols denote results significant and non‐significant at P < 0·05, respectively. Observations from individuals following receipt of influenza vaccination in periods B and C were excluded.
Because higher titres can reduce the ability to detect seroconversion,15 we used self‐reported ARI episodes as an alternative outcome independent of HI titres to investigate the effect of higher titres on protection against infection and the effect of vaccination. For all three periods combined, there was significant evidence that those with higher titres were less likely to have had an ARI [OR of 0·89 (95% CI 0·81–0·97, P = 0·013) per twofold increase in titre]; this was also possible for the individual periods although they were not statistically significant [OR of 0·90 (95% CI 0·74–1·10), 0·96 (0·84–1·09) and 0·91 (0·79–1·04) per twofold increase in titre for periods A, B and C, respectively]. Self‐reported ARI episodes were also less common in period C for those who received influenza vaccination in period B although it was not significant [OR of 0·80 (95% CI 0·38–1·68, P = 0·553)].
Discussion
Influenza pandemics have been shown to exhibit different epidemiological patterns across different regions. While mortality rates in the 1918 pandemic were generally greater in the 2nd wave than the 1st and 3rd waves worldwide,2, 16 the 2nd wave of the 1968 pandemic resulted in higher mortality in England, France, Japan and Australia but not in North America.3 The H1N1pdm09 pandemic provided a rare opportunity to determine the epidemiology of successive epidemic waves of a new influenza virus, especially in the tropics where epidemiological patterns differ from those in temperate regions.
As in previous studies, we used serological conversion rates to represent likely infection rates.11, 17 From existing laboratory ILI surveillance data, it is apparent that there were three periods of increased H1N1pdm09 activity from June to September 2009, from November 2009 to February 2010 and from April to June 2010, with the 2nd and 3rd waves of infection likely to have arisen as a consequence of continued circulation of H1N1pdm09 viruses during Singapore's common influenza epidemic months in the middle and end of the calendar year.
The seroconversion rate of 13·5% during the first epidemic wave was the highest of the 3 waves, decreasing to 6·2% and 6·8% in subsequent waves. The odds of seroconversion during the 2nd and 3rd waves were also lower than those in the first wave. This may be due to the large number of individuals who were infected and developed immunity in the initial wave and were hence less likely to be infected in subsequent waves, with the lower resultant force of infection on transmission of influenza in the population. This is suggested by the lower odds of seroconversion for those with prior seroconversion and higher HI titres at the start of the respective periods (Figure 4). However, there was also some suggestion of a reduction in the levels of immunity (as seen in some age groups in Figure 3) prior to the start of the third wave; this may have allowed slightly more H1N1pdm09 activity in period C as compared to B, as was apparent in both in the ILI data and seroconversion rates for the respective periods. We also note that fluctuations in the distribution of antibody titres from samples 3 to 6 were small. This may be due to the absence of strong seasonal factors in Singapore, with population level immunity reaching an equilibrium soon after the first wave. Decays in individual immunity may then be topped up by new infections to maintain a stable herd immunity profile, with only small oscillations between outbreaks.
Comparing seroconversions by age groups across the three waves, there were significantly fewer infections in the 20–24 age group in the second wave compared with the first wave and significantly fewer infections in the 40–49 age group in the second and third waves compared with the first wave. This could be due to more infections in those age groups in the first wave (Figure 3), which reduced the susceptible pool in subsequent waves. The reason for the greater risk of infection in the first wave could be that these age groups comprise young adults in the conscript Singapore military18 and tertiary educational institutions with more intense interactions between individuals and adults with young school‐going children as a conduit of spread.
Overall, those aged >60 had lower odds of seroconversion even after adjusting for the effect of antibody titres. This has also been observed in various studies across the world19, 20, 21 and could be due to a higher prevalence of pre‐existing immunity from antibodies to the H1N1pdm09 virus or protective mechanisms such as T‐cell‐mediated immunity, which might either protect these individuals from infection or reduce our ability to detect seroconversion upon infection.22 Being part of a larger household in general resulted in independently higher odds of seroconversion, possibly due to the increased opportunity for exposure to infected family members at home,23 especially in the Singapore setting where larger households mostly comprise additional young children who have been shown to be possible conduits of infection.24
Not surprisingly, we found that higher HI titres at the beginning of a period reduce the likelihood of seroconversion during that period (Figures 3 and 4). A similar but weaker relationship was demonstrated independently using self‐reported ARI as an outcome, suggesting that existing antibodies as determined by HI assays were truly protective against subsequent infection. We did not observe any significant relationship between vaccination against seasonal influenza strains and seroconversion to A/California/7/2009 in the subsequent period, which is unsurprising given the poor match between previous vaccine strains and H1N1pdm09. We did assess whether vaccination against H1N1pdm09 in period B decreased the chance of seroconversion to A/California/7/2009 in period C, but no effect was found (data not shown in view of concerns about the validity of serological endpoints to assess infection following receipt of a vaccine with a matched strain).14 However, we did find that those with vaccination against H1N1pdm09 had decreased odds of reporting clinical symptoms, although the small number of vaccinated individuals makes this result suggestive but not significant. Additional cohort studies using RT‐PCR to confirm diagnosis are needed to clarify the efficacy of vaccination on infection in view of mixed results in a recent study.25
There are some limitations to the current study. Serum was titrated to 1:1280, preventing the detection of seroconversion amongst those with a titre of 1:640 or above at the start of any time period. However, the effect of this truncation is likely to be slight, for only two individuals (with titres of 1:640 and 1:1280) across samples 4–6 could have had an actual fourfold rise missed. Children were not included in our cohort due to difficulty in recruitment – children are possible conduits for infection, and understanding their infection rates and risk factors is important for future studies. The timing of serological samples for the 2nd and 3rd waves was determined a priori based on historical epidemic periods, possibly resulting in sampling gaps. In particular, waning of antibody titres may have reduced the number of seroconversions detected, particularly during the 2nd wave. The timing of sample 4, which was collected in early April after the 3rd wave of infections started, may have increased and decreased the number of seroconversions attributed to the 2nd and 3rd waves, respectively. The gap may also have led to the relatively low seroconversion rates amongst those reporting receipt of H1N1pdm09 vaccine. ARI, which we used as an alternative to seroconversions in exploring the effect of preceding titres and vaccination status, is a crude outcome measure. Other than general recall biases associated with the long gap between later surveys (after sample 3), the use of more specific indicators such as ILI was not possible because not all individuals could recall fever associated with these illness episodes; it also does not distinguish other possible aetiologies which may differ in their risk factors. The study design was also inadequate for examining the effect of influenza vaccinations, given our use of serologic endpoints to assess the effect of H1N1pdm09 vaccine. We also could not ascertain the timing of past seasonal influenza vaccinations when assessing the effect of these on risk of infection with H1N1pdm09. Future studies could explore more frequent intervals of blood sampling, phone interviews and possibly even virological sampling when symptomatic coupled with verification of vaccination records through healthcare providers, although this has to be balanced with overall costs and dropout rates with frequent sampling and more intensive data collection. Finally, additional studies are needed to explore severity measures such as hospitalizations and mortality to determine whether these were different across the epidemic waves and to ascertain whether there was evidence of heterotypic immunity, particularly in 2010 when all three influenza subtypes circulated.
Conclusion
The 2nd and 3rd epidemic waves of H1N1pdm09 infection in Singapore had lower serological attack rates amongst adults compared with the 1st wave. Across the waves, the elderly and those with higher HI titres in the preceding period were at lower risk of seroconversion, while those with larger households were at greater risk of seroconversion.
Addendum
Mark IC Chen, Yee Sin Leo and Vernon Lee involved in study design, manuscript writing and statistical analyses; Alex R Cook involved in statistical analyses and manuscript writing; Wei Yen Lim performed design and conduct of community cohort sampling and wrote the manuscript; Raymond Lin, Lin Cui and Vincent Chow contributed to study design, laboratory support and manuscript writing; Ian G. Barr and Anne Kelso involved in laboratory testing and manuscript writing; Hsu Jung Pu gave laboratory support and testing and wrote the manuscript; Rob Shaw organized and performed laboratory testing; Serene Chew involved in study coordination and laboratory testing; Joe Kwan Yap and Meng Chee Phoon contributed to laboratory support and testing; Hiromi WL Koh and Huili Zheng involved in data cleaning and statistical analysis; and Linda Tan contributed to operational management of the community cohort study.
Conflict of interest
Vernon JM Lee had received unrelated research funding from GSK; Yee‐Sin Leo is a consultant to Sanofi‐Pasteur; and all the other authors have no competing interest.
Acknowledgements
This project was funded by grants NMRC H1N1‐005 and PPG10‐09 in Singapore. The WHO Collaborating Centre for Reference and Research on Influenza is supported by the Australian Government Department of Health and Ageing. We would also like to acknowledge Nataline Tang Yan Ling, Dollyn Quek Liying and Loh Pei Ling from the National Public Health Laboratory for their contribution towards processing and testing of laboratory samples.
Chen et al. (2013) Factors influencing infection by pandemic influenza A(H1N1)pdm09 over three epidemic waves in Singapore. Influenza and Other Respiratory Viruses 7(6), 1380–1389.
References
- 1. Taubenberger JK, Morens DM.1918 Influenza: the mother of all pandemics.Emerg Infect Dis 2006; 12:15–22. [DOI] [PMC free article] [PubMed] [Google Scholar]
- 2. Viboud C, Grais RF, Lafont BA, Miller MA, Simonsen L. Multinational Influenza Seasonal Mortality Study Group . Multinational impact of the 1968 Hong Kong influenza pandemic: evidence for a smoldering pandemic.J Infect Dis 2005; 192:233–248. [DOI] [PubMed] [Google Scholar]
- 3. Miller MA, Viboud C, Balinska M, Simonsen L. The signature features of influenza pandemics–implications for policy. N Engl J Med 2009; 360:2595–2598. Epub 2009 May 7. [DOI] [PubMed] [Google Scholar]
- 4. WHO Influenza‐like illness in the United States and Mexico: World Health Organization [internet]. 2012. Available at http://www.who.int/csr/don/2009_04_24/en/index.html (Accessed 12 October 2012).
- 5. Lee VJ, Yap J, Ong JB et al Influenza excess mortality from 1950‐2000 in tropical Singapore.PLoS ONE 2009; 4:e8096. [DOI] [PMC free article] [PubMed] [Google Scholar]
- 6. Saat Z, AbdulRashid TR, Yusof MA et al Seasonal influenza virus strains circulating in Malaysia from 2005 to 2009. Southeast Asian J Trop Med Public Health 2010; 41:1368–1373. [PubMed] [Google Scholar]
- 7. Yang L, Ma S, Chen PY et al Influenza associated mortality in the subtropics and tropics: results from three Asian cities.Vaccine 2011; 29:8909–8914. [DOI] [PMC free article] [PubMed] [Google Scholar]
- 8. Russell CA, Jones TC, Barr IG et al The global circulation of seasonal influenza A (H3N2) viruses.Science 2008; 320:340–346. [DOI] [PubMed] [Google Scholar]
- 9. Cutter JL, Ang LW, Lai FY, Subramony H, Ma S, James L.Outbreak of pandemic influenza A (H1N1pdm09) in Singapore, May to September 2009.Ann Acad Med Singapore 2010; 39:273–282. [PubMed] [Google Scholar]
- 10. Ong JB, Chen MI, Cook AR et al Real‐time epidemic monitoring and forecasting of H1N1pdm09 using influenza‐like illness from general practice and family doctor clinics in Singapore.PLoS ONE 2010; 5:e10036. [DOI] [PMC free article] [PubMed] [Google Scholar]
- 11. Chen MI, Lee VJ, Lim WY et al 2009 Influenza H1N1 seroconversion rates and risk factors among distinct adult cohorts in Singapore.JAMA 2010; 303:1383–1391. [DOI] [PubMed] [Google Scholar]
- 12. Kendal AP, Pereria MS, Skehel J.Concepts and Procedures for Laboratory‐Based Influenza Surveillance.Geneva, Switzerland: World Health Organization, 1982. [Google Scholar]
- 13. Chen MI, Barr IG, Koh GC et al Serological response in RT‐PCR confirmed H1N1pdm09 influenza a by hemagglutination inhibition and virus neutralization assays: an observational study.PLoS ONE 2010; 5:e12474. [DOI] [PMC free article] [PubMed] [Google Scholar]
- 14. Petrie JG, Ohmit SE, Johnson E, Cross RT, Monto AS.Efficacy studies of influenza vaccines: effect of end points used and characteristics of vaccine failures.J Infect Dis 2011; 203:1309–1315. [DOI] [PMC free article] [PubMed] [Google Scholar]
- 15. Beyer WE, Palache AM, Luchters G, Nauta J, Osterhaus AD.Seroprotection rate, mean fold increase, seroconversion rate: which parameter adequately expresses seroresponse to influenza vaccination? Virus Res 2004; 103:125–132. [DOI] [PubMed] [Google Scholar]
- 16. Lee VJ, Chen MI, Chan SP et al Influenza pandemics in Singapore, a tropical, globally connected city.Emerg Infect Dis 2007; 13:1052–1057. [DOI] [PMC free article] [PubMed] [Google Scholar]
- 17. Laurie KL, Huston P, Riley S et al Influenza serological studies to inform public health action: best practices to optimise timing, quality and reporting. Influenza Other Respi Viruses 2013; 7:211–224. [DOI] [PMC free article] [PubMed] [Google Scholar]
- 18. Lee VJ, Yap J, Cook AR et al Effectiveness of public health measures in mitigating pandemic influenza spread: a prospective sero‐epidemiological cohort study.J Infect Dis 2010; 202:1319–1326. [DOI] [PubMed] [Google Scholar]
- 19. Hancock K, Veguilla V, Lu X et al Cross‐reactive antibody responses to the 2009 pandemic H1N1 influenza virus.N Engl J Med 2009; 361:1945–1952. [DOI] [PubMed] [Google Scholar]
- 20. Gözalan A, Altaş AB, Sevencan F et al Seroprevalence following the first wave of pandemic influenza A (H1N1) in Turkey, 2009.Jpn J Infect Dis 2012; 65:13–18. [PubMed] [Google Scholar]
- 21. Miller E, Hoschler K, Hardelid P, Stanford E, Andrews N, Zambon M.Incidence of 2009 pandemic influenza A H1N1 infection in England: a cross‐sectional serological study.Lancet 2010; 375:1100–1108. [DOI] [PubMed] [Google Scholar]
- 22. Hsu JP, Phoon MC, Koh GC et al Comparison of neutralizing antibody and cell‐mediated immune responses to pandemic H1N1 2009 influenza virus before and after H1N1 2009 influenza vaccination of elderly subjects and healthcare workers.Int J Infect Dis 2012; 16:e621–e627. [DOI] [PubMed] [Google Scholar]
- 23. Lau LL, Nishiura H, Kelly H, Ip DK, Leung GM, Cowling BJ.Household transmission of 2009 pandemic influenza A (H1N1): a systematic review and meta‐analysis.Epidemiology 2012; 23:531–542. [DOI] [PMC free article] [PubMed] [Google Scholar]
- 24. Klick B, Nishiura H, Ng S et al Transmissibility of seasonal and pandemic influenza in a cohort of households in Hong Kong in 2009.Epidemiology 2011; 22:793–796. [DOI] [PMC free article] [PubMed] [Google Scholar]
- 25. Ohmit SE, Petrie JG, Malosh RE et al Influenza Vaccine Effectiveness in the Community and the Household. Clin Infect Dis 2013; 56:1363–1369. [DOI] [PMC free article] [PubMed] [Google Scholar]