

Abstract
Background
In 2010, the Tennessee Department of Health, in collaboration with the Centers for Disease Control and Prevention (CDC), expanded influenza surveillance in Tennessee to include other respiratory viruses.
Objectives
To determine the prevalence and seasonality of influenza and other respiratory viruses during the influenza seasons of 2010–2012.
Methods
Nasal and nasopharangeal swabs/washings from persons with influenza‐like illness were collected across Tennessee. Influenza and other respiratory viruses were identified using a molecular‐based respiratory virus panel. Influenza A positives were subtyped using real‐time PCR according to the CDC protocol. Data were analyzed to describe frequency and seasonality of circulating strains.
Results
Of the 933 positive specimens, 60·3% were identified as influenza viruses, 19·8% rhinovirus/enterovirus, 8·6% respiratory syncytial virus (RSV), 5·8% metapneumovirus, 3·0% adenovirus, and 2·5% parainfluenza viruses. In the 2010–2011 season, influenza B was prominent during weeks 48–3, while influenza A(H1N1) was most frequently identified during weeks 4–10. Influenza A(H3N2) was present at lower levels during weeks 48–17. However, in the 2011–2012 season, overall numbers of influenza cases were reduced and influenza A (H3N2) was the most abundant influenza strain. The expanded surveillance for other respiratory viruses noted an increase in identified specimens from the first to the second season for adenovirus, metapneumovirus, RSV, and rhinovirus/enterovirus.
Conclusions
This study provides data of the influenza strains in circulation in Tennessee. It also establishes a baseline and time of year to expect other respiratory viruses that will aid in detecting outbreaks of non‐influenza respiratory viruses in Tennessee.
Keywords: Adenovirus, influenza, respiratory syncytial virus, rhinovirus, surveillance, Tennessee
Introduction
During the 2009 H1N1 pandemic, CDC reported that states received 43 771 confirmed or probable cases of H1N1 between April 15 and July 24.1 In Davidson County, Tennessee, United States (US), emergency departments visits attributable to influenza A 2009 H1N1 pandemic [hereafter, A(H1N1)pdm09] were 10 per 1000 residents.2 The 2009 pandemic demonstrated that it is of great importance to have surveillance programs for respiratory viruses to quickly and accurately deploy a method to control a possible outbreak.3, 4 A positive consequence of the emergence of the A(H1N1)pdm09 strain and the emergence of H5N1 avian influenza is that many countries have established surveillance programs to detect outbreaks earlier.5, 6, 7
The Tennessee Department of Health (TDH) and Centers for Disease Control and Prevention (CDC) began enhanced surveillance for other viruses that cause influenza‐like illness (ILI) in 2010 through the use of a respiratory viral panel. This surveillance expansion was utilized to establish a baseline for the time of year certain respiratory viruses circulate in the state of Tennessee. It is important for physicians to have knowledge of the respiratory viruses circulating in their community in order to properly diagnose and care for their patients. Respiratory viruses monitored in this surveillance effort include influenza viruses, metapneumovirus, respiratory syncytial virus (RSV), parainfluenza viruses (PIV), adenovirus, enterovirus, and rhinovirus. Influenza has the most potential to cause widespread morbidity and threaten the well‐being of those over 65 years of age and children due to its ease in transmissibility and dissemination in the community.8 Infection with metapneumovirus is often asymptomatic but has potential to cause acute respiratory tract infection in the elderly, children, and immunocompromised individuals.8 Other viruses that have the potential to cause disease in children are RSV, PIV, and adenovirus. Rhinovirus can infect adults and children, but symptoms are generally mild or patients can be asymptomatic.8 This study provides surveillance data of two influenza seasons following the 2009 influenza pandemic season and assesses the types and seasonality of other respiratory viruses in the state of Tennessee.
Materials and methods
Study setting and design
The Tennessee ILI surveillance program analyzed nasal or nasopharyngeal swabs from 60 outpatient sentinel provider sites across the state of Tennessee representing the local population at a rate of one site per 100 000 population and 20 Emerging Infections Program (EIP)‐participant hospitals in middle Tennessee. Providers were able to submit up to 10 samples per week from patients presenting with ILI during the influenza season. The test results were sent to the provider upon completion. In the 2010–2011 season, providers submitted 1144 specimens, and in the 2011–2012 season, 803 specimens were submitted. The case definition of ILI includes a fever ≥100°F (37·8°C) plus a cough or sore throat in the absence of other known cause. The result of a rapid flu test did not influence the specimens selected from sentinel or EIP sites for this study. The influenza seasons described in this publication are from October to April (CDC MMWR weeks 40–17) in 2010–2011 and 2011–2012.
Buffers and reagents
Viral transport media were used in transporting specimens to the laboratory. All other buffers and reagents except the TaKaRa Taq HS were included with the xTAG Respiratory Viral Panel (RVP) with Luminex Molecular Diagnostic's proprietary Universal Tag sorting system on Luminex xMAP platform.
Nucleic acid extraction
RNA was isolated following the manufacturer's instructions for sample extraction using the QiAMP MinElute virus Spin Kit on a QiaCube (Qiagen Inc., Valencia, CA, USA).
Respiratory Viral Panel assay
The Luminex RVP assay was performed on the respiratory specimens according to the manufacturer's protocol. Briefly, nucleic acid extraction was followed by multiplex reverse transcriptase PCR (RT‐PCR) for any of 12 possible respiratory viruses [influenza A, A(H1N1), A(H3N2), influenza B, RSV‐A, RSV‐B, PIV‐1, PIV‐2, PIV‐3, Rhinovirus/enterovirus, adenovirus, and metapneumovirus]. It should be noted that the rhinovirus primers in the Luminex RVP product cross‐react with enterovirus. The RT‐PCR product was treated with exonuclease I and shrimp alkaline phosphatase to inactivate remaining nucleotides and degrade left over primers. Next, multiplex target‐specific primer extension placed target‐specific tags on any amplified nucleic acid from the RT‐PCR. Last, fluorescent beads were hybridized to the target‐specific tags and were detected by the Bioplex‐200 instrument. xTAG Data Analysis Software analyzed the control and specimen data to determine the presence or absence of each respiratory virus.9
Polymerase Chain Reaction for Influenza
The FDA‐approved, CDC Human Influenza Virus Real‐Time RT‐PCR Diagnostic Panel was utilized to subtype influenza A‐positive specimens. CDC‐approved quantitative real‐time RT‐PCR protocol for influenza A subtyping was utilized to subtype influenza A‐positive specimens.10 There are no available CDC PCR protocols for determining lineage of influenza B, and other methods for determining lineage were not pursued in this study.
Ethics
This study was Institutional Review Board exempt because the data obtained were for public health surveillance purposes.
Statistical methods
Figures and calculations for descriptive statistics were calculated using Microsoft Excel (2003).
Results
Two influenza seasons (2010–2011 and 2011–2012) produced 2247 nasal and nasopharangeal swabs/washings for testing at the TDH Division of Laboratory Services. Of the 2247 specimens submitted, 933 (41·5%) were identified to be positive for a respiratory virus and the weekly average was 35·7% (Figure 1A). Of the 933 positive specimens, 563 (60·3%) were positive for influenza viruses: 368 of 563 (65·4%) were influenza A [188 (33·4%) A(H1N1)pdm09 and 180 (32·0%) A(H3N2)] and 195 (34·6%) were influenza B. The next most common respiratory virus detected was rhinovirus/enterovirus, which accounted for 185 (19·8%) of all cases. In addition, 54 (5·8%) specimens were positive for metapneumovirus, 51 (5·5%) for RSV‐B, 29 (3·1%) for RSV‐A, 28 (3·0%) for adenovirus, and 23 (2·5%) for PIV. Of the PIV, 9 (1·0%) were PIV‐1, 6 (0·6%) were PIV‐2, and 8 (0·9%) were PIV‐3 (Figure 1B). The data show that the average percentage of positive isolates per week for influenza decreased from 19·4% in the 2010–2011 season to 9·3% in the 2011–2012 season for patients presenting to the healthcare facilities with ILI. However, the average percentage of specimens testing positive per week for adenovirus increased from 0·5% to 2·1%, metapneumovirus from 1·7% to 4·0%, RSV from 2·4% to 3·8%, and rhinovirus/enterovirus from 10% to 14·2% over the same time period (Figure 1C).
Figure 1.
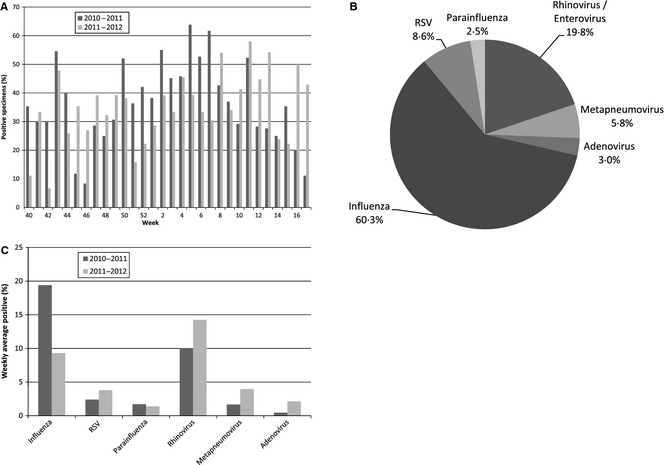
(A) Percent of specimens identified each week as positive for a respiratory virus during the 2010–2011 and 2011–2012 influenza seasons. (B) Percent breakdown of each respiratory virus type detected in Tennessee over the 2‐year period 2010–2012 of all positive respiratory viral specimens submitted. (C) The average percentage of positive isolates per week for each respiratory virus over the 2010–2011 and 2011–2012 influenza seasons. A total of 1144 specimens were submitted in the 2010–2011 season and 803 in the 2011–2012 season.
In Tennessee, the 2010–2011 influenza season following the 2009 A(H1N1) influenza pandemic had influenza‐positive specimens from weeks 48 to 14 (Figure 2A). During this season, the predominant influenza strains circulating were influenza B from weeks 48–3 and A(H1N1)pdm09 from weeks 4 to 10. Influenza A(H3N2) was present for most of the 2010–2011 influenza season, but at lower levels than influenza B or influenza A(H1N1)pdm09. Of the 637 positively identified specimens in 2010–2011, 472 were positive for influenza (74·7%). Positive specimens during the 2011–2012 were identified over a longer period of time, weeks 48–17, but the number of specimens submitted for ILI and the percent positively identified were lower compared with the previous season (1444 specimens submitted in 2010–2011 and 803 submitted specimens in 2011–2012; Figure 2B). Of the 296 positively identified specimens in 2010–2011, 91 were positive for influenza (30·7%). The 2011–2012 season revealed A(H3N2) to be the dominant strain for the whole season (weeks 48–17; peaking during weeks 8–17), accounting for 77 of 91 (85%) of all influenza specimens detected (Figure 2B). Only three specimens of influenza B and 11 specimens of A(H1N1)pdm09 were identified during the 2011–2012 season.
Figure 2.
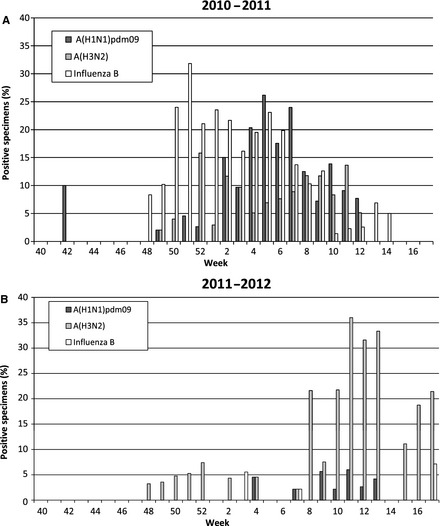
(A) Percent of submitted specimens identified each weeks as positive for influenza [A(H1N1)pdm09, A(H3N2), influenza B] during each week of the 2010–2011 influenza season. (B) Percent of submitted specimens positive for influenza during each week of the 2011–2012 influenza season. A total of 1144 specimens were submitted in the 2010–2011 season and 803 in the 2011–2012 season.
When evaluating other respiratory viruses that occurred in Tennessee from 2010 to 2012, rhinovirus/enterovirus was found to be the most abundant non‐influenza respiratory virus. The highest percent of specimens testing positive for rhinovirus/enterovirus was during weeks 40–50 (2010–2011) and weeks 43–50 (2011–2012; Figure 3A). There was a 2·4% increase in the amount of rhinovirus‐/enterovirus‐positive specimens during the 2011–2012 season (weeks 40–50) from 20·1% to 22·5%. We also found the highest percent of specimens testing positive for RSV‐B during week 11 and 15 (2010–2011) and weeks 2, 8–10, 13, and 14 (2011–2012; Figure 3B). There were lower levels of RSV‐A detected in the 2010–2011 season; however, in the 2011–2012 season, RSV‐A was detected at higher levels during weeks 3–7. For adenovirus, we found a low percent of specimens testing positive during the 2010–2011 season; however, in the 2011–2012 season, adenovirus was present periodically during weeks 45–14 (Figure 3C). During the 2010–2011 season, metapneumovirus was detected two of the weeks early in the season (weeks 43 and 47) and then again toward the end of the season (weeks 11, 13, 15); however, lower or non‐existent levels of detection during weeks 48–10. The 2011–2012 season was different in that the percent of specimens testing positive was higher during weeks 50–11 (Figure 3C). PIVs were low in both seasons except in week 42 of the 2010–2011 season where there were 10% positive specimens identified as PIV 2 and week 41 of the 2011–2012 season where there were 20% positive specimens identified as PIV 1 (Figure 3D). This study did not perform detailed regional‐ or county‐level analysis.
Figure 3.
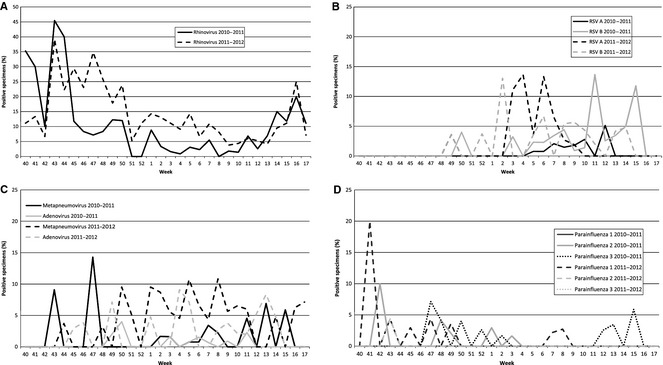
Percent of submitted specimens identified each week as positive during the 2010–2011 and 2011–2012 influenza seasons. A total of 1144 specimens were submitted in the 2010–2011 season and 803 in the 2011–2012 season. (A) RSV‐A and RSV‐B, RSV, respiratory syncytial virus; (B) metapneumovirus and adenovirus (C) parainfluenza A, B, and C, and (D) rhinovirus/enterovirus.
Discussion
The ILI surveillance programs in Tennessee are designed to monitor the circulation of different influenza strains, to detect potential outbreaks, and to inform clinical decision making in the medical community. The ILI surveillance program in Tennessee plays a contributory role in the national influenza surveillance efforts in the US and ultimately around the world. Through these programs, the TDH Laboratory Services was able to monitor two consecutive influenza seasons following the 2009 influenza A(H1N1) pandemic. A virologic cause of ILI was identified in 35·7% of all specimens submitted each week. Possible reasons for not identifying the cause of ILI in a specimen include the quality of specimen, the type of the specimen collected, amount of virus shed at the time of specimen collection, or ILI with etiology different than what the Luminex RVP product was designed to detect. These data collected in this study provide insight into the seasonality and incidence of influenza and other respiratory viruses in the state of Tennessee.
After the pandemic in 2009, the A(H1N1)pdm09 strain was the most frequently identified influenza strain in Tennessee followed by influenza B during the 2010–2011 season. However, surveillance efforts during the 2011–2012 influenza season yielded few cases of A(H1N1)pdm09 and negligible numbers of influenza B when compared with the 2010–2011 season, which reflected the data seen across most of the US11 The most frequently isolated strain in Tennessee during the 2011–2012 season was A(H3N2). Along with lower numbers of influenza detected in the 2011–2012 season, the peak in A(H3N2) cases detected in Tennessee was later than the previous season, occurring in weeks 8–17, which mirrored the national picture.11 A change in frequency and seasonality of influenza and other respiratory diseases was also reported in other parts of the world.12 In the 2011–2012 season, there was an increase in adenovirus, metapneumovirus, RSV, and rhinovirus/enterovirus detected, which may account for the significantly lower levels of influenza. It is hypothesized that increases in other viruses can interfere with the spread of influenza.12, 13, 14 However, the opposite may be said that lower rates of influenza may allow other respiratory viruses to flourish. The surveillance of respiratory viruses other than influenza, especially rhinovirus/enterovirus, contributes to a better understanding of their seasonality and baseline occurrence in the state of Tennessee. The data presented here demonstrate the program's potential ability to identify increased numbers of viral infections in a community more easily when the virus does not follow its usual pattern. It also aids in determining non‐influenza causes of ILI in populations in Tennessee. The ILI surveillance programs conducted in Tennessee can give insight into physicians in all regions of the state and provide them information concerning the current respiratory viruses in circulation. While this study did not perform detailed regional‐ or county‐level analysis, the information gathered from ILI surveillance programs of this nature could allow public health educators to employ preventive strategies to control the spread of any respiratory virus demonstrated to be in circulation in one specific region of a state.
The TDH is spending a small amount (70 specimens per week on average at $70 each or $4900 per week) to let physicians across the state know how to treat their patients with ILI. The benefit of ILI surveillance is that physicians across the state can see the percent of 12 different respiratory viruses that are circulating around the state. For example, if a physician is following the weekly data produced by the surveillance program, they will know whether most ILI for the previous week is due to rhinovirus, RSV, metapneumovirus, adenovirus, PIV, or influenza and provide the correct treatment for the current virus circulating. This results in the healthcare system getting better use of medical resources and better education of the public. It also increases satisfaction of physicians and patients who have ILI by providing a likely answer to their symptoms if the rapid flu test is negative.
The ILI surveillance program plays an essential part in understanding the types of influenza and other respiratory viruses and their role in causing disease. This aids in preparation for and detection of outbreaks of ILI in the State of Tennessee. This model of ILI surveillance will continue to provide important information to the state of Tennessee, the US, and around the world.
Funding
This research was supported in part by an appointment of the Emerging Infectious Diseases (EID) Fellowship Program administered by the Association of Public Health Laboratories (APHL) and funded by the Centers for Disease Control and Prevention (CDC) to Landes MB.
Acknowledgements
We would like to thank the Tennessee Department of Health for coordination of samples through the Sentinel Provider Network and the Emerging Infections Program hospitals.
Landes et al (2013) The frequency and seasonality of influenza and other respiratory viruses in Tennessee: two influenza seasons of surveillance data, 2010–2012. Influenza and Other Respiratory Viruses 7(6), 1122–1127.
References
- 1. 2009 H1N1 early outbreak and disease characteristics. Available at http://www.niaid.nih.gov/topics/Flu/H1N1/GeneralInfo/Pages/factsFigures.aspx#1 (Accessed 19 July 2012). Centers for Disease Control and Prevention, 2009. [Google Scholar]
- 2. Self WH, Grijalva CG, Zhu Y et al Emergency department visits for influenza A (H1N1)pdm09, Davidson County, Tennesssee, USA. Emerg Infect Dis 2012;18:863–865. [DOI] [PMC free article] [PubMed] [Google Scholar]
- 3. Lawson A, Kleinman K. Spatial and Syndromatic Surveillance for Public Health. Chichester: Wiley, 2005. [Google Scholar]
- 4. Lombardo JS, Buckeridge DL. Disease Surveillance: A Public Health Informatics Approach. Chichester: John Wiley, 2007. [Google Scholar]
- 5. World Health Organization . Standardization of terminology of the pandemic A(H1N1)2009 virus. Available at http://www.who.int/influenza/gisrs_laboratory/terminology_ah1n1pdm09/en/ (Accessed 24 July 2012).
- 6. Chuang J, Huang A, Huang W et al Nationwide Surveillance of Influenza during the Pandemic (2009–10) and Post‐Pandemic (2010–11) Periods in Taiwan. PLoS ONE 2012;7:e36120. [DOI] [PMC free article] [PubMed] [Google Scholar]
- 7. Yan P, Chen H, Zeng D. Syndromic Surveillance Systems. Ann Rev Info Sci Tech 2008;42:425–495. [Google Scholar]
- 8. Treanor J. Respiratory Infections; in Richman D, Whitley R, Hayden F. (eds): Clinical Virology, 3rd edn Washington, DC: ASM Press, 2009. [Google Scholar]
- 9. Luminex Molecular Diagnostics, Inc . xTAG® RVP (Respiratory Virus Panel). [package insert]. Toronto, ON: Luminex Molecular Diagnostics, Inc, 2009. [Google Scholar]
- 10. Centers for Disease Control . Guidance for clinicians on the use of RT‐PCR and other molecular assays for diagnosis of influenza virus infection. Available at http://www.cdc.gov/flu/professionals/diagnosis/molecular-assays.htm (Accessed 22 August 2012).
- 11. Centers for Disease Control . Seasonal influenza past weekly surveillance reports. Available at http://www.cdc.gov/flu/weekly/pastreports.htm (Accessed 28 November 2012).
- 12. Mak G, Wong A, Ho W, Lim W. The impact of pandemic influenza A (H1N1) 2009 on the circulation of respiratory viruses 2009–2011. Influenza Other Respir Viruses 2012; 6:e6–e10. [DOI] [PMC free article] [PubMed] [Google Scholar]
- 13. Linde A, Rotzen‐Ostlund M, Zweygberg‐Wirgart B, Rubinova S, Brytting M. Does viral interference affect spread of influenza? Euro Surveill 2009;14:pii: 19354. [PubMed] [Google Scholar]
- 14. Casalegno JS, Ottmann M, Bouscambert‐Duchamp M, Valette M, Morfin F, Lina B. Impact of the 2009 influenza A(H1N1) pandemic wave on the pattern of hibernal respiratory virus epidemics, France, 2009. Euro Surveill 2010;15:pii: 19485. [PubMed] [Google Scholar]