Abstract
Please cite this paper as: Larcombe et al. (2012) Factors influencing the assessment of lung function in mice with influenza‐induced lung disease. Influenza and Other Respiratory Viruses DOI: 10.1111/irv.12034.
Background The constant‐phase model (CPM) is commonly fit to respiratory system input impedance (Z rs) to estimate lung mechanics. Driving signal frequencies and the method of model fitting may influence the results, especially in cases of severe lung disease or under severe bronchoconstriction.
Objective To illustrate the effects of different CPM fits to Z rs data using a mouse model of influenza‐induced lung disease.
Methods BALB/c mice infected with influenza (or control) were challenged with methacholine. The CPM was fitted to Z rs, measured between 0·25 and 19·625 Hz, using both unweighted and weighted fits. The effect of different lowest frequencies was assessed.
Results and Conclusions For influenza‐infected mice, the unweighted fit was poor, and airway resistance (R aw) was often biologically impossible. The weighted fit provided more realistic estimates of R aw. Different model fits and minimal frequencies had little effect on tissue mechanics.
Keywords: Constant‐phase model, forced oscillation technique, influenza, mouse, severe lung disease
Introduction
Measurement of lung function forms an important part of the use of animals to model human lung diseases. The effects of respiratory system insults are often obtained through fitting mathematical models, such as the constant‐phase model (CPM), to respiratory system impedance (Z rs). The CPM partitions low‐frequency input Z rs into components representing airway mechanics, that is, airway resistance (R aw) and inertance (I aw), and a strictly constant‐phase tissue compartment characterized by the coefficients of tissue damping (G) and tissue elastance (H). 1 The CPM has been validated in a variety of species, 1 , 2 and its sensitivity has been assessed in mice. 3 The relative contributions of the airway and tissue compartments to Z rs within a given frequency range may change radically if any alterations occur predominantly in either compartment, such that the other compartment will be subjected to estimation bias. This may occur during acute bronchoconstriction where the contributions from the airway may increase markedly or in severe lung disease where the tissue component may dominate. It may be possible to alleviate the estimation bias by studying a more appropriate frequency range or by using different methods for fitting the CPM to Z rs. 3
We investigated the influence of the frequency content of the driving signal and the method used to fit the CPM to Z rs on estimates of R aw, G, and H in mice with influenza‐induced lung disease.
Methods
Eight‐week‐old female BALB/c mice, maintained under specific pathogen‐free conditions and with food and water provided ad libitum, were intranasally inoculated with 104·5 plaque‐forming units of influenza A/Mem/1/71 diluted in 50 μl of virus production serum‐free medium (VP‐SFM; Gibco, Mulgrave, Victoria, Australia). Seven mice were infected (mass 17·6 ± 1·1 g), and seven control mice (mass 18·7 ± 0·5 g) received the same volume of the supernatant of uninfected Madin–Darby canine kidney cells diluted in VP‐SFM. Influenza was grown and titrated as previously described. 4 This strain replicates to high titres 4 and causes significant disease in mice. 5
At the peak of infection, 6 mice were surgically prepared as described previously. 5 Anaesthetized, tracheostomized mice were ventilated using a flexiVent small animal ventilator (SCIREQ, Montreal, Canada) at 450 breaths per min with a tidal volume of 8 ml/kg and a positive end‐expiratory pressure of 2 cm H2O. Lung volume history was standardized via three slow (16‐s) deep inflations, spaced 1 min apart, to a pressure of 20 cm H2O and Z rs measured 1 min after increasing doses (0·1, 0·3, 1, 3, 10, and 30 mg/ml) of aerosolized methacholine (MCh; Sigma‐Aldrich, St. Louis, MO, USA) generated by an ultrasonic nebulizer (DeVilbiss UltraNeb, Somerset, PA, USA). 5 , 7 We report measurements at baseline (i.e., before any MCh) and after 30 mg/ml MCh.
Zrs was measured using the “Primewave” signal of the flexiVent small animal ventilator, which is comprised of 19 mutually prime sinusoidal frequencies (0·25, 0·625, 1·375, 2·125, 2·875, 3·875, 5·125, 5·875, 7·375, 8·375, 9·125, 10·375, 12·125, 12·875, 13·625, 15·875, 17·125, 18·625, and 19·625 Hz). The CPM 1 was used to calculate Newtonian resistance (R n), I aw, G, and H. Hysteresivity (η) was calculated as G/H. We assumed that the contribution of the lung parenchyma and the chest wall to R n was insignificantly small 8 and hence R n = R aw. I aw values were negligible and are not reported. Z rs data were imported into custom‐made analysis software (University of Szeged, Hungary) for analysis, which uses a global optimization algorithm 9 to fit the CPM to Z rs. Data were initially analyzed using the complete set of 19 frequencies using an unweighted fitting criterion:
 |
where Φ is the fitting error, and Z d(f i) and Z m(f i) correspond to the measured and model‐predicted impedance value at the ith frequency, respectively. 3 The CPM was then fitted to the measured data using a weighted fitting criterion, where non‐negative weights were incorporated into the fitting criterion:
The weighted fitting criterion scales the contribution of each frequency by the magnitude of the impedance at that frequency, such that model fit is not dominated by frequency points where Z rs is larger compared to other frequencies. Z rs data were then adjusted to alter the lowest frequency, and the model was refit using the weighted fitting criterion, such that we had one set of data which was analyzed in six ways;
-
1
Fu0·25: unweighted fit/0·25–19·625 Hz,
-
2
Fw0·25: weighted fit/0·25–19·625 Hz,
-
3
Fw1·375: weighted fit/1·375–19·625 Hz,
-
4
Fw2·875: weighted fit/2·875–19·625 Hz,
-
5
Fw3·875: weighted fit/3·875–19·625 Hz, and
-
6
Fw5·125: weighted fit/5·125–19·625 Hz.
Results
Baseline Lung Function
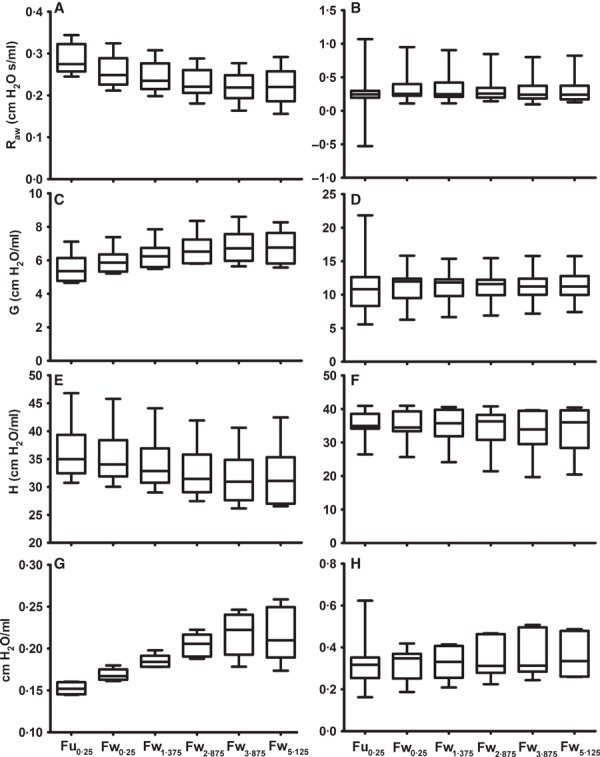
Applying a weighted CPM fit to Z rs spectra (compared to an unweighted fit) had the greatest influence on estimates of R aw at baseline, and this effect was more pronounced for influenza‐infected mice compared to controls (Figure 1). For infected mice, the unweighted fit resulted in the lowest and most variable estimation of R aw (0·25 ± 0·46 cm H2O s/ml) for any fitting criterion. This was a reflection of the CPM returning a negative (and biologically impossible) R aw (−0·53 cm H2O s/ml) for one of the seven mice in this group when the Fu0·25 was used. Applying the Fw0·25 fitting scheme to this measurement resulted in a more biologically realistic R aw (0·39 cm H2O s/ml). This skewing of R aw using the Fu0·25 criterion had the flow on effect of increasing G for infected mice. Employing a weighted fitting of the CPM for influenza‐infected mice resulted in a reduction in the SD of baseline R aw and G, regardless of the frequency range used. At baseline, increasing the lowest frequency of the driving signal had little effect on estimates of, or variability in, measurements of R aw, G, or H beyond the difference made by applying the Fw0·25 (Figure 1).
Figure 1.

Box and whisker plots of baseline airway resistance (R aw), tissue damping (G), tissue elastance (H), and hysteresivity (η) of BALB/c mice, 4 days post‐inoculation with influenza A (B, D, F and H) or control solution (A, C, E and G) using different methods of fitting the constant‐phase model to Z rs spectra. Note different scales.
Maximum response to MCh (30 mg/ml)
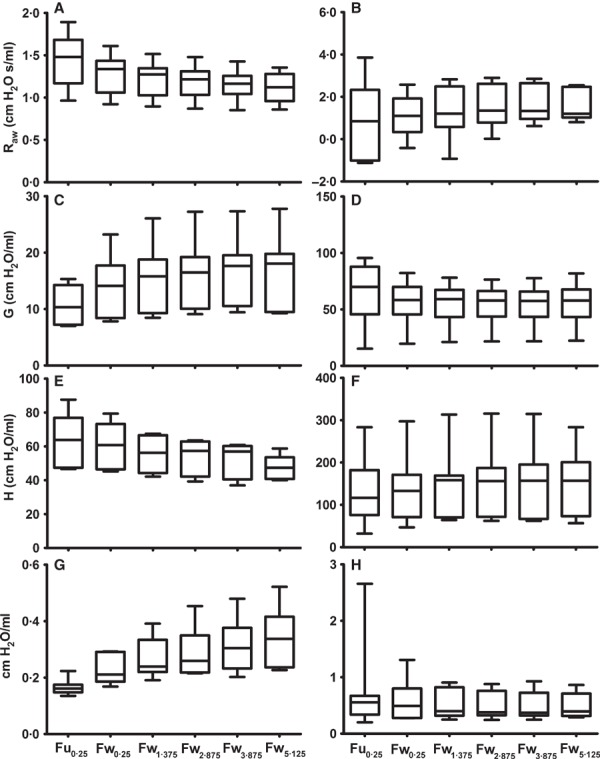
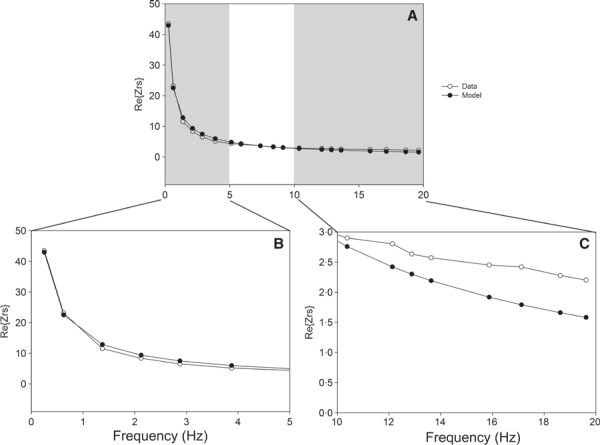
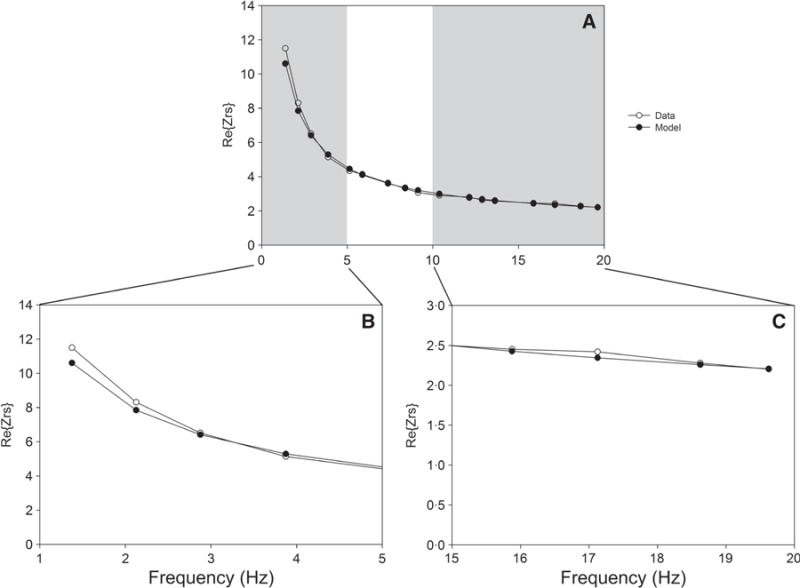
A similar pattern was noted for R aw after exposure to 30 mg/ml MCh (Figure 2). Again, when using the Fu0·25 fitting criterion, R aw for infected mice was underestimated due to three of the seven mice in this group returning a negative estimation of R aw. Applying the Fw0·25 fitting scheme resulted in non‐negative estimates of R aw for two of these mice; however, it was not until the minimum frequency was increased to 1·375 Hz that six of the seven infected mice returned biologically realistic estimates of R aw (Figure 2). The seventh mouse required a minimum driving signal frequency of 5·125 Hz before a realistic estimate of R aw was achieved. Considerable alterations in estimates of G and H were also observed when using the Fw0·25 compared to the Fu0·25; however, increasing the minimum driving signal frequency beyond 1·375 Hz resulted in little change in these measurements or their variability (Figure 2). Representative impedance spectra and CPM fit for an influenza‐infected mouse after exposure to 30 mg/ml MCh are shown in Figures 3 (Fu0·25) and 4 (Fw1·375). These figures illustrate the improved fit of the CPM to Z rs, particularly in panels C.
Figure 2.

Box and whisker plots of maximum (after exposure to 30 mg/ml MCh) airway resistance (R aw), tissue damping (G), tissue elastance (H), and hysteresivity (η) of BALB/c mice, 4 days post‐inoculation with influenza A (B, D, F and H) or control solution (A, C, E and G) using different methods of fitting the constant‐phase model to Z rs spectra. Note different scales.
Figure 3.

Representative “real part” of the impedance spectrum and constant‐phase model (CPM) fit for an influenza‐infected mouse after exposure to 30 mg/ml MCh, using the Fu0·25: unweighted fit/0·25–19·625 Hz criterion. Panel A shows the entire Z rs, while panels B and C zoom in on either end of the Z rs. For this individual, R aw = −0.73 cm H2O s/ml, G = 47.25 cm H2O/ml, and H = 90.61 cm H2O/ml. Open circles represent Z rs measured at each frequency, and closed circles represent CPM fit. The data shown in Figure 4 are for the same measurement from the same mouse, using an alternative fit criterion.
Figure 4. Representative “real part” of the impedance spectrum and constant‐phase model (CPM) fit for an influenza‐infected mouse after exposure to 30 mg/ml MCh, using the Fw1·375: weighted fit/1·375–19·625 Hz criterion. Panel A shows the entire Z rs, while panels B and C zoom in on either end of the Z rs. For this individual, R aw = 0.85 cm H2O s /ml, G = 37.31 cm H2O/ml, and H = 121.57 cm H2O/ml. Open circles represent Z rs measured at each frequency, and closed circles represent CPM fit. The data shown in Figure 3 are for the same measurement from the same mouse, using an alternative fit criterion.

Discussion
This study illustrates the importance of selecting appropriate settings for the measurement of lung mechanics when applying the CPM to Z rs spectra. The greatest differences were found when comparing an unweighted (Fu0·25) fit of the CPM to Z rs spectra with any of the weighted fitting criteria. Applying a weighted fit of the CPM to Z rs spectra can improve measures of lung mechanics under acutely bronchoconstricted conditions by preventing undue contributions from the lower frequencies, which have intrinsically larger magnitudes. In severe lung disease, such as that caused by influenza infection, Z rs may increase even further at low frequencies, and the negative frequency dependence of the real part of Z rs may strengthen 10 , 11 , 12 leading to misestimation of R aw. We have also shown that selecting different lowest frequencies of the forced oscillation signal can have considerable impacts on the estimation of CPM parameters. Generally, we identified slight differences in the model fit with increasing lowest frequency, up to a point where the potential benefits of the removal of additional low frequencies were outweighed by the loss of degrees of freedom of the model.
Our data show that the frequencies of a forced oscillation technique signal should be carefully selected so that the measured Z rs as a result of the tissues and airways has an equal “opportunity” to contribute to parameters specified in the model. Selection of an appropriate frequency range is dependent on multiple factors including species and disease state. Under the particular set of circumstances employed in the current study (i.e., mice with influenza), an unweighted fit and frequency range of 1·375–19·625 Hz provided the most realistic measurements. When undertaking studies that apply the CPM to Z rs spectra, researchers need to be aware that fitting criteria and frequency selection are important. Without previous knowledge of what frequencies are appropriate, a useful starting point may be the selection of the lowest frequency based on the resting respiratory rate of the study species. For example, the laboratory mouse has a resting breathing rate (ƒR) ∼80 to 200 breaths per minute. 13 Thus, the lower end of the forced oscillatory signal, for an animal this size, should be ∼1·3 to 3·3 Hz. This relationship holds for larger species, such as humans with a resting ƒR of 15 breaths per min (0·25 Hz); indeed, many studies on low‐frequency respiratory mechanics in humans select similar frequencies. 14 , 15 In saying this, some researchers employ much lower minimum frequencies (e.g., 0·078 Hz) in studies of broncho‐constriction and acute lung injury. 16 , 17 The selection of the highest frequency is perhaps not as vital, although they are usually within the medium frequency range (4–40 Hz) 18 , 19 , which means that resonance and anti‐resonance phenomena 19 , 20 are not examined in low‐frequency studies.
Acknowledgements
This work was supported by the NHMRC grants #458561 and #458562 and Hungarian Scientific Research Fund grants T42971 and K67700.
References
- 1. Hantos Z, Daroczy B, Suki B, Nagy S, Fredberg JJ. Input impedance and peripheral inhomogeneity of dog lungs. J Appl Physiol 1992; 72:168–178. [DOI] [PubMed] [Google Scholar]
- 2. Lutchen KR, Hantos Z, Petak F, Adamicza A, Suki B. Airway inhomogeneities contribute to apparent lung tissue mechanics during constriction. J Appl Physiol 1996; 80:1841–1849. [DOI] [PubMed] [Google Scholar]
- 3. Thamrin C, Janosi TZ, Collins RA, Sly PD, Hantos Z. Sensitivity analysis of respiratory parameter estimates in the constant‐phase model. Ann Biomed Eng 2004; 32:815–822. [DOI] [PubMed] [Google Scholar]
- 4. Gualano R, Hansen M, Vlahos R et al. Cigarette smoke worsens lung inflammation and impairs resolution of influenza infection in mice. Respir Res 2008; 9:53. [DOI] [PMC free article] [PubMed] [Google Scholar]
- 5. Larcombe AN, Foong RE, Bozanich EM et al. Sexual dimorphism in lung function responses to acute Influenza A infection. Influenza Other Resp Viruses 2011; 5:334–342. [DOI] [PMC free article] [PubMed] [Google Scholar]
- 6. Harling‐McNabb LM. Strategies for Improving Protective Immunity Against Influenza. PhD Thesis. University of Melbourne, Dept. of Microbiology and Immunology, 1999. [Google Scholar]
- 7. Bozanich EM, Gualano RC, Zosky GR et al. Acute Influenza A infection induces bronchial hyper‐responsiveness in mice. Respir Physiol Neurobiol 2008; 162:190–196. [DOI] [PubMed] [Google Scholar]
- 8. Sly PD, Collins RA, Thamrin C, Turner DJ, Hantos Z. Volume dependence of airway and tissue impedances in mice. J Appl Physiol 2003; 94:1460–1466. [DOI] [PubMed] [Google Scholar]
- 9. Csendes T. Nonlinear parameter estimation by global optimization—Efficiency and reliability. Acta Cybernetica 1988; 8:361–370. [Google Scholar]
- 10. Collins RA, Gualano RC, Zosky GR et al. Hyperresponsiveness to inhaled but not intravenous methacholine during acute respiratory syncytial virus infection in mice. Respir Res 2005; 6:142. [DOI] [PMC free article] [PubMed] [Google Scholar]
- 11. Petak F, Habre W, Donati YR, Hantos Z, Barazzone‐Argiroffo C. Hyperoxia‐induced changes in mouse lung mechanics: forced oscillations vs. barometric plethysmography. J Appl Physiol 2001; 90:2221–2230. [DOI] [PubMed] [Google Scholar]
- 12. Tomioka S, Bates JHT, Irvin CG. Airway and tissue mechanics in a murine model of asthma: alveolar capsule vs. forced oscillations. J Appl Physiol 2002; 93:263–270. [DOI] [PubMed] [Google Scholar]
- 13. Kleinman LI, Radford EPJR. Ventilation standards for small mammals. J Appl Physiol 1964; 19:360–362. [DOI] [PubMed] [Google Scholar]
- 14. Hantos Z, Daroczy B, Suki B, Galgoczy G, Csendes T. Forced oscillatory impedance of the respiratory system at low frequencies. J Appl Physiol 1986; 60:123–132. [DOI] [PubMed] [Google Scholar]
- 15. Sly PD, Hayden MJ, Petak F, Hantos Z. Measurement of low‐frequency respiratory impedance in infants. Am J Respir Crit Care Med 1996; 154:161–166. [DOI] [PubMed] [Google Scholar]
- 16. Kaczka D, Cao K, Christensen G, Bates J, Simon B. Analysis of regional mechanics in canine lung injury using forced oscillations and 3D image registration. Ann Biomed Eng 2011; 39:1112–1124. [DOI] [PMC free article] [PubMed] [Google Scholar]
- 17. Dellacà RL, Zannin E, Sancini G et al. Changes in the mechanical properties of the respiratory system during the development of interstitial lung edema. Respir Res 2008; 9:51. [DOI] [PMC free article] [PubMed] [Google Scholar]
- 18. Oostveen E. The forced oscillation technique in clinical practice: methodology, recommendations and future developments. Eur Respir J 2003; 22:1026. [DOI] [PubMed] [Google Scholar]
- 19. Thamrin C, Sly PD, Hantos Z. Broadband frequency dependence of respiratory impedance in rats. J Appl Physiol 2005; 99:1364–1371. [DOI] [PubMed] [Google Scholar]
- 20. Jackson AC, Lutchen KR. Physiological basis for resonant frequencies in respiratory system impedances in dogs. J Appl Physiol 1991; 70:1051–1105. [DOI] [PubMed] [Google Scholar]


