Summary
Change detection is a popular task to study visual short-term memory (STM) in humans [1–4]. Much of this work suggests that STM has a fixed capacity of 4 ± 1 items [1–6]. Here we report the first comparison of change detection memory between humans and a species closely related to humans, the rhesus monkey. Monkeys and humans were tested in nearly identical procedures with overlapping display sizes. Although the monkeys’ STM was well fit by a 1-item fixed-capacity memory model, other monkey memory tests with 4-item lists have shown performance impossible to obtain with a 1-item capacity [7]. We suggest that this contradiction can be resolved using a continuous-resource approach more closely tied to the neural basis of memory [8,9]. In this view, items have a noisy memory representation whose noise level depends on display size due to distributed allocation of a continuous resource. In accord with this theory, we show that performance depends on the perceptual distance between items before and after the change, and d′ depends on display size in an approximately power law fashion. Our results open the door to combining the power of psychophysics, computation, and physiology to better understand the neural basis of STM.
Results and Discussion
Understanding memory is one of the great scientific challenges of the 21st century. An essential component of all memory is the ability to store and process information in STM. Human memory research has suggested that STM may have a limited capacity of about 4 ± 1 items [e.g., 5,6]. Change detection has become one of the most popular procedures to study STM. In one change detection paradigm, several objects (e.g., colored squares) are presented as an array (sample display). Following a retention delay, a test display is presented with one object changed. Participants are required to identify the changed object. Change detection is well suited to investigating short-term memory because many memory objects can be presented simultaneously within the time period of STM. Furthermore, change detection has been shown to utilize visual memory, independent of verbal rehearsal, making it a suitable task for testing STM of nonhuman animals with well-developed visual systems [2,4].
This report shows, for the first time, parallel results from memory tests of humans and a nonhuman animal species using the same basic change detection task with overlapping display sizes. Rhesus monkeys are an ideal species to compare to humans because they perform well in other visual memory tasks (e.g., list memory), and because they are the standard medical model for humans. Much of what we learn about STM in rhesus monkeys should be applicable to understanding human STM. A memory model with rhesus monkeys can provide the foundation for memory studies that are difficult to conduct with humans, such as lesions, electrophysiological recordings, pharmacological manipulations, and gene expression studies. Such studies can greatly advance our understanding of memory and would provide a means to evaluate treatments of memory failure when combined with a monkey STM model as proposed later in this report.
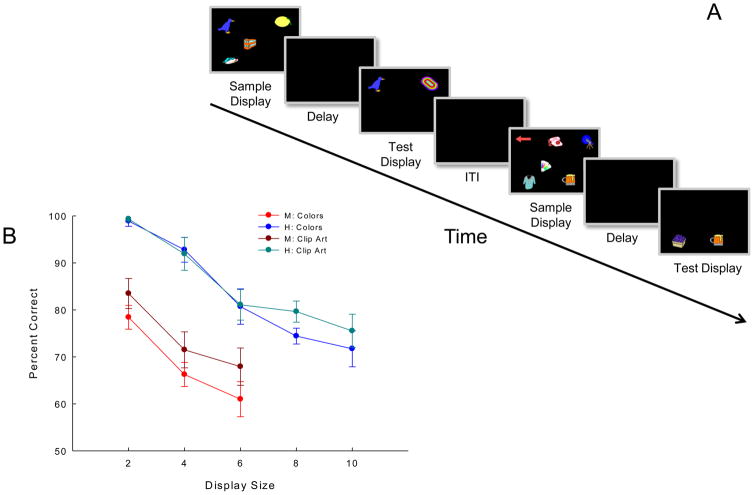
Studies of visual memory in rhesus monkeys performing list memory tasks have found striking qualitative similarities between human and monkey memory [7]. Namely, serial position effects occur in both species and primacy and recency effects depend on the delay interval. Given the similarities demonstrated in the list memory tasks, we hypothesized that qualitative similarities between humans and monkeys might be apparent in change detection tasks as well. To this end, we tested two rhesus monkeys and six human subjects in nearly identical change detection procedures. The basic task design is illustrated in Figure 1A. Two important parameters were manipulated in order to investigate the functional relationships of STM: display size and object type. Display size refers to the number of items presented in the sample display. Monkeys were tested with display sizes of 2, 4, and 6 and humans were tested with display sizes of 2, 4, 6, 8, and 10. Both species were tested with two types of objects, colors and clip art figures (see supplement for details).
Figure 1.
(A) Schematic of change detection task showing two clip-art trials (figure not drawn to scale). Rhesus monkeys viewed sample displays for 5 s, followed by 50-ms delays. Monkeys were reinforced with either cherry koolaid or a 300-mg banana pellet (pseudorandomly) following correct responses. Trials were separated by 15 s (intertrial interval) accompanied by dim green light through a slit between the monitor and chamber. Green-light offset cued the start of the next trial. Humans viewed sample displays for 1 s, followed by 900-ms (colors) or 1000-ms (clip art) delays, with 2-s intertrial intervals. Dim room illumination red (incorrect) and green (correct) lights behind humans provided feedback; light offset cued the start of the next trial. (See supplement for more details and rationale.) (B) Change detection percent-correct performance by monkeys and humans. Error bars represent standard error of the mean.
Figure 1B shows that monkey and human performance was accurate, but decreased as display size increased. Separate repeated-measures ANOVAs of display size × object type revealed a significant effect of display size for both monkeys (M1: F(2,6) = 12.469, p = 0.007; M2: F(2,6) = 20.258, p = 0.002) and the humans (F(4,20) = 24.047, p < 0.001). At the overlapping display sizes of 2, 4, and 6 items, humans outperformed monkeys by an average of 16.5% on clip art trials and by 22.0% on color trials. A repeated-measures ANOVA of display size × object type × species revealed a significant effect of display size (F(2,24) = 39.045, p < 0.001), a significant effect of species (F(1,12) = 60.159, p = 0.001), and a significant interaction of object type and species (F(1,12) = 6.679, p = 0.024).
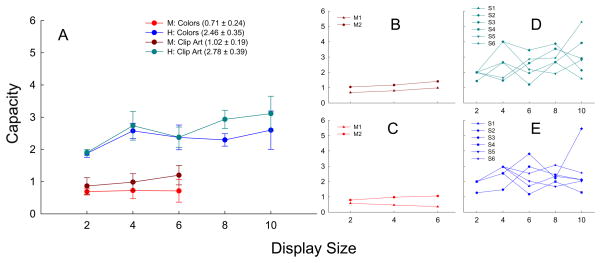
Capacity estimates were obtained for each individual subject using a method described previously [3]. Mean capacity estimates by species, object type, and display size are shown in Figure 2. Humans had a mean capacity estimate of 2.46 ± 0.35 for colors and 2.78 ± 0.39 for clip art. Although somewhat lower than typically found for humans, other researchers using similar procedures (2-item test displays with one item changed) showed virtually identical capacities (2.4–2.5) for colors [3, Exp. 1A]. Somewhat different change detection procedures (e.g., testing the entire sample display with one object changed) have shown capacities of 3.6 for colors [4], similar to the claimed 4 ± 1 human capacity limit [5,6]. Having all (unchanged) sample items presented during the test may provide additional context cues leading to enhanced STM. If so, monkeys too should show enhanced STM with such a procedure. However, a recent article (published during processing of the current article) using this procedure did not find better rhesus monkey performance, although capacity estimates or human comparisons were not made [10].
Figure 2.
Fixed-capacity model. Capacity estimates were calculated for each subject at each display size, and each object type according to the formula used by Eng et al [3]: Accuracy = [(N−C)/N]2 × 50% + {1−[(N−C)/N]2} × 100%, where N is the display size and C is the capacity estimate. (A) Mean capacity estimates for monkeys and humans. Mean capacity values are shown in the legend for species and object type across display sizes (excluding size 2 for humans as is customary for sizes less than capacity). (B) Individual monkey capacity estimates for clip art. (C) Individual monkey capacity estimates for colors. (D) Individual human capacity estimates for clip art. (E) Individual human capacity estimates for colors. Error bars represent standard error of the mean.
According to a fixed-capacity model of STM, capacity estimates at display sizes that exceed capacity should be constant for individual participants. But there is a large amount of within and between-subject variability (2d & 2e), for instance, in the clip art condition, S6’s capacity estimates range from 1.65 (4 item display) to 5.29 (10 item display). Such a discrepancy in capacity within an individual subject is not consistent with a fixed capacity. Even more surprising are the strikingly low values (≤1) obtained for rhesus monkey STM capacity. Monkey capacity for clip art was found to be 1.02 ± 0.19 and capacity for colors was found to be 0.71 ± 0.24. While it may not be surprising to discover that STM capacity in monkeys is less than human capacity, a limit of a single object is unusually low. Tests of list memory show that rhesus monkeys can remember at least four visual or auditory stimuli [7]. Comparisons of visual list memory to change detection memory are somewhat indirect because list memory performance changes for the four serial positions as retention delays increase from 0 to 30 s or more. Nevertheless, if visual STM were fixed at 1 item, then good memory for the first list items would not develop after long delays (e.g., 10 to 30 s), and near-ceiling performance for the last list items would not occur at short delays (e.g. 0 to 2 s.
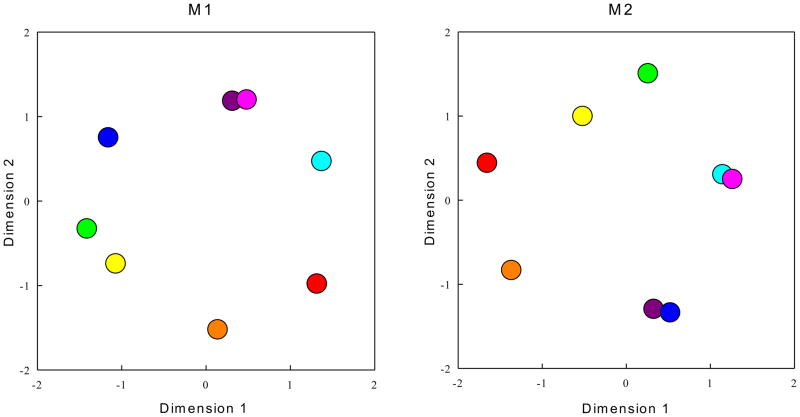
A second issue with a fixed-capacity model is shown by a multidimensional scaling analysis of the monkey color data in Figure 3. Monkeys frequently made mistakes when colors were similar, for instance, M1 was at chance when magenta changed to purple (52% correct), whereas M2’s performance was low when purple changed to blue (57% correct). By contrast, M1 performed perfectly (100% correct) when red changed to green, and M2 was perfectly accurate when green changed to orange. Indeed, substantial variance is accounted for by color-memory confusability; r2 values were 0.61 for M1 and 0.56 for M2. The finding of color confusability is not consistent with a high-resolution fixed-capacity store, because fixed-capacity models claim that an item is either perfectly stored (and not confusable) or not stored at all.
Figure 3.
Multidimensional scaling of the monkey change detection for sample colors changing to test colors. Asymmetric, metric multidimensional scaling was performed on the percent correct data from 10 sessions with a 2-item display size and all the possible combinations of changed objects (e.g. red in the sample display changes to blue in the test display). Percent-correct accuracy maps onto distance in the multidimensional space, so that the greater distance reflects greater accuracy. These data were collected prior to tests with 2, 4, and 6 item displays (see supplement for details). M1: r2 = 0.61 Stress = 0.303. M2: r2 = 0.56, Stress = 0.332.
A third issue of a fixed-capacity account is that human performance should have been perfect for display size 2. Intriguingly, 2 subjects made mistakes in the 2-item display condition. S3 was only 93.3% accurate (capacity of 1.27) with colors, and S4 was only 96% accurate (capacity of 1.43) with clip art. Indeed, perfect performance for display sizes less than capacity limit is a hallmark of fixed-capacity accounts. Adjustments have been made for less-than-perfect performance at display sizes less than capacity by a factor for inattention [11]. But representing attention as either perfect attention or complete inattention is conceptually implausible.
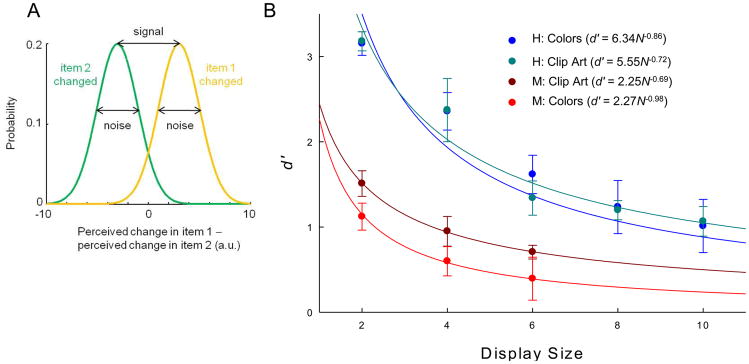
A detection theory account of STM, known as the continuous-resource model (Figure 4A), provides an alternative framework with which to interpret our results from humans and monkeys [8,9]. This model proposes that STM does not have a fixed, discrete capacity, but rather consists of a continuous resource distributed among many stimuli. Working memory limitations arise from noise in the internal representation of each item. As display size increases, an item will receive less resource on average, and consequently has a noisier internal representation [10,11]. Determining which object has changed in a change detection task becomes more difficult as display size increases not because the capacity has been exceeded, but rather because it becomes a problem of extracting a signal (memory for the object) from a noisy representation. Differences between humans and monkeys can be explained by differences in level of overall attention to the task, as attention has the effect of increasing the signal-to-noise ratio. In the continuous-resource model, attention varying over a wide range is accounted for, unlike the fixed-capacity model.
Figure 4.
Continuous-resource model of change discrimination. (A) Each item is represented in a noisy manner, giving rise to perceived changes of the two test-display objects. Decisions are made by comparing the difference between those perceived changes to zero. Shown are the probability distributions of this difference when the change occurred in item 1 (yellow) or item 2 (green). The distance between the means is the magnitude of the signal; it is affected by the perceptual distance between the items across the change. The model asserts that the signal-to-noise ratio decreases in power law fashion with display size. (B) Power law fits of mean d′ values of monkeys and humans with colors and clip art. Error bars represent standard error of the mean. d′ values were calculated using a method described by Macmillan & Creelman for 2-alternative forced-choice experiments [13]. Trials were divided into hits (H), misses, false alarms (F) and correct rejections based on object position. d′ was then calculated using the following formula: d′ = 1/√2 [z(H) − z(F)]; d′ values were calculated for individual subjects and then averaged for display in this figure. Power law fits were made to the d′ results of individual subjects and the mean of those functions are displayed on the graph.
As a measure of sensitivity, the continuous-resource model utilizes d′ values [12,13]. The model predicts that d′ will decrease as display size increases according to a power law function [8,9]. Figure 4B shows the d′ values for the results shown in Figure 1B. As with capacity estimates, d′ was found to be higher for human subjects than for monkeys. Monkey d′ values were well fit by power law functions: r2 was 0.98 for colors and 0.99 for clip art. Human d′ values from both the color and clip art condition were also well fit by power law functions; r2 was 0.75 for colors and 0.70 for clip art (see supplement for details). Across conditions, the average estimated value of the power in the human power law was 0.79 ± 0.07, close to the one that was reported recently, 0.74 ± 0.06 [9].
Further support for a continuous-resource model account comes from the previously mentioned multidimensional scaling of monkey color results (Figure 3) showing that some colors are more confusable than others. In the continuous-resource model, the ability to detect a change is determined by the ratio of the perceptual distance between items to the noise. Confusion between the stimuli due to noise, which is the core of the continuous-resource model, cannot be reinterpreted within the framework of the fixed-capacity model.
The continuous-resource account of monkey and human STM memory fits into 50 years of development of signal detection theory. Signal detection theory is the dominant framework to account for how humans and animals perceive stimuli in noise [12,13]. Functional relationships showing how performance (d′) changes with memory load (sample display size) according to the continuous-resource model go beyond functional relationships of percent correct changes with sample display size (e.g., Figure 1B). The latter is a descriptive account without accounting for how memory varies with display size or how the brain might produce these memory results. The continuous-resource account postulates that d′ changes inversely as a power of the display size. This relationship is shown to be a good fit for the data in Figure 4B. The fixed-capacity model, on the other hand, predicts that capacity will be the same at all display sizes, except for display sizes less than the capacity limit where performance should be perfect (100% correct). Performance is not always perfect at display sizes less than capacity and is seldom found to remain invariant at display sizes greater than capacity [3,4]. Indeed, neither of those requirements was met by humans or monkeys in this study. Furthermore, capacity estimates of 1 item obtained in this study are inconsistent with earlier reports demonstrating near-ceiling performance in visual list memory by rhesus monkeys at short delays [7]. A potential explanation for the performance differences between list memory and change detection tasks by rhesus monkeys relates to noise at the time of encoding. In list memory tasks, stimuli are presented sequentially, one at a time, in one location. However, in change detection, all stimuli are presented simultaneously, in unique locations. Simultaneous presentation requires the monkey to efficiently divide his attention across space, among all objects in the sample display. This could result in noisier representations in STM, thereby explaining the lower performance found in change detection tasks relative to list memory tasks. This explanation fits within the framework of the continuous-resource model given its prediction that increases in noise lead to decreases in performance.
Perhaps most discriminating for these STM models is how memory might operate at the neural level. The fixed-capacity model says that each item is stored and remembered perfectly—or not at all. When all the memory slots are filled, then nothing is remembered about any additional item for that STM bout. This is problematic from a neurobiological point of view. The storage, maintenance, and retrieval of information (i.e., memory) are likely probabilistic, similar to evidence from neurons in the human medial temporal lobe signaling probability (i.e., confidence) of correctly detecting an object change [14] or neurons in the monkey superior colliculus signaling probability (i.e., confidence) of an object selection [15]. In a broader context, the nervous system is noisy [16], and its computations are probabilistic [9, 17–19]. The continuous-resource model captures the noisy nature of the nervous system—and hence provides a plausible account of how the STM system might work, in general.
We have shown for the first time that a nonhuman animal, the rhesus monkey, can perform a change detection task with the same items, same procedures, and the same display sizes as humans. We show that the functional relationships for monkeys and humans are qualitatively similar. We also show that there are quantitative differences between monkeys and humans. These quantitative differences may be related to better developed human brain areas, such as the prefrontal cortex that are known to be instrumental in controlling memory processing and attention [20]. Anatomical species differences and similarities should help discriminate functional brain areas from those that are not instrumental in mediating a particular type of memory. A memory model with rhesus monkeys can provide the foundation for biological studies of memory that are difficult to conduct with humans. Such studies, in conjunction with a plausible model framework like the continuous-resource model, offer potential for rapidly advancing our understanding of memory and evaluating treatments of memory problems.
Supplementary Material
Highlights
Rhesus monkeys and humans perform change detection with the same procedures.
Monkey memory is qualitatively similar to humans but quantitatively different.
The continuous-resource model is a good theoretical framework for primate memory.
Acknowledgments
Research and preparation of this article was supported by NIH grant MH-072616 to A.A.W. and by grant 1R01EY020958-01 from the National Eye Institute to W.J.M. The content of the manuscript is solely the responsibility of the authors and does not necessarily represent the official views of the National Eye Institute, National Institute of Mental Health, or the National Institute of Health. The authors would like to thank Jacquelyne J. Rivera for her assistance with training and testing of the rhesus monkeys.
Footnotes
Publisher's Disclaimer: This is a PDF file of an unedited manuscript that has been accepted for publication. As a service to our customers we are providing this early version of the manuscript. The manuscript will undergo copyediting, typesetting, and review of the resulting proof before it is published in its final citable form. Please note that during the production process errors may be discovered which could affect the content, and all legal disclaimers that apply to the journal pertain.
References
- 1.Pashler H. Familiarity and visual change detection. Perception and Psychophysics. 1988;44:369–378. doi: 10.3758/bf03210419. [DOI] [PubMed] [Google Scholar]
- 2.Luck SJ, Vogel EK. The capacity of visual working memory for features and conjunctions. Nature. 1997;390:279–281. doi: 10.1038/36846. [DOI] [PubMed] [Google Scholar]
- 3.Eng HY, Chen D, Jiang Y. Visual working memory for simple and complex visual stimuli. Psychonomic Bulletin & Review. 2005;12:1127–1133. doi: 10.3758/bf03206454. [DOI] [PubMed] [Google Scholar]
- 4.Alvarez GA, Cavanagh P. The Capacity of Visual Short-Term Memory is Set Both by Visual Information Load and by Number of Objects. Psychological Science. 2004;15:106–111. doi: 10.1111/j.0963-7214.2004.01502006.x. [DOI] [PubMed] [Google Scholar]
- 5.Cowan N. The magical number 4 in short-term memory: a reconsideration of mental storage capacity. Behavioral and Brain Sciences. 2001;24:87–114. doi: 10.1017/s0140525x01003922. [DOI] [PubMed] [Google Scholar]
- 6.Cowan N. Working Memory Capacity. New York: Psychology Press; 2005. [Google Scholar]
- 7.Wright AA. An experimental analysis of memory processing. Journal of the Experimental Analysis of Behavior. 2007;88:405–433. doi: 10.1901/jeab.2007.88-405. [DOI] [PMC free article] [PubMed] [Google Scholar]
- 8.Wilken P, Ma WJ. A detection theory account of change detection. Journal of Vision. 2004;4:1120–1135. doi: 10.1167/4.12.11. [DOI] [PubMed] [Google Scholar]
- 9.Bays PM, Husain M. Dynamic shifts of limited working memory resources in human vision. Science. 2008;321:851–854. doi: 10.1126/science.1158023. [DOI] [PMC free article] [PubMed] [Google Scholar]
- 10.Heyselaar E, Johnston K, Pare M. A change detection approach to study visual working memory of the macaque monkey. Journal of Vision. 2011;11 doi: 10.1167/11.3.11. [DOI] [PubMed] [Google Scholar]
- 11.Rouder JN, Morey RD, Cowan N, Zwilling CE, Morey CC, Pratte MS. An assessment of fixed-capacity models of visual working memory. Proceedings of the National Academy of Sciences. 2008;105:5975–5979. doi: 10.1073/pnas.0711295105. [DOI] [PMC free article] [PubMed] [Google Scholar]
- 12.Green DM, Swets JA. Signal detection theory and psychophysics. New York: Wiley; 1966. [Google Scholar]
- 13.Macmillan NA, Creelman CD. Detection Theory: A User’s Guide. 2. Mahwah, N.J: Lawrence Erlbaum Associates; 2005. [Google Scholar]
- 14.Reddy L, Kanwisher N. Coding of visual objects in the ventral stream. Current Opinions in Neurobiology. 2006;16:408–414. doi: 10.1016/j.conb.2006.06.004. [DOI] [PubMed] [Google Scholar]
- 15.Kim B, Basso MA. Saccade target selection in the superior colliculus: a signal detection theory approach. Journal of Neuroscience. 2008;28:2991–3007. doi: 10.1523/JNEUROSCI.5424-07.2008. [DOI] [PMC free article] [PubMed] [Google Scholar]
- 16.Faisal AA, Selen LPJ, Wolpert DM. Noise in the nervous system. Nature Reviews Neuroscience. 2008;9:292–303. doi: 10.1038/nrn2258. [DOI] [PMC free article] [PubMed] [Google Scholar]
- 17.Beck JM, Ma WJ, Kiani R, Hanks TD, Churchland AK, Roitman JD, et al. Bayesian decision-making with probabilistic population codes. Neuron. 2008;60:1142–1145. doi: 10.1016/j.neuron.2008.09.021. [DOI] [PMC free article] [PubMed] [Google Scholar]
- 18.Ma WJ, Beck JM, Latham PE, Pouget A. Bayesian inference with probabilistic population codes. Nature Neuroscience. 2006;9:1432–1438. doi: 10.1038/nn1790. [DOI] [PubMed] [Google Scholar]
- 19.Ma WJ, Beck JM, Pouget A. Spiking networks for Bayesian inference and choice. Current Opinions in Neurobiology. 2008;18:217–222. doi: 10.1016/j.conb.2008.07.004. [DOI] [PubMed] [Google Scholar]
- 20.Ranganath C. Binding Items and Contexts: The Cognitive Neuroscience of Episodic Memory. Current Directions in Psychological Science. 2010;19:131–137. [Google Scholar]
Associated Data
This section collects any data citations, data availability statements, or supplementary materials included in this article.


