Summary
Dendritic spines are the major loci of synaptic plasticity and are considered as possible structural correlates of memory. Nonetheless, systematic manipulation of specific subsets of spines in the cortex has been unattainable, and thus, the link between spines and memory has been correlational. We developed a novel synaptic optoprobe, AS-PaRac1 (activated synapse targeting photoactivatable Rac1), which can label recently potentiated spines specifically, and induce the selective shrinkage of AS-PaRac1-containing spines. In vivo imaging of AS-PaRac1 revealed that a motor learning induced substantial synaptic remodelling in a small subset of neurons. The acquired motor learning was disrupted by the optical shrinkage of the potentiated spines, whereas it was not affected by the identical manipulation of spines evoked by a distinct motor task in the same cortical region. Taken together, our results demonstrate that a newly acquired motor skill depends on the formation of a task-specific dense synaptic ensemble.
Optogenetics is a powerful tool for controlling neuronal action potentials1,2, and has been used to demonstrate the crucial role of cell assemblies in representing memory traces3. However, due to the limitations of spatial resolution of currently available probes, manipulation of individual dendritic spines, the major sites of excitatory synapses4–6, has been unfeasible, hindering the comprehensive understanding of synaptic reorganisation during learning. Thus, for the spine specific light controlling, we took advantage of the structural properties of spines: the tight correlation between spine volume and function4–7. Because the prolonged activation of the small GTPase Rac1 induces spine shrinkage8–11, we used a photoactivatable form of Rac1 (PaRac1)12 to induce spine shrinkage, which allowed us to control synaptic transmission with light. Moreover, since it has been suggested for a long time that the memory trace is allocated to specific neurons and spines of neurocircuits13,14, we here targeted PaRac1 to the activated synapses (activated synapse targeting PaRac1, AS-PaRac1) to establish a novel method, termed ‘synaptic optogenetics’, in order to visualize and manipulate the memory trace.
AS-PaRac1 labels the potentiated spines
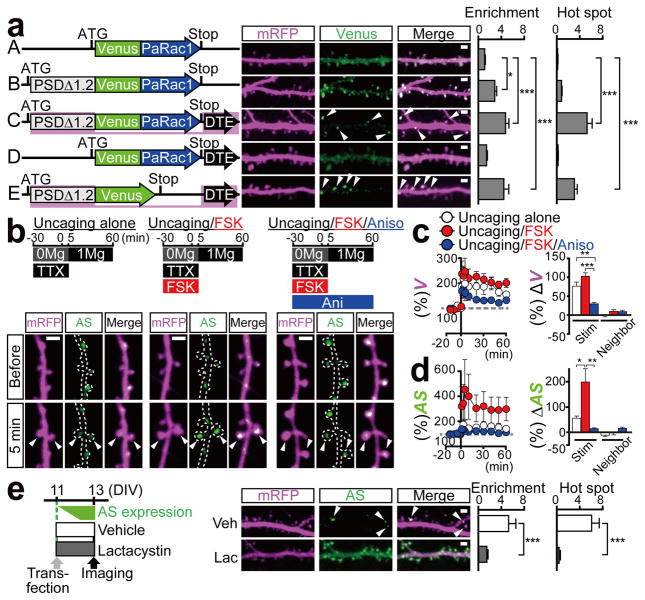
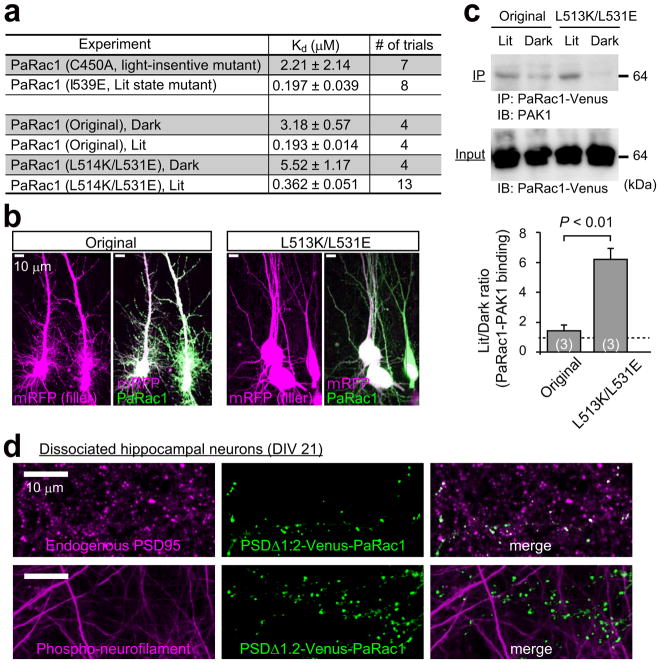
We first re-engineered the original PaRac1 construct12 to optimise its properties for the synaptic manipulation. Introduction of L514K and L531E mutations into the original construct markedly reduced the undesirable Rac1 background activity in the dark, as shown by isothermal titration calorimetry (ITC), the neuronal morphology, and co-immunoprecipitation ( Extended Data Fig. 1a–c). Next, PaRac1 was fused with a deletion mutant of PSD-95 (PSDΔ1.2)15, which is known to concentrate at the postsynaptic site, but cannot bind with the major PDZ binding proteins, thus minimizing the undesirable effects of PSD-95 overexpression. An enrichment index, quantitative ratio of synaptic localisation compared to that of the dendritic shaft (see Methods), supported the effective accumulation of PSD-PaRac1 to the synapse, especially at the tip of the spine (Fig. 1a, construct B), where it was highly co-localised with the endogenous PSD-95, but not with an axonal marker (Extended Data Fig. 1d). Finally, for neuronal input specificity, we exploited the dendritic targeting element (DTE) of Arc mRNA16, which is selectively targeted and translated in activated dendritic segment in response to synaptic activation in an NMDA receptor-dependent manner17–19. Interestingly, PSD-PaRac1-DTE sparsely labelled spines (Fig. 1a, construct C, arrowheads). Quantification using a hot spot index (see Methods), which indicates how unevenly PaRac1 variants were distributed, suggested that both PSDΔ1.2 and DTE was necessary for this characteristic distribution (Fig. 1a, constructs C and E). Therefore, the combination of PSDΔ1.2 and DTE was termed as ‘AS (activated synapse targeting) cassette’, and the PaRac1 sequence flanked with the AS cassette was named AS-PaRac1 (Fig. 1a, constructs C).
Figure 1. Potentiation-dependent accumulation of AS-PaRac1 to the dendritic spines in hippocampal slice cultures.
a, Mapping for essential domains for the discrete distribution of the probe (arrowheads). b, Representative images of single spine potentiations by glutamate uncaging (arrowheads) in the presence or absence of forskolin (FSK) and anisomycin. c, d, Time courses of spine head volume (c) and AS-PaRac1 accumulation (d). The mean change 60 min after uncaging in the stimulated or neighbouring spines. e, The effect of lactacystin on the discrete accumulation of AS-PaRac1 (arrowheads). Scale bar, 2 μm. Detailed information of statistical methods/results are described in the Extended Data Table.
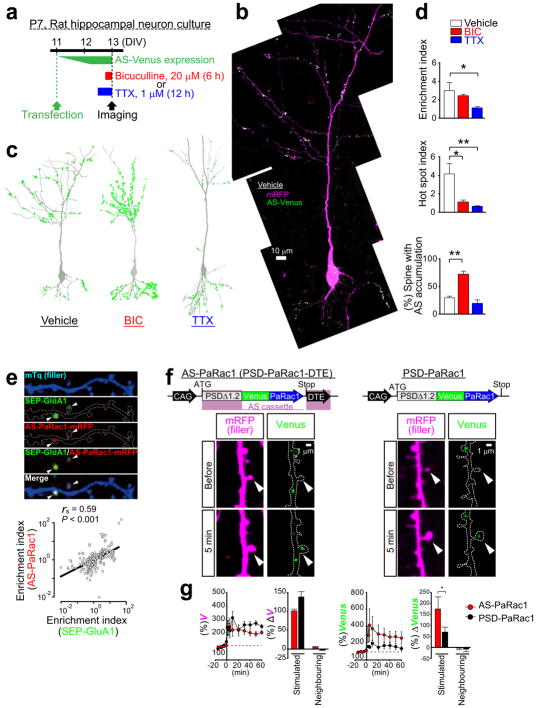
Next, we tried to unravel what this new synaptic probe labelled. Bicuculline, which increases neuronal excitation, robustly enhanced the number of AS-PaRac1-containing spines, and reduction of the hot spot index revealed that the distribution of AS-PaRac1 became relatively uniform upon bicuculline treatment. In contrast, the blockage of action potential by tetrodotoxin (TTX) decreased the accumulation of the probe, resulting in the reduction in the spine enrichment index of the probe (Extended Data Fig. 2a–d). Because these findings suggested that synaptic activation regulates the localisation of AS-PaRac1, we hypothesized that AS-Rac1 accumulates in recently potentiated spines. Indeed, when AS-PaRac1 was co-transfected with SEP-GluA1, the synaptic incorporation marker for AMPA receptor subunits GluR1 (ref 20,21), the fluorescence signals of these two probes inside each spine were significantly correlated (Extended Data Fig. 2e, arrowheads). Furthermore, the protein synthesis-dependent potentiation during the single spine LTP protocol, which was elicited by glutamate uncaging and the adenylyl cyclase activator forskolin (FSK)22–24, induced the accumulation of AS-PaRac1 in the stimulated spines, while the protein synthesis-independent plasticity (glutamate uncaging alone) did not. Consistently, protein synthesis inhibitor anisomycin abolished the FSK-induced AS-PaRac1 accumulation (Fig. 1b–d). No increase was observed in AS-PaRac1 fluorescence in the neighbouring spines, indicating that AS-PaRac1 accumulation was restricted to the stimulated spine (Fig. 1d). The DTE sequence was necessary for the activity-dependent AS-PaRac1 accumulation (Extended Data Fig. 2f, g), supporting that locally translated AS-PaRac1, unlike somatically translated AS-PaRac1, was preferentially recruited to enlarged spines. PaRac1 did not exhibit uneven distribution unless the construct contained the PSD-95 domain (Fig. 1a, construct D). Because PSD-95 is rapidly degraded by proteasomes25, we examined the effect of the proteasome inhibitor lactacystin and found that it completely disrupted the unique distribution of the probe (Fig. 1e). Taken together, we concluded that AS-PaRac1 is a probe that specifically labels the enlarged and newly generated spines (see Extended Data Fig. 3 for detailed cellular mechanisms), which are referred to as the ‘structurally potentiated spine’, and the potentiation labelled by AS-PaRac1 are described as ‘potentiated spine’ hereafter.
Spine labelling by AS-PaRac1 in vivo
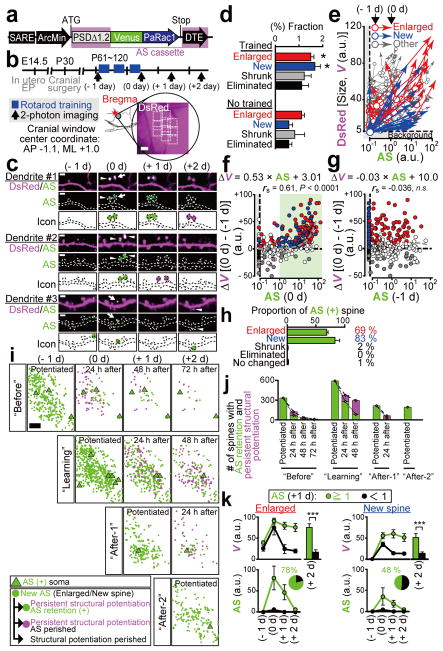
To characterize this probe in vivo, we utilized the rotarod training as the model of motor learning. Because the motor learning is impaired in Arc knockout mice26, we assumed that the induction of AS-PaRac1 by the Arc promoter27 would enhance the specific labelling during learning-induced potentiation. Arc::AS-PaRac1 was delivered to the cortical layer II/III of the primary motor cortex (M1), where a robust reorganisation of neuronal circuits is induced upon the motor learning28–31. Cranial window surgery for two-photon imaging was performed based on the stereotaxic coordinates of the previous functional mapping for the hind limb area32. Spine volume and AS-PaRac1 fluorescence was compared quantitatively before and after training (Fig. 2a–e). Consistent with previous findings33,34, even in the training-free period, a substantial number of spines ‘spontaneously’ underwent structural potentiation (formation or enlargement of spines; see the definition in Extended Data Fig. 4a), but the trained mice exhibited significantly more structural potentiation compared with the non-trained mice (Fig. 2d). Notably, synaptic fluorescence of AS-PaRac1 just after training (0 day) strongly correlated with the change in spine size upon training (Fig. 2f). It is unlikely that the accumulation of AS-PaRac1 caused the potentiation or labelled the spines primed for potentiation such as for the ‘tagged synapse’35,36, because the initial quantity of AS-PaRac1 before learning (−1 day) did not correlate with the change in spine size after learning (Fig. 2g). Analysis of AS-PaRac1 puncta in the dendritic shaft suggested that the majority of AS-PaRac1 signal was located in the dendritic spines, and the labelling of shaft synapses was negligible (Extended Data Fig. 5). When we set the threshold of AS-PaRac1 at 1 a.u. (Fig. 2f, green shaded area, 0 day), AS-PaRac1 detected spine formation and enlargement with sensitivities of 83 ± 7.9% and 69 ± 3.0% (mean ± standard error of the mean), respectively (Fig. 2h), whereas labelling in other spine types was 2.3 ± 0.12%. Since Arc::AS-PaRac1 was induced only in the AS-PaRac1-positive neuron, the labelling properties in the AS-PaRac1-positive neuron was also calculated, which turned out that the sensitivities for formation and enlargement were 94 ± 2.7% and 95 ± 4.8%, respectively, while the false labelling in other spine types was 12.9 ± 4.2 % (306 spines, 6 AS-PaRac1-positive neurons in 3 mice). Therefore, AS-PaRac1 is a reliable marker of the potentiated spines in vivo.
Figure 2. Spatiotemporal dynamics of AS-PaRac1 labelling in vivo during the rotarod task.
a, Schematic of the Arc promoter27-driven AS-PaRac1. b, Experimental design. c, Images of spine formation (arrows) and spine enlargement (arrowheads). Green circles, AS-PaRac1; magenta circles, spines that initially acquired AP-PaRac1, but lost it afterward, but the structural change were persistent. d, Fraction of structural change of spines. e–g, Quantification of spine size and AS-PaRac1 (e). Relationship between AS-PaRac1 and ΔV after (0 day, f) and before (−1 day, g) learning. h, Percentage of AS-PaRac1-containing spines (AS-PaRac1 ≥ 1 [a.u.], green shaded area in f). i, Mapping of AS-PaRac1. j, Retention of AS-PaRac1 (green) or structural potentiation (magenta). k, Trajectory of spine size and AS-PaRac1 intensities of the structurally potentiated spines. Scale bar, 2 μm for c; 200 μm for b and i..
Next, we performed wide-view mapping of task-evoked potentiation using this probe (Fig. 2i, learning period), and we found that the task-evoked potentiation was elicited in 2.3 ± 0.13% of spines and 16.4 ± 2.8% of neurons in the imaged area. We tracked an almost whole image of neurons (Extended Data Fig. 4b) and confirmed that when a spine was labelled by AS-PaRac1, its parental soma also expressed AS-PaRac1 (6 AS-PaRac1-positive somata). Consistently, we could not find AS-PaRac1-positive spines in AS-PaRac1-negative soma (46 negative somata). Thus, the counting of AS-PaRac1 puncta per AS-PaRac1-positive neurons could be approximated, which suggested that 14.7 ± 2.01% of spines contained AS-PaRac1 in the AS-PaRac1-positive neurons, implying that upon motor learning, substantial remodelling of spines (14.7%) was evoked in a small neuronal population (16.4 %) in the layer II/III (Extended Data Fig. 4d for detailed calculation). Similarly, the substantial remodelling was also observed in a small population of layer V neurons (Extended Data Fig. 4d).
To characterize the synaptic retention of AS-PaRac1 for photoactivation (PA) experiments in vivo, the individual spines that acquired AS-PaRac1 were tracked, and were separately iconized from the day of AS-PaRac1 appearance (Fig. 2c and i). We noticed that persistence of synaptic AS-PaRac1 and the structural potentiation markedly varied among spines: some were preserved beyond 1 day after training (Fig. 2c, dendrite #1), while others disappeared (Fig. 2c, dendrites #2 and #3). Importantly, the structural potentiation and AS-PaRac1 labelling triggered during the ‘Learning’ period were more likely to be preserved than those triggered during the training-free period (Fig. 2j, ‘Before’ and ‘After-1’). Consistently, longitudinal imaging of the structurally potentiated spines revealed that the majority of those with the retention of AS-PaRac1 for 24 h maintained structural potentiation for at least 48 h (Fig. 2k, green trace), while the structurally potentiated spines lacking AS-PaRac1 retention returned to the pre-potentiated state (Fig. 2k, black trace). Such AS-PaRac1 retention might be maintained by reverberation of learning-activated neuronal circuits, because AS-PaRac1 was only expressed in Arc-expressing neurons, in which the persistent activation helps to maintain plastic changes in the neocortex26,37.
Selective spine shrinkage by AS-PaRac1
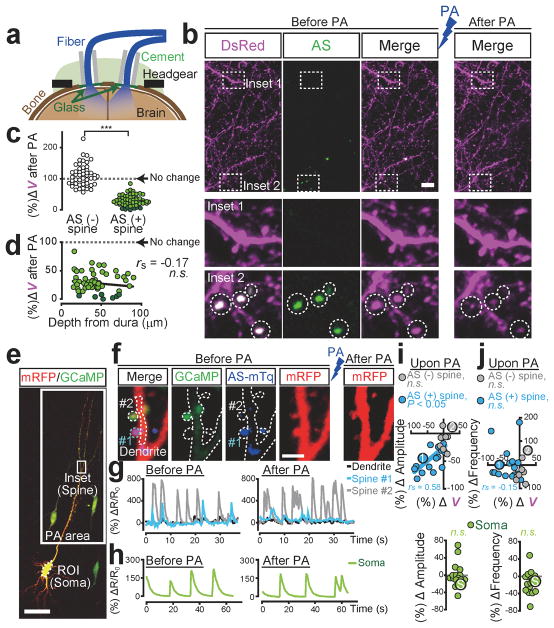
Consistent with the previous findings that prolonged Rac1 activation induces spine shrinkage8–11, we found that low-frequency PA elicited spine shrinkage (Extended Data Fig. 6). Intriguingly, the spine shrinkage was significantly more robust when the AS-PaRac1 construct was driven by the Arc promoter compared with the constitutive promoter CAG. As Arc expression is increased by persistent neuronal activity26, which induces the chronic activation of endogenous Rac1, possibly contributing to the robust spine shrinkage by Arc::AS-PaRac1. PA-induced spine shrinkage was Rac1-dependent, because deletion of Rac1 from AS-PaRac1, however keeping other domains intact within AS-PaRac1 (Arc::PSDΔ1.2-LOV-DTE), completely disrupted the shrinkage effect (Extended Data Fig. 6). To achieve spine shrinkage in a large cortical area in vivo, bilateral optical fibres were placed onto the cranial window (Fig. 3a; Extended Data Fig. 7). Low-frequency pulsed PA triggered shrinkage specifically in the AS-PaRac1-containing spines (Fig. 3b, c). The effect of PA was comparable at least within 100 μm from the dura, suggesting that spines in layer I, at least, were affected by PA (Fig. 3d). PA-induced spine shrinkage was accompanied with functional depotentiation, which was demonstrated by the excitatory postsynaptic calcium transients: extent of spine shrinkage correlated with the decrease in the amplitude, but not with the decrease of frequency (Fig. 3f–j). Spine shrinkage and the subsequent functional changes was spine-specific, but not branch- or cell-wide, because spine shrinkage was not triggered in neighbouring AS-PaRac1-negative spines, and the calcium transient was not affected either in the neighbouring spines or in the soma (Fig. 3f–j; Extended Data Figs. 6 and 7b).
Figure 3. Selective shrinkage of AS-PaRac1-containing spines upon photoactivation (PA).
a, Illustration of PA. b, Images of the hind limb regions of cortices. c, Spine size following PA. Dark green circles are eliminated spines. d, The effect of the cortical depth on PA-induced spine shrinkage. e–j, Neurons were co-transfected with GCaMP6s, AS-PaRac1-mTurquoise, and mRFP. Changes in the GCaMP/mRFP ratio (ΔR) in synapse (g) and soma (h) were traced. i,j, Relationships between ΔV and ΔAmplitude (i), or ΔFrequency (j) upon PA. Circles 1, 2, and S correspond to spine #1, #2, and the soma in g and h. Scale bar, 5 μm for b; 50 μm for e, 2 μm for f.
Optical erasure of acquired skills
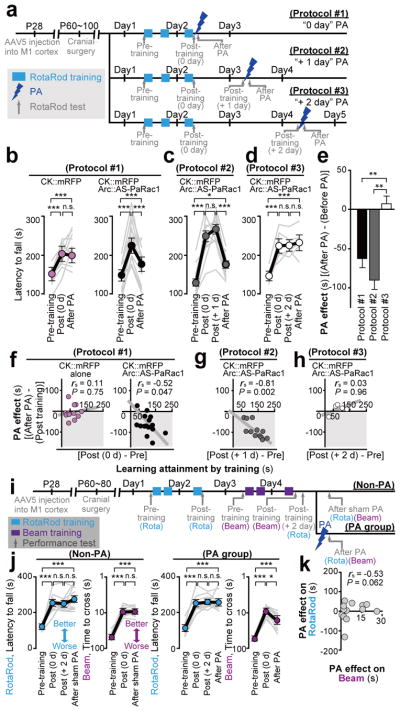
To demonstrate the effect of spine shrinkage for learning, mice were bilaterally injected with the adeno-associated virus (AAV) 5 that encompassed layers I to V (Extended Data Fig. 7f). Mice were divided into two groups: animals in the first group were transfected with mRFP alone as a control, and the second group was transfected with AS-PaRac1 and mRFP. Both groups exhibited significantly better motor performance after training, but only the performance of the AS-PaRac1 group was disturbed by PA (Protocol #1, Fig. 4a,b), and the extent of learning disruption induced by PA (PA effect) negatively correlated with the extent of training-evoked improvement (learning attainment) (Fig. 4f). In contrast, there was neither disruption of acquired learning nor a correlation between the effects of the training and PA in the control group. Since PA did not affect the running speed of the identical cohort used in the Fig. 4b, it is unlikely that PA disturbed the general motor performance (Extended Data Fig. 8).
Figure 4. Erasure of acquired learning by the PA of spines labelled with AS-PaRac1.
a, Experimental design (see Extended Data Figure 9). b,c,d, Mice were allocated to protocols #1 (b), #2 (c), or #3 (d). An average of three trials of each mouse was used as the task performance (grey line). e, The critical period of PA to erase acquired skills. f–h, Relationship between the effect of PA and learning attainments. i, Experimental design. j, Performance trajectory of each skill. k, No correlation between PA effect on acquired rotarod performance and that of beam task..
PA disrupted the acquired learning even 1 day after learning (Protocol #2; Fig. 4c, g), when the majority of learning-evoked spines contained AS-PaRac1 (Fig. 2k). In contrast, PA treatment 2 days after learning (Protocol #3), when both the number of AS-PaRac1-containing spines and intensity of AS-PaRac1 labelling were markedly decreased (Fig. 2k; Extended Data Fig. 4), it failed to disrupt acquired learning (Fig. 4d, h). Due to daily spontaneous potentiation, a comparable number of spines contained AS-PaRac1 both in protocol #2 and #3 (Extended Data Fig. 4c). Nonetheless, only protocol #2 disrupted the acquired skill, suggesting that the learning-evoked spine potentiation visualized by AS-PaRac1 (at +1 day), but not spontaneous potentiation (at +2 day), accounted for the cortical memory traces.
To demonstrate the task-specific role of synaptic ensembles, mice injected with AS-PaRac1-expressing AAV into the bilateral M1 were subjected to a dual task protocol. Mice sequentially learned two distinct hind limb tasks: the rotarod and the beam tasks in the first and the latter 2 days, respectively (Fig. 4i). We performed the PA on day 4, because the majority of the rotarod-evoked AS-PaRac1 puncta diminished by this time point (Fig. 2k). We confirmed that these two tasks evoked a comparable number of spine potentiation (Extended Data Fig. 7c). While learning performance in the beam task was not disrupted by the sham PA treatment (fibre was inserted, but no illumination was performed), PA disrupted the acquired performance in the beam task, without affecting the rotarod performance (Fig. 4j). We found no correlation between the effect of PA in the rotarod and beam task, which implies that synaptic ensembles recruited by each task did not overlap (Fig. 4k).
Task-specific synaptic ensemble
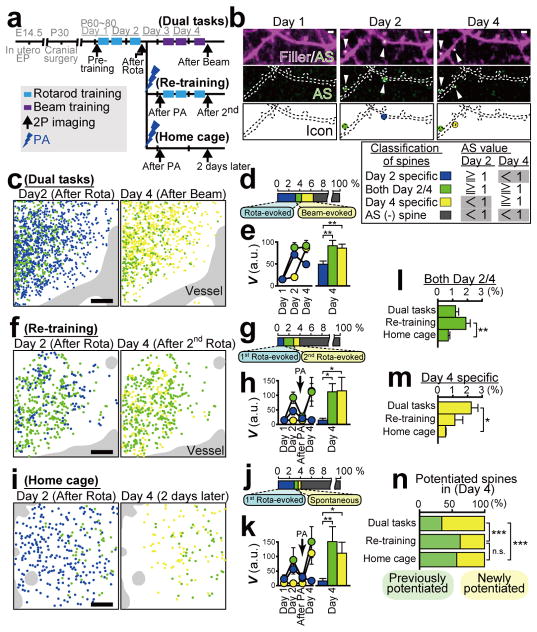
To visualize the synaptic ensembles formed during the dual task learning, mice were sparsely labelled with AS-PaRac1, and they were also subjected to the dual task protocol described before (Fig. 5a, dual task). AS-PaRac1 puncta were classified based on the time of emergence (Fig. 5b), being iconized for the rotarod task potentiation (day 2 specific, blue), the beam task potentiation (day 4 specific, yellow), and the continuous potentiation for both periods (both day 2 and 4, green). Interestingly, more than half of the beam-evoked potentiation were new ones (Fig. 5n), which were not potentiated previously in the rotarod task (yellow, Fig. 5c–e). Taken together with the behavioural data (Fig. 4i–k), we have demonstrated that the two learning tasks induced the potentiation of distinct synaptic ensembles.
Figure 5. Visualization of synaptic ensembles for distinct learning tasks.
a, Experimental design. Arc::AS-PaRac1 and CAG::mRFP (filler) was transduced by in utero electroporation. b, Images of dendrites upon learning. AS-PaRac1 puncta are colour-coded based on its appearance and duration. Identical colour-codes are used in c–n. c,f,i, Wide view mapping of AS-PaRac1. d,g,j, The fraction of each spine type. e,h,k, The trajectory of spine size (V). l,m, Differential spine potentiation in each condition. n, The proportions of newly potentiated spines. Scale bar, 2 μm for b; 50 μm for c, f and i..
Finally, we examined whether the same spines are potentiated by the same task. Mice were divided into 2 groups (Fig. 5a). The first group was subjected to the rotarod task in the first 2 days, which was followed by the shrinkage of the learning-evoked potentiation by PA, and then the identical rotarod task was re-trained (re-training condition). The second group was subjected to the rotarod task and subsequent PA, and mice were not trained for another 2 days (home cage condition). We found that the majority of the optically shrunk spines returned to their previously potentiated size after re-training, while the degree of re-potentiation was significantly lower in the home cage group, suggesting that re-training induced the re-potentiation of the same subset of spines (Extended Data Fig. 7d, e). Mice assigned to the dual task protocol were also compared, highlighting the difference in the potentiation patterns among the groups during the last 2 days (Fig. 5c–n). Contrary to the dual task group, spines potentiated during the 1st rotarod training were more likely to be re-potentiated after the 2nd rotarod training in the re-training group (green, Fig. 5f–h, l, n), while re-potentiation was significantly less prominent in mice that did not perform the re-training task (home cage group) (Fig. 5i–k, l, n; Extended Data Fig. 7d, e). Furthermore, newly potentiated spines, which were not potentiated in the first 2 days, were less abundant in the re-training and home cage groups compared with the dual task group (yellow, Fig. 5m, n). These findings suggest that reorganisation of distinct synaptic ensembles is specific for each learning task.
Discussion
Current models of learning and memory suggest that structural plasticity of spines is the underlying mechanism of information storage in the brain. Nonetheless, clear visualization of spine structure in vivo requires the sparse labelling of neurons, and analysis of structural changes in spines is considerably laborious. In contrast, the AS-PaRac1 signal appears as fluorescence puncta, which allows the detection of potentiated spines far more easily, even at high transfection condition. Moreover, the role of potentiated spines can be directly assessed with PA during behavioural examinations. In this study, we showed that photoactivation of the bilateral M1 cortex disrupted the acquired motor skill. We estimated the number of learning-evoked neurons affected by PA was approximately 4,700 neurons based on the following calculation: (a) × (b) × (c) × (d) × (e), in which (a) represents the density of neurons in the neocortex, 9.2 × 10⁴/mm3 (ref 38); (b) the photoactivated area, fibre core diameter = 500 μm, 0.4 mm2/bilateral; (c) the thickness of cortical layers (II–V) that were infected with AAV, 0.8 mm; (d) AAV infection efficiency, 80% (Extended Data Fig. 7f); (e) the percentage of AS-PaRac1-positive neurons upon learning, 20% (Extended Data Fig. 4d). On the other hand, due to the limitations of light transmission, the majority of the shrunk spines resided in layer I (up to 100 μm from the dura). The minimal number of learning-evoked spines illuminated by the optical fibre was roughly 410,000 spines in the bilateral M1 cortex based on the following calculation: (d) × (f) × (g) × (h), in which (f) represents the density of excitatory synapses in the mouse neocortex, 6.4 × 10⁸/mm3 (ref 38); (g) learning-evoked potentiation, approximately 2% of the spines in this area (Extended Data Fig. 4); (h) brain volume that received PA: 0.4 mm2 of PA area × 0.1 mm of depth = 0.04 mm3). In the layer I, corticocortical feedback projections mediating top-down influences are concentrated, which strongly excite a subpopulation of pyramidal neurons39. Learning-evoked changes in neuronal ensembles via the synaptic reorganisation of the M1 cortex directly predict future task performance40. As nonlinear information integration primarily occurs in the tuft of dendrites in behaving animals41, and activation of several spines in the tuft is sufficient to initiate NMDA spikes for action potential generation42. Thus, the shrinkage of potentiated spines in our study (410,000 spines in the dendritic tufts of 4,700 neurons) would reasonably disrupt the learning-evoked substantial remodelling in a specific neuronal population. Formation of the dense connections in a small neuronal ensemble may be consistent with the formation of functional neuronal clusters in the motor cortex after learning43. Thus, synaptic optogenetics might be a powerful tool to uncover the mechanism of synaptic plasticity and its relationships with subsequent behavioural manifestations.
Methods
Ethical considerations
The use and care of animals in this study followed the guidelines of the Animal Experimental Committee of the Faculty of Medicine at the University of Tokyo.
Plasmid construction and transfection
Mutagenesis and deletion of cDNA were conducted based on previously described methods10. Briefly, L514K and L531E mutations of the LOV2 domain were introduced with the following primers (mutations, underlined): 5′-ctt tat tgg ggt tca gaa gga tgg aac tga gca tg- 3′, 5′-gag aga ggg agt cat gga gat taa gaa aac tgc ag -3′, and with their corresponding complementary primers. PSD-95(ΔPDZ1.2) was generated by deleting the nucleotides (nts) 250 to 993 based on the numbering of NM_019621. The DTE sequence of Arc mRNA was cloned from the 1st strand cDNA generated from the frontal cortex of postnatal day 50 (P50) Sprague Dawley (SD) rats with the following primers (HindIII, underlined): 5′-atg ata agc ttt cgg ctc cat gac tca gcc atg cc -3′ and 5′-atg ata agc tta gac acg agc agt tac caa cac g -3′. The generated amplicon, which corresponded to 2036–2699 nts based on the numbering of NM_019361, was subcloned immediately downstream of the stop codon of PaRac1.
Isothermal titration calorimetry (ITC)
ITC for examining the affinity of PaRac1 to the CRIB domain of PAK1 in the lit and dark states was carried out as described previously12.
PaRac1 pull-down assay
PaRac1 variants were transfected into HEK293 cells by lipofection (Lipofectamine™ 2000; Invitrogen, Carlsbad, CA), and the cells were divided into lit and dark groups. The cells in the lit group were illuminated with a white fluorescent lamp (1.5 W for a 10 cm dish, 19 ± 1.0 mW/cm2) for 10 min before cell lysis, and the subsequent immunoprecipitation was performed in continuous light illumination until the final wash step of protein precipitants. Cells in the dark group were manipulated under a yellow fluorescence lamp, which excluded light at the wavelengths below 500 nm to avoid photoactivation. Cells were lysed in a lysis buffer (150 mM NaCl, 50 mM Tris·HCl [pH 7.5], 1% Triton-X [v/v], 10 mM NaF, 10% glycerol [v/v], 1 mM EDTA, and protein inhibitor cocktail [Complete; Roche Diagnostics, Indianapolis, IN]). Lysates were sonicated intermittently on the mixture of ice and water, and cell debris was cleared by centrifugation. The soluble fraction was incubated with an anti-GFP antibody (D253-3; MBL, Nagoya, Japan), followed by co-precipitation with Protein G Sepharose (GE Healthcare, Little Chalfont, UK). The precipitate was immunoblotted with an anti-PAK1 antibody (#2602; Cell Signaling, Beverly, MA). Signal intensity of each band (net signal after subtracting the background signal, which was obtained from the region adjacent to the band) was measured using the ImageJ software (National Institutes of Health, Bethesda, MD).
Immunofluorescence
Cell staining was performed as described previously10. Briefly, dissociated rat cortical neurons at 21 days in vitro (DIV) were fixed with 4% paraformaldehyde (PFA) for 30 min at room temperature (RT). Mice after the behavioural analyses were euthanized, and their brains were perfusion-fixed with 4% PFA and sectioned coronally to obtain 150-μm thick sections. Fixed samples were then permeabilised with Perm/Blocking buffer (2.5% normal goat serum [v/v] in phosphate-buffered saline [PBS] with 0.3% Triton X-100 [v/v]) for 1 h at RT. Samples were incubated for 24 h at 4°C with the following primary antibodies: anti-phospho-neurofilament (SMI-31; Merck KGaA, Darmstadt, Germany), axonal marker; anti-PSD-95 (6G6; Abcam, Cambridge, UK); anti-Emx1 (sc-28220; Santa Cruz, CA) for the staining of pyramidal neurons. After rinsing with PBS (3 times, 5 min each), sections were stained with the corresponding secondary antibodies, followed by mounting. Cell labelling was examined with a confocal microscope (LSM510 META NLO; Carl Zeiss, Oberkochen, Germany).
Hippocampal slice culture and transfection
Hippocampal slices (350-μm thick) were dissected from SD rats at P7 by a vibratome (VT1200S; Leica, Wetzlar, Germany), mounted onto 0.4-μm Millicell™ culture inserts (EMD Millipore, Billerica, MA). At DIV 11, slices were transfected biolistically by a PDS1000/He Biolistic Gene Gun (Bio-Rad, Hercules, CA) with 1.6-μm gold microcarriers. At 2- to 4-days after transfection, cultures were transferred to the recording chambers and constantly perfused with oxygenated artificial cerebrospinal fluid (ACSF, 95% O2 and 5% CO2) containing 125 mM NaCl, 2.5 mM KCl, 2 mM CaCl2, 1 mM MgCl2, 1.25 mM NaH2PO4, 26 mM NaHCO3, 20 mM glucose, and 200 μM Trolox (Sigma-Aldrich, St. Louis, MO) at 29–30°C. In some experiments, we added tetrodotoxin (Wako, Osaka, Japan, 1 μM), bicuculline methiodide (Sigma-Aldrich, 12 μM), lactacystin (EMD Millipore, 10 μM) to culture and the recording medium.
In utero electroporation
This procedure was performed according to the published protocol with minor modifications11. Briefly, pregnant C57BL/6 mice were anaesthetized at embryonic day 13 (E13) or 14.5 (E14.5) with isoflurane, and AS-PaRac1-Venus and filler constructs (2 μg each) were injected unilaterally into the ventricle. Electrode pulses (electrodes: φ3 mm for E13 and φ5mm for E14.5, 33 V, 50 ms pulse length, 950 ms pulse interval, 4 pulses) were charged unilaterally for the targeting to the M1 cortex.
AAV viral production
AAV viral production was performed with the AAV helper-free system (Agilent Technologies, Santa Clara, CA). The pRep-Cap (AAV5; Applied Viromics, Fremont, CA) and the pHelper plasmid were co-transfected into the AAV-293 cells with polyethylenimine ‘Max’ (Polysciences, Warrington, PA). After 72-h-long incubation, cells were harvested and lysed with five freeze-thaw cycles. The resultant supernatants were overlaid on 40% sucrose solution containing 100 mM Tris-HCl (pH 8.0), 150 mM NaCl, and 0.01% BSA (v/v), and were centrifuged at 100,000 g for 16 h at 4°C. The pellet (crude viral particles) was treated with 1000 U benzonase nuclease (Novagen, Madison, WI) for 1 h at 37°C. After filtering through a 5-μm syringe filter to remove debris, the filtered material was subjected to CsCl gradient centrifugation (1.25 g/ml and 1.50 g/ml) at 257,300 g for 48 h at 15°C. The virus-rich fraction was restored, and the solvent was replaced with ASCF (1 mM MgCl2, 10 mM HEPES, CaCl2-free). Virus titre was determined with quantitative real-time PCR analysis (SYBR Green; Takara Bio Inc., Shiga, Japan).
Virus injection and open-skull cranial window surgery
Adult male C57BL/6 mice were anaesthetized with isoflurane, and mannitol (4 μg/g of body weight) and dexamethasone (7 μg/g of body weight) was administered intraperitoneally to prevent brain swelling. Subcutaneous injections of ketoprofen (40 μg/g body weight) and penicillin/streptomycin (4 U/g body weight) were administered for 4 consecutive days beginning 1 day before the operation to prevent inflammation. The skull was exposed over the M1 cortex based on stereotactic coordinates. Then, 1 μl of AAV (0.5 to 4.0 × 10¹³ genome copies/ml) was injected in the M1 cortex using a glass pipette (tip diameter 30 μm, bevelled at an angle of 45°) at a rate of 150 nl/min using a syringe pump (Legato130; Muromachi Kikai, Tokyo, Japan). The location of the injection site was standardized among animals by using stereotaxic coordinates (AP = −0.8; ML = +1.0; DV = +0.5) from the skull. At the end of the injection, we waited 5 min before retracting the pipette. Stainless steel trephines (φ 2.7 mm; Fine Science Tools, Foster City, CA) were used to generate a circular open skull window. To avoid brain damage, intermittent drilling was performed at a speed of 10,000 rpm with a continuous gentle perfusion of oxygenated ACSF, and we tried to avoid applying excessive drilling pressure on the skull as much as possible. If we detected no bleeding, the drilled hole was covered with a circular coverslip (φ 2.7 mm, < 0.1 mm thickness, Matsunami Glass, Kishiwada, Japan) and sealed with dental cement (Fuji Lute BC; GC, Tokyo, Japan), which was followed by the attachment of the headgear for in vivo imaging.
Two-photon imaging, glutamate uncaging, and PA
Two-photon imaging was performed with an upright microscope (BX61WI; Olympus, Tokyo, Japan) equipped with an FV1000 laser scanning microscope system (FV1000, Olympus) and water-immersion objective lenses (LUMPlanFL N, 60×, 1.0 N.A.; XLPLN25XWMP2, 25×, 1.05 N.A.). Two mode-locked, femtosecond-pulse Ti:sapphire lasers (MaiTai DeepSee and HP; Spectra Physics, Mountain View, CA) were used at 1000 nm for dual-colour imaging (Venus and mRFP) and at 720 nm for glutamate uncaging. For three-colour imaging of mTurquoise/GCaMP6/mRFP, the two independently captured images at 780 nm (mTurquoise and mRFP) and 970 nm (GCaMP6 and mRFP) were merged based on the identical fluorescence signal of mRFP. For in vitro imaging, 10–40 xy images (5× digital zoom, 512 × 512 pixels) with a z-axis step size of 0.5 μm were captured. For in vivo imaging, mice were anaesthetized with isoflurane, and images (2× digital zoom, 1024 × 1024 pixels) were captured starting at the dura and progressing into the brain tissue for up to 650 μm in total with a step size of 1.0 μm. For glutamate uncaging, 8 mM MNI-glutamate (Tocris Bioscience, Bristol, UK) was dissolved in Mg2+-free ACSF containing 1 μM tetrodotoxin, and using a glass pipette, this solution was applied locally onto the dendrites in the presence or absence of 10 μM forskolin (Wako) and 5 μM anisomycin (Sigma). Repetitive (5 Hz, 80×) photolysis of MNI-glutamate in the spine heads was performed at 720 nm with a pulse duration of 0.6 ms, and intensity of the uncaging laser was 6 mW under the objective lens.
Data quantification
XY images were stacked by the summation of fluorescence values at each pixel. For spine size estimation, individual spines on the dendrites were traced manually, and fluorescence intensity of the filler (mRFP, DsRed Ex2, or mTurquoise) was measured in the spine-head. For each channel, background intensity was subtracted from the fluorescence intensity (a.u.) of each spine. During time-lapse imaging, daily variations in the recording conditions caused slight alterations in the fluorescence intensity, which was corrected with the fluorescence intensity changes of the filler along the parental dendritic shaft within a distance of 10 μm from the spine. The ‘Spine enrichment index’ was estimated based on the previous report20. To assess the uneven distribution of PaRac1 variants in the dendrite, the ‘Hot spot index’ was calculated using the following equations:
where ‘Spine enrichment indexi’ and ‘Spine enrichment indexi+1’ represent the enrichment indices of a given spine and of its nearest neighbouring spine, respectively, and ‘n’ represents the number of spines in the measured dendritic branch (20 μm long). Hot spot index was obtained from the most intensively labelled dendritic segments, and estimated by repetitive measurements of sequential nearest neighbouring spines. Quantification of fluorescence was performed with the ImageJ software.
In vivo PA in freely moving animals
Mice transduced by either AAV injection or in utero gene transfer were subjected to open-skull cranial window surgery, and the cranial holes were covered with bilateral glass windows. An outer cylinder (a non-bevelled 15 mm long 18G needle with an inner diameter of 0.9 mm) was implanted on the glass window for PA. Before PA, the optical fibre was inserted into the outer cylinder, and the tip of the fibre was placed directly onto the glass coverslip. The fibre and the outer cylinder were tightly locked together with Blu-Tack, which was easily removed after the PA. Photostimulation was carried out using the COME-2 series (Lucir, Osaka, Japan), which consist of 457-nm laser diodes, an optical swivel, and bilateral optical fibres (COME2-αDF1; core diameter of 500 μm, 0.5 N.A.). The laser diode was adjusted to an output of 20 mW at the tip of each fibre. The light pulse was delivered for 150 ms at 1 Hz for 1 h, and the process was controlled by customised LabView programs (National Instruments, Austin, TX).
Behavioural analysis
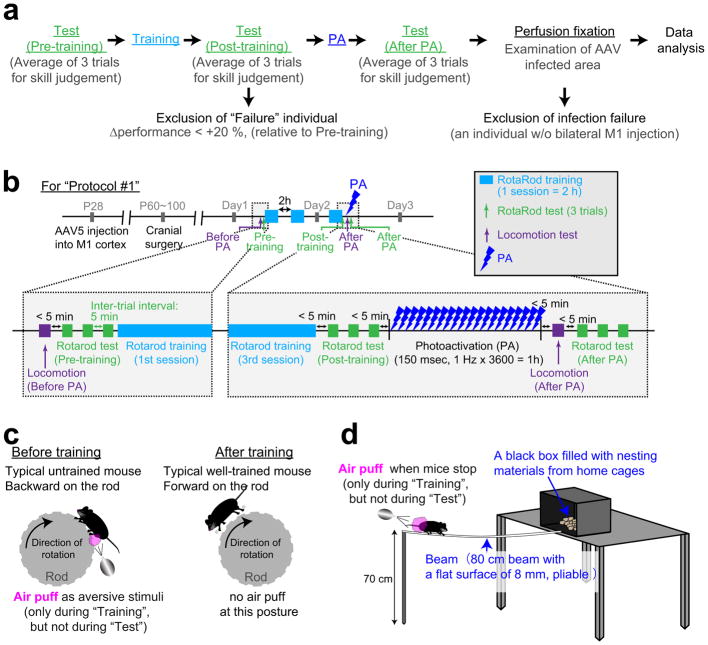
Mice were housed under standard laboratory conditions (12-h light/dark cycle with food and water available ad libitum) and were randomly allocated to experimental groups. All behavioural analyses were performed during the light phase. For motor learning (Extended Data Fig. 9), we used the Rotarod training system (Rota-Rod Treadmills ENV-576; Med Associates, St. Albans, VT). Before the training sessions, mice were habituated to stay on the stationary rod for 2 min. During the training period, the fixed-speed protocol was applied at a slow speed (8 rpm), so mice rarely fell off the rod. After the mice were able to remain on the rod reliably, the speed was increased in a stepwise fashion to 40 rpm. We applied air puffs to the hind limbs as aversive stimuli to teach mice to face forward on the rod (Extended Data Fig. 9c), which helped them to hold on at higher speeds. After falling, the mice were immediately placed back on the rod, and latency of falling was recorded automatically. Three training sessions were performed for 2 days (2 h for 1 session, 6 h of training in total). To assess learning, three trials of the rotarod test were carried out using an accelerating protocol (4 to 40 rpm) without air puffs with 5 min inter-trial intervals.
For balance beam training, a hand-made beam apparatus was used (Extended Data Fig. 9d). Time to cross was scored using a stopwatch. The timer was started when the mouse was placed on the beam and ends when the first forepaw was placed in the goal cage. Air puffs to the hind limbs were also used to facilitate learning. Three training sessions were performed during 2 days (2 h for 1 session, 6 h of training in total). To evaluate the acquired performance, three trails of the beam test were carried out without air puffs with 5 min inter-trial intervals. Task performances were calculated as the averages of the three trials for both the rotarod and beam tasks. Mice with an improvement of < 20% compared to the pre-training performance were excluded from the analyses. The running speed of mice was measured by a video tracking system (Limelight3; Actimetrics, Wilmette, IL). The investigator was not blinded to the group allocation during the experiments because all behavioural outcomes were unambiguously determined: e.g. RotaRod performance and locomotion were scored automatically with infrared or video tracking, and the manual scoring of the cross time for the beam test was unambiguous.
Statistics
A series of experiments were performed as two, mostly three separate cohorts, and sample size was chosen based on the effect size shown in the first cohort in order to minimize the number of animals used in compliance with ethical guidelines. Combined data for all three cohorts data are shown as means ± s.e.m. Detailed information of statistical methods/results are described in the Extended Data Table. In brief, Mann-Whitney U tests were used to identify significant differences between two groups. Multiple comparisons were made by one-way analysis of variance (ANOVA, normal distribution and equal variances), nonparametric one-way ANOVA (Kruskal-Wallis test, for unequal variances), or one-way repeated measures ANOVA followed by post-hoc Bonferroni test (to compare task performance at different time points for within-subjects groups). Spearman rank correlation was used to test the strength of correlation between two variables. For all statistical tests *P < 0.05, **P < 0.01, ***P < 0.001 were considered significant.
Extended Data Table.
Detailed information for the samples description and statistics.
| Sample | Statics | |||||||||||
|---|---|---|---|---|---|---|---|---|---|---|---|---|
| Description | Size (n) | Methods | Comparison | P values | Correlation coefficient | |||||||
| Figure 1a | Hippocampal slice culture+ Gene Gun | Construct (A) = 13 dendrites/13 slices/3 rats | Enrichment | Hot spot | ||||||||
| Construct (B) = 20 dendrites/20 slices/6 rats | One-way factorial ANOVA (post-hoc Dunnet test) | (A) vs (B) | 0.03896 | 0.48912 | ||||||||
| Construct (C) = 23 dendrites/23 slices/6 rats | (A) vs (C) | 0.00001 | 0.00000 | |||||||||
| Construct (D) = 8 dendrites/8 slices/3 rats | (A) vs (D) | 0.69713 | 0.81024 | |||||||||
| Construct (E) = 8 dendrites/8 slices/3 rats | (A) vs (E) | 0.00130 | 0.00929 | |||||||||
| Figure 1b–d | mRFP | Venus | ||||||||||
| uncaging alone (A) = 15 dendrites 15 slices/6 rats | Kruskal Wallis test (post-hoc Scheffe’s test) | (A) vs (B) | 0.62258 | 0.01139 | ||||||||
| uncaging + FSK (B) = 35 dendrites/35 slices/8 rats | (A) vs (C) | 0.00430 | 0.10843 | |||||||||
| uncaging + Aniso (C) = 20 dendrites 15 slices/6 rats | (B) vs (C) | 0.00000 | 0.00000 | |||||||||
| Figure 1e | Enrichment | Hot spot | ||||||||||
| Vehicle = 13 dendrites/13 slices/3 rats | Mann-Whitney test (two-sided) | Veh vs Lac | 0.00134 | 0.00030 | ||||||||
| Lactacystin = 8 dendrites/8 slices/3 rats | ||||||||||||
| Figure 2d | In vivo M1 cortex + In utero EP (E14.5) | Enlarged | New | Shrunk | Eliminated | |||||||
| Training = 2793 spines/7 mice | Mann-Whitney test (two-sided) | (Training) vs (No training) | 0.03887 | 0.02014 | 0.12134 | 0.12134 | ||||||
| No training = 718 spines/3 mice | ||||||||||||
| Figure 2f | Training = 2090 spines/3 mice | Spearman’s rank correlation coefficient | ΔV (0 day) & AS (0 day) | 0.00000 | 0.61278 | |||||||
| Figure 2g | ΔV (0 day) & AS (−1 day) | 0.51746 | −0.03549 | |||||||||
| Figure 2k | Enlarged | New | ||||||||||
| 68 spines (enlarged or new spines) out of 2090 total spines for Fig 2e–j | Mann-Whitney test (two-sided) | [AS(+1 day)≥1] vs [AS (+1 day)<1] | 0.00263 | 0.00016 | ||||||||
| Figure 3c | In vivo M1 cortex + In utero EP | 94 spines/6 mice | Mann-Whitney test (two-sided) | [AS (+)] vs [AS (−)] | 0.00000 | |||||||
| Figure 3d | Spearman’s rank correlation coefficient | ΔV & Depth | 0.28151 | −0.17225 | ||||||||
| Figure 3i, j | Hippocampal slice culture+ Gene Gun | AS(+) | AS(−) | AS(+) | AS(−) | |||||||
| 24 spines/12 slices/6 mice | Spearman’s rank correlation coefficient | ΔV & ΔAmp | 0.01793 | 0.57016 | 0.58235 | 0.23810 | ||||||
| ΔV & ΔFreq | 0.58679 | 0.95537 | −0.14706 | 0.02381 | ||||||||
| Figure 3i, j | Amplitude | Frequency | ||||||||||
| 16 soma/12 slices/6 mice | Wilcoxon signed rank test | (Before PA) vs (After PA) | 0.24886 | 0.09620 | ||||||||
| Figure 4b–d | In vivo M1 cortex + Bilateral AAV5 infection | mRFP (Prot #1) | AS (Prot #1) | AS (Prot #2) | AS (Prot #3) | |||||||
| mRFP alone (Protocol #1) = 10 mice mRFP + AS-PaRac1 (Protocol#1) = 15 mice mRFP + AS-PaRac1 (Protocol #2) = 12 mice mRFP + AS-PaRac1 (Protocol#3) = 5 mice |
One-way repeated measures ANOVA (post-hoc Bonferroni test) | (Pre-training) vs (0 day) | 0.00090 | 0.00000 | 0.00000 | 0.00034 | ||||||
| (0 day) vs (+1 day) | NA | NA | 0.83880 | NA | ||||||||
| (0 day) vs (+2 day) | NA | NA | NA | 1.00000 | ||||||||
| (0 day) vs (After PA) | 0.59421 | 0.00056 | 0.00003 | 1.00000 | ||||||||
| (+1 day) vs (After PA) | NA | NA | 0.00000 | NA | ||||||||
| (+2 day) vs (After PA) | NA | NA | NA | 1.00000 | ||||||||
| (Pre-training) vs (After PA) | 0.00005 | 0.00070 | 0.01852 | 0.00012 | ||||||||
| Figure 4e | One-way factorial ANOVA (post-hoc Scheffe’s test) | (Prot #1) vs (Prot #2) | 0.22430 | |||||||||
| (Prot #2) vs (Prot #3) | 0.00047 | |||||||||||
| (Prot #1) vs (Prot #3) | 0.00989 | |||||||||||
| Figure 4f–h | mRFP (Prot #1) | AS (Prot #1) | AS (Prot #2) | AS (Prot #3) | mRFP (Prot #1) | AS (Prot #1) | AS (Prot #2) | AS (Prot #3) | ||||
| Spearman’s rank correlation coefficient | PA effect and learning attainment | 0.74518 | 0.04664 | 0.00156 | 0.95715 | 0.1051 | −0.5206 | −0.8056 | 0.0286 | |||
| Figure 4j | Non-PA (RotaRod) | Non-PA (Beam) | PA (RotaRod) | PA (Beam) | ||||||||
| Non-PA group = 13 mice PA group =13 mice |
One-way repeated measures ANOVA (post-hoc Bonferroni test) | (Pre-training) vs (0 day) | 0.00000 | 0.00000 | 0.00000 | 0.00000 | ||||||
| (0 day) vs (+2 day) | 1.00000 | NA | 1.00000 | NA | ||||||||
| (0 day) vs (After PA) | 1.00000 | 1.00000 | 1.00000 | 0.04755 | ||||||||
| (+2 day) vs (After PA) | 0.66982 | NA | 1.00000 | NA | ||||||||
| (Pre-training) vs (After PA) | 0.00000 | 0.00000 | 0.00000 | 0.00000 | ||||||||
| Figure 4k | Spearman’s rank correlation coefficient | PA effect on each task | 0.06148 | −0.53168 | ||||||||
| Figure 5d, g, j, l, m | In vivo M1 cortex + In utero EP (E14.5) | Both Day2/4 | Day 4 specific | |||||||||
| Dual task group = 1713 spines/5 mice Re-training group = 765 spines/5 mice Home cage group = 861 spines/5 mice |
One-way factorial ANOVA (post-hoc Scheffe’s test) | (Dual) vs (Re-training) | 0.09206 | 0.21206 | ||||||||
| (Re-training) vs (Homecage) | 0.00708 | 0.57905 | ||||||||||
| (Dual) vs (Homecage) | 0.35558 | 0.03786 | ||||||||||
| Figure 5e, h, k | Dual task | Re-training | Homecag | |||||||||
|
Dual task group: Day2 specific spines = 48, Both Day2/4 spines =13, Day4 specific spines = 26 |
One-way factorial ANOVA (post-hoc Scheffe’s test) | (Day2) vs (Both Day2/4) | 0.00331 | 0.04339 | 0.00147 | |||||||
|
Re-training group: Day2 specific spines = 10, Both Day2/4 spines =15, Day4 specific spines = 9 |
(Day2) vs (Day4) | 0.00077 | 0.04579 | 0.01531 | ||||||||
|
Home cage group: Day2 specific spines = 10, Both Day2/4 spines =6, Day4 specific spines = 9 |
(Both Day2/4) vs (Day4) | 0.92817 | 0.95804 | 0.65233 | ||||||||
| Figure 5n | Dual task group = 5 mice Re-training group = 5 mice Home cage group = 5 mice |
Chi-squared test (Post-hoc Bonferonni correction) | (Dual) vs (Re-training) | 0.00000 | ||||||||
| (Re-training) vs (Homecage) | 1.00000 | |||||||||||
| (Dual) vs (Homecage) | 0.00000 | |||||||||||
Extended Data
Extended Data Figure 1. Optimisation of the PaRac1 for the synaptic application.
a, Isothermal titration calorimetry (ITC) experiments showing that the introduction of L514K and L531E mutations into the original PaRac1 construct12 reduced binding with the CRIB domain of PAK1 in the dark. The light-insensitive form of LOV2 (C450A) and the I539E mutant, which mimics the unfolded ‘lit state’, were used as negative and positive controls, respectively. b, Leaky activity of PaRac1 in the dark. In hippocampal neuronal cultures transfected with the original PaRac1, we observed a bearded appearance of the soma with a numerous ectopic dendrites, while neurons transfected with PaRac1 (L514K/L531E) were indistinguishable from normal neurons. c, Assessment of the affinity of PaRac1 to the endogenous PAK1 using a pull-down assay. HEK293 cells, which were transfected with PaRac1-Venus, were divided into two groups: lit and dark. The cells in the lit group were radiated with light with a white fluorescent lamp before cell lysis, and continuous light illumination was present during subsequent immunoprecipitation until the final wash step of protein precipitants. Conversely, cells in the dark group were lit with a yellow fluorescence lamp, which excludes light wavelengths below 500 nm. Co-immunoprecipitation with PAK1 revealed that PaRac1 (L514K/L531E) barely bound with PAK1 in the dark (The number of trial is depicted in the bar graph, **P < 0.01 using the Mann-Whitney U test). d, Targeting of PaRac1 to the postsynaptic density. PSDΔ1.2-PaRac1 [DTE (−)] was transfected into dissociated cortical neurons at 21 days in vitro (DIV). Two days after transfection, cells were fixed with 4% PFA, followed by permeabilization for the subsequent immunostaining procedure. Axons and endogenous PSD-95 were visualized using the anti-phospho-neurofilament and anti-PSD-95 antibodies, respectively, revealing that PSDΔ1.2-PaRac1 co-localised with the endogenous PSD-95. Note that PSDΔ1.2-PaRac1 did not co-localise with the axonal marker.
Extended Data Figure 2. The distribution of AS-PaRac1 is regulated by neuronal activity, and is dependent on the dendritic targeting element (DTE).
a, Experimental design. b, Representative image of a cultured hippocampal neuron. c, Bicuculline (BIC) or tetrodotoxin (TTX) was added to the culture media at the designated time points. Images were captured at a high magnification and were tiled to visualize the entire cell. Green circles represent the AS-PaRac1 puncta. d, Quantification of AS-PaRac1 distribution (n = 6/each, *P < 0.05, **P < 0.01 using Kruskal-Wallis test followed by post-hoc Dennett’s test). e, Concomitant accumulation of AS-PaRac1 and SEP-GluA1 in spines. Neurons were co-transfected with mTq (mTurquoise, filler), SEP-GluA1, and AS-PaRac1-mRFP, and the constructs were expressed for 36 h. Potentiated spines during 36 h were shown by SEP-GluA1 fluorescence (arrowheads). Spearman rank correlation revealed a significant correlation between the spine enrichment indices of SEP-GluA1 and AS-PaRac1 (each circle represents one spine, 235 spines, 29 dendrites). f, Schematic of the constructs and representative images of single spine potentiations by glutamate uncaging in the presence of FSK (arrowheads). Rat hippocampal slice cultures were biolistically transfected with either AS-PaRac1 or PSD-PaRac1 [DTE (−)] followed by the uncaging experiments at DIV 13 (equivalent to postnatal day 20). g, Time course of the spine head volume (V) and accumulation of Venus upon uncaging. The mean changes in spine size and Venus accumulation in the stimulated or neighbouring spines are depicted 60 min after uncaging. For quantification, we used pooled data from independent identically designed experiments. The data set for AS-PaRac1 was identical with the FSK-treated group of Fig. 1c–e. Scale bar, 1 μm. *P < 0.05 using the Mann-Whitney U test (n = 6 or 11 dendrites for PSD-PaRac1 or AS-PaRac1, respectively).
Extended Data Figure 3. Putative cellular mechanisms of the specific concentration of AS-PaRac1 in potentiated spines.
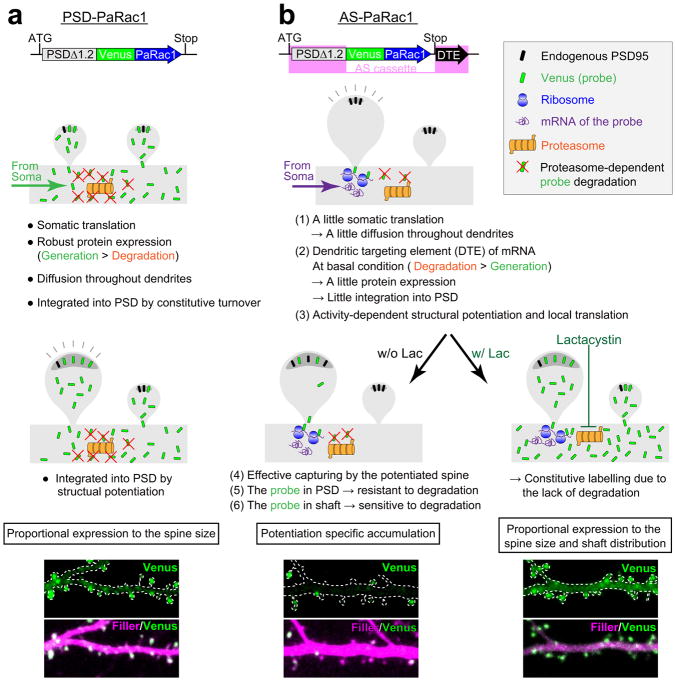
a, Uniform labelling of spines with the PSD-PaRac1 construct that lacks DTE of Arc 3′ UTR (Fig. 1a, construct B). PSD-PaRac1 is translated in the soma that is abundantly equipped with translational machineries. Therefore, the somatic protein expression of the probe is high (data not shown), which would outnumber the degradation, and the resulting proteins are transported throughout dendrites. The overflowing probes integrate into the postsynaptic density (PSD) during the constitutive turnover of PSD molecules. Therefore, probe expression is proportional to the spine size.
b, Selective labelling of potentiated spines with AS-PaRac1 (Fig. 1a, construct C). The following six mechanisms endow the potentiation-specific labelling with AS-PaRac1. (1) A little somatic translation: the moderate gene expression of AS-PaRac1, by which the translation of AS-PaRac1 protein is limited in the soma (see Extended Data Fig. 2b), and therefore, the non-specific overflow of this probe from the soma into the dendrites is minimal. (2) Dendritic targeting element (DTE): the essential domains of AS-PaRac1 are the N-terminal PSD-95 (PSDΔ1.2) and the 3′ UTR of Arc mRNA (DTE). DTE has a pivotal role in the dendritic targeting of mRNAs44,45. One of the most well-known DTE is present in the Arc mRNA16, which is targeted to stimulated dendritic segments in an activity-dependent manner18. The transport of mRNA out of soma also contributes to the limited translation of the probe in the soma described in (1). In the absence of activation, the limited amount of translational machineries and presence of degradation components in the dendrites maintains the locally translated probe at a low level, which results in a low rate of AS-PaRac1 integration into the PSD during the constitutive turnover of PSD proteins. (3) Local protein synthesis: persistent structural plasticity of the spine depends on the activity-dependent dendritic synthesis of proteins46, and the translation of Arc mRNA is controlled by activity levels19. (4) Effective capturing of PSD proteins in the structurally potentiated spines: the potentiated spine, which rapidly requires new copies of PSD proteins, captures diffusing PSD proteins more efficiently47,48. (5) Increased stability of AS-PaRac1 in the PSD: it is likely that the stability of the PSD-integrated AS-PaRac1 increase, as does the typical PSD scaffold proteins47. The ubiquitination might be underling mechanism of the increased stability, because the ubiquitination site of AS-PaRac1 resides in the N-terminal domain of PSD-95, the domain of which is aggregated to form head-to-head multimerization in the postsynaptic scaffold49. Thus, once AS-PaRac1 is integrated into the PSD, the ubiquitination site may be concealed, and AS-PaRac1 becomes relatively stable. (6) Sensitivity of unbound AS-PaRac1 against the proteasomal degradation: contrary to the PSD-integrated AS-PaRac1, unbound AS-PaRac1 is sensitive to degradation because the ubiquitination site is not concealed. This scenario is supported by the administration of lactacystin (right panel), which inhibits proteasomes and thus completely disrupts the uneven distribution of AS-PaRac1. Similar mechanisms are relevant for newly formed spines, because spine formation is associated with spine enlargement50.
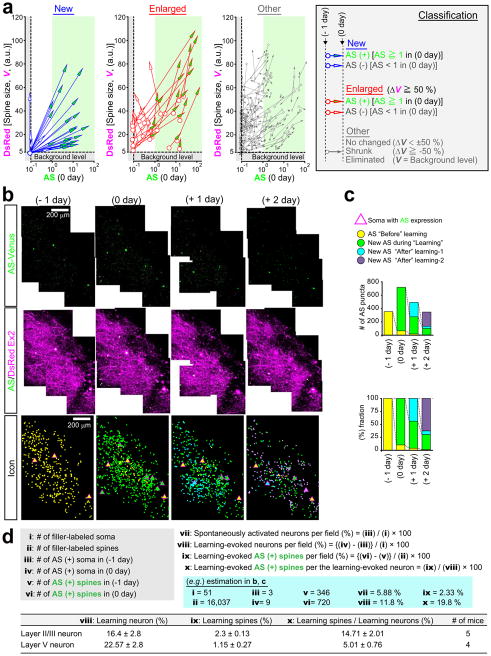
Extended Data Figure 4. Raw data of the quantification and synaptic mapping shown in Fig. 2.
a, Quantification of spine size (based on DsRed fluorescence) and AS-PaRac1 fluorescence after learning are depicted separately based on the classification of spines. The definitions of ‘New spine’, ‘Enlarged spine’ and others are described on the right. Each arrow indicates the trajectory of a spine; beginning and end points represent the absolute values before and after the rotarod task, respectively. b, XY images were captured from the dura to a depth of 300 μm with a step-size of 1.0 μm, and were stacked by the summation of fluorescence values at each pixel. Z-stacked images of 10 overlapping fields were aligned to generate the combined images. AS-PaRac1 and AS-PaRac1/DsRed merged images are shown. AS-PaRac1 that was present before learning (−1 day, yellow), appeared shortly after learning (learning period, 0 day, green), 1 day (after −1, +1 day, blue), or 2 days after learning (after −2, +2 day, purple) are depicted to show the spatiotemporal distribution of AS-PaRac1 triggered in each period. c, Time course of the number and fraction of AS-PaRac1-positive spines in each period. d, Calculation of the learning-evoked spine/neuron ratio (%). Example of the calculation is based on the raw data shown in b and c. The table indicates the comparison between neurons in layer II/III (in utero EP at E14.5) and layer V (in utero EP at E13).
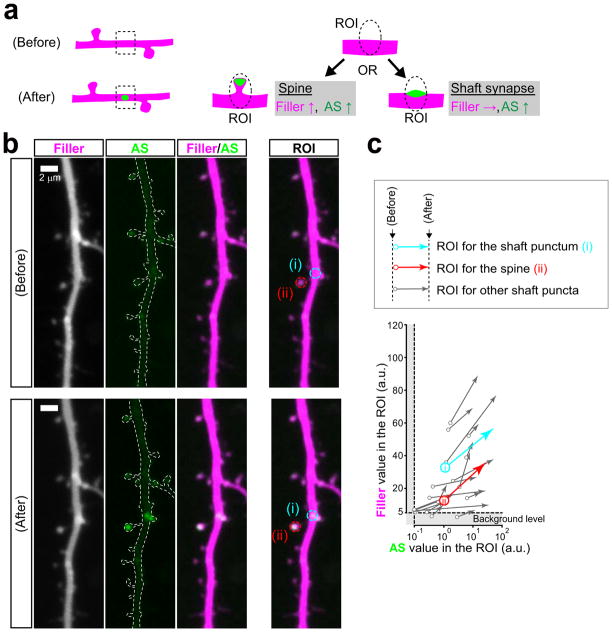
Extended Data Figure 5. Assessment of AS-PaRac1 puncta on the dendritic shaft.
a, The two possible synapse types that AS-PaRac1 puncta may represent on the dendritic shaft. XY images were captured to encompass the entire Z-range of the dendrite of interest with a step-size of 0.5 μm, and images were stacked by the summation of fluorescence values at each pixel. The fluorescence of both the filler and AS-PaRac1 would increase, if the AS-PaRac1 punctum emerged on the dendritic spine that undergoes structural potentiation. In contrast, fluorescence of the filler would not increase, if AS-PaRac1 was in the shaft synapse. b, Example of the dendrites before and after the emergence of AS-PaRac1. AS-PaRac1 puncta on the shaft and on the dendritic spine are indicated with (i) and (ii), respectively. The ROI used for the calculation of fluorescence in each punctum is shown. c, Quantification of the fluorescence of the filler and AS-PaRac1 upon the emergence of AS-PaRac1 puncta. Each arrow indicates the trajectory of each ROI; beginning and end points represent the absolute values before and after the emergence of AS-PaRac1, respectively. The ROI at (i) exhibited a concomitant fluorescence increase in both the filler and AS-PaRac1, similar to AS-PaRac1 in a typical dendritic spine (ii). All examined AS-PaRac1 puncta on the dendritic shaft exhibited positive correlations, suggesting that the majority of AS-PaRac1 puncta emerge on the dendritic spine during the structural changes of the spine.
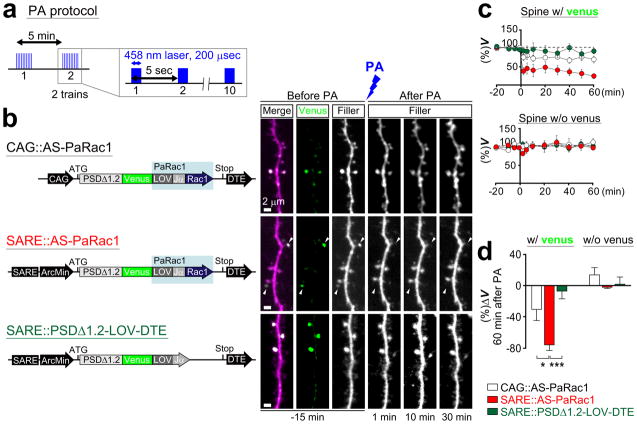
Extended Data Figure 6. Rac1-dependent shrinkage of dendritic spines induced by low-frequency PA.
a, The protocol of PA. PA was performed in the region that encompasses the branch of interest. b, Neurons in the hippocampal slice culture (DIV 11) were biolistically transfected with DNA constructs shown in the schematic image on the left. Representative dendritic images upon PA are shown on the right. Robust shrinkage (arrowheads) was observed in the spines transfected with AS-PaRac1 driven by the SARE-Arc promoter. Despite their adjacent location to the AS-PaRac1-positive spines, AS-PaRac1-negative spines were not affected by the PA. c, Time course of the spine head volume (V) of Venus-positive (upper panel) and negative spines (lower panel). White, red, and blue circles represent CAG::AS-PaRac1, SARE::AS-PaRac1, and SARE::PSDΔ1.2-LOV-DTE, respectively (n = 12 cells/each). d, The mean relative change in spine head size in Venus-positive and negative spines 60 min after PA. Scale bar, 2 μm. *P < 0.05 and ***P < 0.001 according to the Kruskal-Wallis test followed by the post-hoc Scheffé’s test.
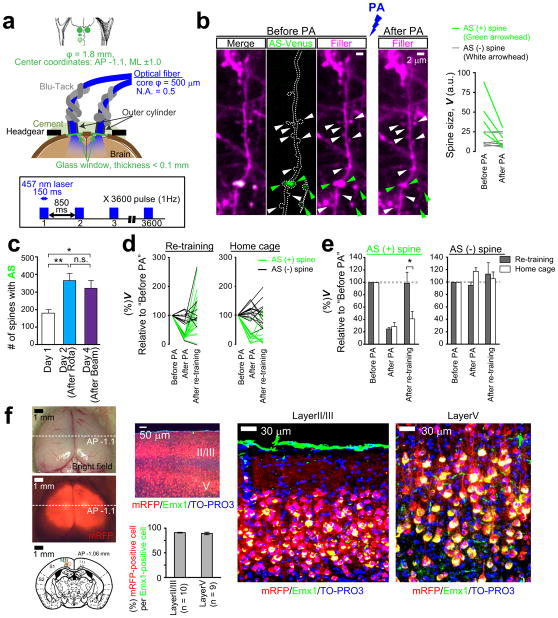
Extended Data Figure 7. Spine shrinkage in broad areas of the bilateral motor cortices induced by blue laser illumination.
a, Schematic of the bilateral cranial windows, optical fibres, and the PA protocol. b, Representative images of spine shrinkage in the M1 cortex upon PA in vivo. AS-PaRac1-positive spines (green arrowheads) shrank, while the AS-PaRac1-negative ones (white arrowheads) did not. Quantification of spine size is shown on the right. c, The mean number of AS-PaRac1 puncta per fields was calculated in mice shown in the Fig. 4i. d, e, Spine structure and AS-PaRac1 were imaged in mice, which were subjected to the re-training and homecage protocols shown in Fig. 5. The majority of AS-PaRac1-positive spines displayed PA-induced shrinkage and subsequent recovery. *P < 0.05 according to the Mann-Whitney U test. f, The success of AAV5 vector injection into the bilateral M1 cortex was confirmed by the presence of mRFP fluorescence after behavioural tests. High efficacy of virus infection in layer II/III and V pyramidal neurons was demonstrated with Emx1 immunostaining, which labels pyramidal neurons. The mice without bilateral mRFP signal in the M1 cortex were excluded from the data analysis.
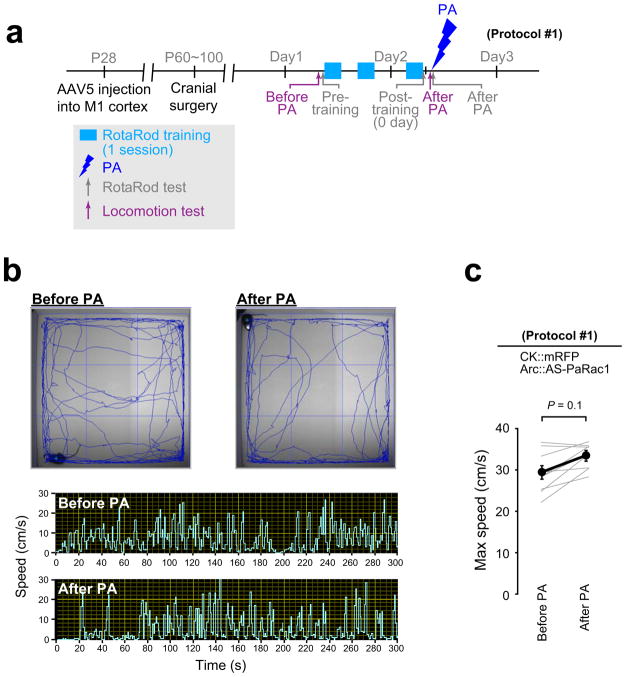
Extended Data Figure 8. No effect of PA on the locomotor activity of mice.
a, Experimental schedule. The running speed of AS-PaRac1-injected mice in protocol #1 (Fig. 4a) was measured with a video-tracking system. To minimize the effect of circadian rhythm on locomotion, mice were tested at the same time of the day before and after PA. b, Representative traces of locomotion and temporal sequences of running speed are depicted. c, Statistical analysis shows that PA has only a negligible effect on running speed.
Extended Data Figure 9. Detailed illustration of the rotarod and beam tasks in the Fig. 4.
a, Experimental flowchart. b, Detailed schedule of the rotarod training/test, locomotion test, and PA. c, To shorten the training time, air puffs were applied to the hind limbs as aversive stimuli to maintain the forward-looking position of mice on the rod, which improved the performance, especially at higher speeds. d, Schematic illustration of the beam test. The test was preceded by a 6-h-long training session that lasted for 2 days.
Acknowledgments
We thank H. Bito and H. Okuno for the generous gift of the Arc promoter; F. Murakami for the information about Arc 3′UTR; M. Yuzaki, K. Inokuchi, and K. Fox for invaluable discussion. This research was supported by Grants-in-Aid from the Ministry of Education, Culture, Sports, Science, and Technology (MEXT, Japan; No. 2000009 to H.K.and No. 26221011 to H.K. and A.H-T., No. 23689055 and No. 24116003 to A.H-T.), the project Brain Mapping by Integrated Neurotechnologies for Disease Studies (Brain/MINDS, AMED) to H.K., the PRESTO program (JST) to A.H-T., the National Institutes of Health grant GM102924 to K.M.H., and the Research Grant from the Human Frontier Science Program to H.K., K.M.H. and B.K.
Footnotes
Supplementary Information is linked to the online version of the paper at www.nature.com/nature.
Conflict of interest statement. The authors declare that they have no competing financial interests.
Author Contributions
A.H-T., S.Y., M.N., and F.S. conducted the experiments. Y.W., A.L.L., K.M.H., and B.K. provided technical support for the development of PaRac1. A.H-T. and H.K. designed the study and wrote the manuscript.
References
- 1.Bernstein JG, Boyden ES. Optogenetic tools for analyzing the neural circuits of behavior. Trends Cogn Sci. 2011;15:592–600. doi: 10.1016/j.tics.2011.10.003. [DOI] [PMC free article] [PubMed] [Google Scholar]
- 2.Tye KM, Deisseroth K. Optogenetic investigation of neural circuits underlying brain disease in animal models. Nature Rev Neurosci. 2012;13:251–266. doi: 10.1038/nrn3171. [DOI] [PMC free article] [PubMed] [Google Scholar]
- 3.Liu X, et al. Optogenetic stimulation of a hippocampal engram activates fear memory recall. Nature. 2012;484:381–385. doi: 10.1038/nature11028. [DOI] [PMC free article] [PubMed] [Google Scholar]
- 4.Holtmaat A, Svoboda K. Experience-dependent structural synaptic plasticity in the mammalian brain. Nature Rev Neurosci. 2009;10:647–658. doi: 10.1038/nrn2699. [DOI] [PubMed] [Google Scholar]
- 5.Kasai H, et al. Structural dynamics of dendritic spines in memory and cognition. Trends Neurosci. 2010;33:121–129. doi: 10.1016/j.tins.2010.01.001. [DOI] [PubMed] [Google Scholar]
- 6.Yuste R. Dendritic spines and distributed circuits. Neuron. 2011;71:772–781. doi: 10.1016/j.neuron.2011.07.024. [DOI] [PMC free article] [PubMed] [Google Scholar]
- 7.Murakoshi H, Yasuda R. Postsynaptic signaling during plasticity of dendritic spines. Trends Neurosci. 2012;35:135–143. doi: 10.1016/j.tins.2011.12.002. [DOI] [PMC free article] [PubMed] [Google Scholar]
- 8.Luo L, et al. Differential effects of the Rac GTPase on Purkinje cell axons and dendritic trunks and spines. Nature. 1996;379:837–840. doi: 10.1038/379837a0. [DOI] [PubMed] [Google Scholar]
- 9.Tashiro A, Minden A, Yuste R. Regulation of dendritic spine morphology by the rho family of small GTPases: antagonistic roles of Rac and Rho. Cereb Cortex. 2000;10:927–938. doi: 10.1093/cercor/10.10.927. [DOI] [PubMed] [Google Scholar]
- 10.Hayashi-Takagi A, et al. Disrupted-in-Schizophrenia 1 (DISC1) regulates spines of the glutamate synapse via Rac1. Nature Neurosci. 2010;13:327–332. doi: 10.1038/nn.2487. [DOI] [PMC free article] [PubMed] [Google Scholar]
- 11.Hayashi-Takagi A, et al. PAKs inhibitors ameliorate schizophrenia-associated dendritic spine deterioration in vitro and in vivo during late adolescence. Proc Natl Acad Sci USA. 2014;111:6461–6466. doi: 10.1073/pnas.1321109111. [DOI] [PMC free article] [PubMed] [Google Scholar]
- 12.Wu YI, et al. A genetically encoded photoactivatable Rac controls the motility of living cells. Nature. 2009;461:104–108. doi: 10.1038/nature08241. [DOI] [PMC free article] [PubMed] [Google Scholar]
- 13.Redondo RL, Morris RG. Making memories last: the synaptic tagging and capture hypothesis. Nature Rev Neurosci. 2011;12:17–30. doi: 10.1038/nrn2963. [DOI] [PubMed] [Google Scholar]
- 14.Rogerson T, et al. Synaptic tagging during memory allocation. Nat Rev Neurosci. 2014;15:157–169. doi: 10.1038/nrn3667. [DOI] [PMC free article] [PubMed] [Google Scholar]
- 15.Arnold DB, Clapham DE. Molecular determinants for subcellular localization of PSD-95 with an interacting K+ channel. Neuron. 1999;23:149–157. doi: 10.1016/s0896-6273(00)80761-8. [DOI] [PubMed] [Google Scholar]
- 16.Kobayashi H, Yamamoto S, Maruo T, Murakami F. Identification of a cis-acting element required for dendritic targeting of activity-regulated cytoskeleton-associated protein mRNA. Eur J Neurosci. 2005;22:2977–2984. doi: 10.1111/j.1460-9568.2005.04508.x. [DOI] [PubMed] [Google Scholar]
- 17.Steward O, Wallace CS, Lyford GL, Worley PF. Synaptic activation causes the mRNA for the IEG Arc to localize selectively near activated postsynaptic sites on dendrites. Neuron. 1998;21:741–751. doi: 10.1016/s0896-6273(00)80591-7. [DOI] [PubMed] [Google Scholar]
- 18.Steward O, Worley PF. Selective targeting of newly synthesized Arc mRNA to active synapses requires NMDA receptor activation. Neuron. 2001;30:227–240. doi: 10.1016/s0896-6273(01)00275-6. [DOI] [PubMed] [Google Scholar]
- 19.Korb E, Finkbeiner S. Arc in synaptic plasticity: from gene to behavior. Trends Neurosci. 2011;34:591–598. doi: 10.1016/j.tins.2011.08.007. [DOI] [PMC free article] [PubMed] [Google Scholar]
- 20.Makino H, Malinow R. Compartmentalized versus global synaptic plasticity on dendrites controlled by experience. Neuron. 2011;72:1001–1011. doi: 10.1016/j.neuron.2011.09.036. [DOI] [PMC free article] [PubMed] [Google Scholar]
- 21.Zhang Y, et al. Visualization of NMDA receptor-dependent AMPA receptor synaptic plasticity in vivo. Nat Neurosci. 2015;18:402–407. doi: 10.1038/nn.3936. [DOI] [PMC free article] [PubMed] [Google Scholar]
- 22.Govindarajan A, Israely I, Huang SY, Tonegawa S. The dendritic branch is the preferred integrative unit for protein synthesis-dependent LTP. Neuron. 2011;69:132–146. doi: 10.1016/j.neuron.2010.12.008. [DOI] [PMC free article] [PubMed] [Google Scholar]
- 23.Tanaka J, et al. Protein synthesis and neurotrophin-dependent structural plasticity of single dendritic spines. Science. 2008;319:1683–1687. doi: 10.1126/science.1152864. [DOI] [PMC free article] [PubMed] [Google Scholar]
- 24.Harvey CD, Svoboda K. Locally dynamic synaptic learning rules in pyramidal neuron dendrites. Nature. 2007;450:1195–1200. doi: 10.1038/nature06416. [DOI] [PMC free article] [PubMed] [Google Scholar]
- 25.Colledge M, et al. Ubiquitination regulates PSD-95 degradation and AMPA receptor surface expression. Neuron. 2003;40:595–607. doi: 10.1016/s0896-6273(03)00687-1. [DOI] [PMC free article] [PubMed] [Google Scholar]
- 26.Ren M, et al. Arc regulates experience-dependent persistent firing patterns in frontal cortex. J Neurosci. 2014;34:6583–6595. doi: 10.1523/JNEUROSCI.0167-14.2014. [DOI] [PMC free article] [PubMed] [Google Scholar]
- 27.Kawashima T, et al. Synaptic activity-responsive element in the Arc/Arg3.1 promoter essential for synapse-to-nucleus signaling in activated neurons. Proc Natl Acad Sci USA. 2009;106:316–321. doi: 10.1073/pnas.0806518106. [DOI] [PMC free article] [PubMed] [Google Scholar]
- 28.Yu X, Zuo Y. Spine plasticity in the motor cortex. Curr Opin Neurobiol. 2011;21:169–174. doi: 10.1016/j.conb.2010.07.010. [DOI] [PMC free article] [PubMed] [Google Scholar]
- 29.Masamizu Y, et al. Two distinct layer-specific dynamics of cortical ensembles during learning of a motor task. Nat Neurosci. 2014;17:987–994. doi: 10.1038/nn.3739. [DOI] [PubMed] [Google Scholar]
- 30.Peters AJ, Chen SX, Komiyama T. Emergence of reproducible spatiotemporal activity during motor learning. Nature. 2014;510:263–267. doi: 10.1038/nature13235. [DOI] [PubMed] [Google Scholar]
- 31.Cichon J, Gan WB. Branch-specific dendritic Ca(2+) spikes cause persistent synaptic plasticity. Nature. 2015;520:180–185. doi: 10.1038/nature14251. [DOI] [PMC free article] [PubMed] [Google Scholar]
- 32.Hira R, et al. Transcranial optogenetic stimulation for functional mapping of the motor cortex. J Neurosci Methods. 2009;179:258–263. doi: 10.1016/j.jneumeth.2009.02.001. [DOI] [PubMed] [Google Scholar]
- 33.Yang G, Pan F, Gan WB. Stably maintained dendritic spines are associated with lifelong memories. Nature. 2009;462:920–924. doi: 10.1038/nature08577. [DOI] [PMC free article] [PubMed] [Google Scholar]
- 34.Fu M, Yu X, Lu J, Zuo Y. Repetitive motor learning induces coordinated formation of clustered dendritic spines in vivo. Nature. 2012;483:92–95. doi: 10.1038/nature10844. [DOI] [PMC free article] [PubMed] [Google Scholar]
- 35.Frey U, Morris RG. Synaptic tagging and long-term potentiation. Nature. 1997;385:533–536. doi: 10.1038/385533a0. [DOI] [PubMed] [Google Scholar]
- 36.Okada D, Ozawa F, Inokuchi K. Input-specific spine entry of soma-derived Vesl-1S protein conforms to synaptic tagging. Science. 2009;324:904–909. doi: 10.1126/science.1171498. [DOI] [PubMed] [Google Scholar]
- 37.Wang KH, et al. In vivo two-photon imaging reveals a role of arc in enhancing orientation specificity in visual cortex. Cell. 2006;126:389–402. doi: 10.1016/j.cell.2006.06.038. [DOI] [PubMed] [Google Scholar]
- 38.Schuz A, Palm G. Density of neurons and synapses in the cerebral cortex of the mouse. J Comp Neurol. 1989;286:442–455. doi: 10.1002/cne.902860404. [DOI] [PubMed] [Google Scholar]
- 39.Cauller L. Layer I of primary sensory neocortex: where top-down converges upon bottom-up. Behav Brain Res. 1995;71:163–170. doi: 10.1016/0166-4328(95)00032-1. [DOI] [PubMed] [Google Scholar]
- 40.Laubach M, Wessberg J, Nicolelis MA. Cortical ensemble activity increasingly predicts behaviour outcomes during learning of a motor task. Nature. 2000;405:567–571. doi: 10.1038/35014604. [DOI] [PubMed] [Google Scholar]
- 41.Xu NL, et al. Nonlinear dendritic integration of sensory and motor input during an active sensing task. Nature. 2012;492:247–251. doi: 10.1038/nature11601. [DOI] [PubMed] [Google Scholar]
- 42.Larkum ME, et al. Synaptic integration in tuft dendrites of layer 5 pyramidal neurons: a new unifying principle. Science. 2009;325:756–760. doi: 10.1126/science.1171958. [DOI] [PubMed] [Google Scholar]
- 43.Hira R, et al. Spatiotemporal dynamics of functional clusters of neurons in the mouse motor cortex during a voluntary movement. J Neurosci. 2013;33:1377–1390. doi: 10.1523/JNEUROSCI.2550-12.2013. [DOI] [PMC free article] [PubMed] [Google Scholar]
- 44.Andreassi C, Riccio A. To localize or not to localize: mRNA fate is in 3′UTR ends. Trends Cell Biol. 2009;19:465–474. doi: 10.1016/j.tcb.2009.06.001. [DOI] [PubMed] [Google Scholar]
- 45.Wang DO, Martin KC, Zukin RS. Spatially restricting gene expression by local translation at synapses. Trends Neurosci. 2010;33:173–182. doi: 10.1016/j.tins.2010.01.005. [DOI] [PMC free article] [PubMed] [Google Scholar]
- 46.Holt CE, Schuman EM. The central dogma decentralized: new perspectives on RNA function and local translation in neurons. Neuron. 2013;80:648–657. doi: 10.1016/j.neuron.2013.10.036. [DOI] [PMC free article] [PubMed] [Google Scholar]
- 47.Gray NW, Weimer RM, Bureau I, Svoboda K. Rapid redistribution of synaptic PSD-95 in the neocortex in vivo. PLoS Biol. 2006 doi: 10.1371/journal.pbio.0040370. [DOI] [PMC free article] [PubMed] [Google Scholar]
- 48.Bosch M, et al. Structural and molecular remodeling of dendritic spine substructures during long-term potentiation. Neuron. 2014;82:444–459. doi: 10.1016/j.neuron.2014.03.021. [DOI] [PMC free article] [PubMed] [Google Scholar]
- 49.Hsueh YP, Kim E, Sheng M. Disulfide-linked head-to-head multimerization in the mechanism of ion channel clustering by PSD-95. Neuron. 1997;18:803–814. doi: 10.1016/s0896-6273(00)80319-0. [DOI] [PubMed] [Google Scholar]
- 50.Kasai H, et al. Learning rules and persistence of dendritic spines. Eur J Neurosci. 2010;32:241–249. doi: 10.1111/j.1460-9568.2010.07344.x. [DOI] [PubMed] [Google Scholar]


