

Abstract
This chapter reviews our work from the past decade investigating cortical and striatal firing patterns in rats while they time intervals in the multi-seconds range. We have found that both cortical and striatal firing rates contain information that the rat can use to identify how much time has elapsed both from trial onset and from the onset of an active response state. I describe findings showing that the striatal neurons that are modulated by time are also modulated by overt behaviors, suggesting that time modulates the strength of motor coding in the striatum, rather than being represented as an abstract quantity in isolation. I also describe work showing that there are variety of temporally informative activity patterns in pre-motor neurons, and argue that the heterogeneity of these patterns can enhance an organism's temporal estimate. Finally, I describe recent behavioral work from my lab in which the simultaneous cueing of multiple durations leads to scalar temporal expectation at an intermediate time, providing strong support for a monotonic representation of time.
Keywords: Premotor Cortex, Cingulate Cortex, Striatum, Interval Timing, Rat, Behavior, Electrophysiology
Introduction
Timing and time perception in the seconds to minutes range, interval timing, is of fundamental importance for survival, being implicated as a necessary process for foraging (1, 2) and associative conditioning (3, 4), and it serves as the contextual framework through which behavior can efficiently map onto the external world. Despite the importance of this capacity, our understanding of the neural mechanisms through which temporal perception and control are achieved remains minimal. As such, the “Holy Grail” of the field is to identify the neural structures, activity patterns, and computational processes that serve as the “internal clock”. While this task will necessarily be achieved by triangulating across a range of methodologies, such as pharmacological manipulations (5-7), anatomic lesion studies (8-11), functional brain imaging (12-15), and genetic analyses (16, 17) , electrophysiological recordings in behaving animals are likely to be of foremost importance due to their capacity to provide exquisite temporal and spatial resolution of neural activity.
Recording single neuron activity in behaving non-human primates and relating this activity to cognitive processes has been occurring for nearly half a century (18, 19). In the vast majority of work carried out since then, the subjects are trained over the course of several months to remain motionless during a behavioral task in which a specific cognitive operation is being investigated. This approach developed due to concerns that overt behavioral changes could be used as a mediating “placeholder” for the cognitive operation under investigation. For example, in the frequently used delayed matching to sample task, a subject is briefly presented with a stimulus (e.g., a red cue light) and then after a short stimulus-free delay is asked to choose the corresponding stimulus when presented along with an alternative (i.e., choose the red, rather than green cue light). As the delay lengthens, the task requires working memory (as opposed to iconic memory), and alternate strategies might be utilized by the subject to improve performance. One such strategy would be a differential behavioral response in which the subject engages in a specific behavior during the delay (e.g., squeezing its hand following a red cue light), and then evaluates its behavioral state, rather than its working memory store, at test. Since such a strategy eliminates the working memory demands, thereby preventing the study from achieving its goals, these overt behaviors are eliminated during training by having the subject remain motionless, and requiring the subject to specify its decision with a highly stereotyped behavioral response (e.g., looking left or right) that can be recorded using electromyography (EMG) or electrooculography (EOG), to verify that the behavior is not being covertly executed. While it is important to keep in mind that other covert behaviors that are not being recorded could potentially be functioning in a similar vein, in general, these techniques have provided considerable evidence about the neural mechanisms underlying a number of cognitive processes (e.g., that neurons in prefrontal cortex are activated in a stimulus-specific manner during the delay, thereby suggesting an important role in working memory(20-22).
Not surprisingly, this restricted behavior strategy has also been extensively used in the non-human primate studies investigating the electrophysiological activity patterns underlying interval timing (23-31). While these studies have revealed a number of important findings, ethical and monetary considerations somewhat prohibit us from carrying out other important studies on non-human primates. For example, although showing that a certain neural structure has firing patterns that are consistent with it serving as an internal clock process is important, removing the structure to assess its necessity in timing is a critical next step. Furthermore, it would be quite useful to be able to evaluate how these neural firing patterns, and the corresponding temporal control of behavior, change in response to lesions of the region's input structures. Such studies can be more feasibly done in rodents. In addition, the vast majority of studies on interval timing behavior conducted over the last 3 decades have been done in rats and pigeons, and identifying the neural underpinnings of timing behavior in these species provides a necessary direct link to such work.
Neurophysiology of Timing in the Rat
For these reasons, a number of years ago, we began conducting ensemble electrophysiological studies on rats trained to respond in a temporally controlled manner for food reinforcement. In the spirit of this book serving as an educational resource, I will briefly reflect on my observations and thoughts from my initial forays into the electrophysiology of time in rats. While it may go without saying, the most important element in task design is to consider appropriate experimental control. Simply recording neural activity while a rat engages in a temporal production task (e.g., the peak-interval procedure - 32), does not provide sufficient leverage for identifying the mechanisms contributing to temporal perception. Obtaining peak-shaped neural activity may be evidence of an internal temporal representation that functions in a non-linear manner, computing similarity to previously reinforced neural “clock” states, or it may be that one is recording from an effector process, such as that used for generating the motor output to make the behavioral responses. As described above, the necessary approach is to shape the subject's behavior so that it differs from the obtained neural activity pattern. In this way, the neural pattern can potentially be interpreted as reflecting a central, cognitive operation, rather than the reflection of an input or output signal. In the non-human primate studies described above, by keeping the subject motionless, the dynamic evolution of neural activity cannot be directly related to behavior, which is essentially stationary.
Following a similar strategy, we initially thought that a temporal perception task, such as the duration discrimination task (33), would serve this function. In a duration discrimination task, the subject is exposed to a stimulus (e.g., a tone) for one of two different durations, after which it classifies the length of the duration by making a choice response. In contrast to a temporal production task in which the animal responds at times when it anticipates that food reinforcement is available, there is no need to respond during the to-be-timed interval. Instead, it can conserve energy by simply perceiving the duration of the stimulus, and then making a decision regarding stimulus length once the stimulus has terminated. However, a paper was published at roughly the time at which we were considering experimental designs that demonstrated that rats would utilize a behavioral strategy to facilitate their temporal decisions, such that they would position themselves in front of the “short” response lever early in the trial, and then switch to being in front of the “long” response lever in a probabilistic manner as a function of elapsed time (34). This behavioral sequencing strategy is in some ways similar to humans counting seconds to enhance their temporal precision (35, 36), in that the rats are using a mediating spatial sequencing strategy. We decided to make it more difficult for the rats to utilize this strategy by requiring them to hold down a central lever during the to-be-perceived interval, thereby preventing this sequential behavior approach. Remarkably, the rats simply suppressed their locomotor behavior without eliminating it completely. Specifically, they held down the central lever with their forelimbs, while probabilistically directing their rump toward the appropriate lever as a function of time. While we considered incorporating further behavioral restrictions to prevent such behavior, I began to believe that we ran a strong risk of simply blinding ourselves to the rat's behavioral strategies, rather than eliminating them. Indeed, a topic of discussion in the lab at this time was whether all electrophysiological studies suffer from the so-called “sphincter problem”, (i.e., whether an internal behavior exists that co-varies with the cognitive event being studied and is the source of the neural activity, but as we are unable to see this internal behavior, we conclude that it doesn't exist).
As a result, I decided it would be more profitable to allow our subjects to engage in whatever behaviors they wished to mediate time, and to record these freely emitted behaviors as they emerged in time. In this way, we would be able to identify periods of time in which the subject's behavior was stationary (e.g., a continuous bout of operant responding), thereby allowing us to examine the dynamics of neural activity that occurred during these behavioral states. These neural dynamics could then be interpreted in the same way that one would interpret neural activity obtained while the subject was in a motionless state. Moreover, this approach has several advantages in comparison to a motionless recording strategy. First, it dramatically minimizes the problem of covert behaviors contributing to the neural activity profiles because we are not training our subjects to suppress overt behaviors, thereby potentially facilitating the adoption of covert behavioral strategies. Second, the training time required to teach subjects to remain motionless is eliminated. Third and most importantly, we are allowing the subjects to generate temporally controlled behavior in an unconstrained manner, which provides the best approximation to the cognitive and behavioral strategies used in the real world.
Specifically, we adopted a matched behavior strategy (37) in which the same overt motor behaviors are elicited under different cognitive or motivational states, here different temporal expectations. In this manner, the neural activity associated with the operant behaviors can be “subtracted out”, and firing rate differences can be associated with the different temporal expectations. Specifically, we utilized a multiple duration peak-interval procedure. A peak-interval procedure is a variant of a discrete trials, fixed-interval schedule in which a to-be-timed stimulus commences and the first operant response (e.g., a lever press) after the criterion duration has elapsed (e.g., 10 sec) provides reinforcement and terminates the signal. Responses made prior to the criterion duration have no programmed consequence. In the peak procedure, a proportion of trials are non-reinforced probe trials in which the signal stays on for three to four times the criterion duration, before it terminates in a response-independent manner. The average response rate as a function of signal duration on these probe trials (the peak response function) rises gradually from a low operant rate at trial onset to a peak around the criterion time, and then returns in a nearly symmetrical manner to the baseline rate following the criterion duration. The time of maximal responding, the peak time, is used as a measure of the subject's temporal expectation of reinforcement, and the spread of responding is used as a measure of the subject's temporal precision. The response rate at the peak time, the peak rate, is used as a measure of motivation. When tested with multiple durations with equal payoff likelihoods, it is commonly found that the peak rate for a short duration (e.g., 10 seconds) is greater than the peak rate for a longer duration (e.g., 40 seconds), potentially reflecting a greater value of obtaining reward with a shorter delay(38). A hallmark of interval timing behavior is that it obeys the scalar property, or Weber's Law applied to temporal control (39-41). It is seen behaviorally in that the breadth of the peak function is proportional to the peak time. In other words, the peak spread when timing 10 seconds is four times smaller than the peak spread when timing 40 seconds. The scalar property is often graphically depicted by normalizing the peak functions as a function of peak rate and peak time, so that the resulting functions are plotted as a proportion of maximal rate on the ordinate, and a proportion of peak time on the abscissa. When this is done, the peak functions for different durations overlap, or superimpose, suggesting that the subject's decision to respond is based on a proportional similarity to the criterion duration, and is simply scaled for different durations.
At first glance, the differences in peak spread and peak rate for different durations appear to hinder the use of a matched behavior strategy, as the behavior is not identical across the different durations. However, these differences in behavior are an artifact of averaging across multiple trials, and this concern is mitigated when the subject's behavior is examined on the level of individual trials. Specifically, the behavior on single trials is well characterized by a sequence of three response rate states, a low-rate state in which the subject is not actively engaged in operant responding, a high-rate state in which the subject responds repeatedly on the operant manipulandum at a high rate, and then another low-rate state. While the low-rate states may be composed of a variety of behaviors (e.g., sitting quietly, grooming, general locomotor activity, checking the food magazine, occasional operant behavior, etc.), the high-rate state is composed of continuous operant behavior, emitted at a near constant rate. Importantly, the rate of responding during this high rate state does not tend to differ across durations. Rather, the differences in peak rate and peak spread seen in the mean functions are a result of increased variability in the start and stop times associated with the high rate state. I should note here that the claim that the high rate state is identical across all durations needs to be examined more closely in the future, perhaps utilizing the change point detection algorithm recently developed by Gallistel and colleagues (42, 43), as we have seen that the high rate state for long durations is sometimes composed of periods of high rate responding interspersed with brief visits to the food magazine, whereas these excursions are less common when responding for short durations (see also 44)). At any event, by selecting periods of time in which the operant behavior is emitted at equivalent high rates, the neural activity during these periods can be directly compared, and differences in neural activity can be ascribed to differences related to temporal expectancy or directly related variables such as value.
Over the past decade we have published several papers using this approach, and I will review our findings in this chapter. Matell, Meck (45) trained rats on a two-duration fixed-interval procedure to lever press for possible food reinforcement at 10s and 40s from signal onset (see Figure 1, Panel A). Briefly, onset of a tone signaled that the trial had begun. On some trials, the first response after 10s was reinforced and the trial was terminated. On other trials, the first response after 40s was reinforced, and the trial terminated. Subjects did not know which duration would pay off on each trial, and therefore began responding around 10s, and if this didn’t pay off, they paused responding, and then initiated responding again around 40s. Because of the probabilistic nature of reinforcement for the 10s duration (25%), but 100% reinforcement at 40s (if the trial wasn’t reinforced and terminated at 10s), response rates peaked at similar levels at 10s and 40s. A hallway and barrier were constructed around the response lever, so that the rats could only respond using their right forepaw, with their body directed away from the front wall, to more adequately match the behavioral state across durations. Single unit firing rates were recorded from the anterior dorsal striatum and the anterior cingulate cortex while the rats engaged in this task. The majority of the neurons in both areas showed firing rate fluctuations that peaked (or dipped) at the times of lever pressing activity, suggesting either a direct relationship with the motor activity of lever pressing which peaked at the criterion times, or with the associated expectation of reinforcement that motivated the lever pressing. More importantly, a modest proportion (~25%) of these neurons had different firing rates during a response window just prior to the 10s criterion compared to an equally wide response window just prior to the 40s criterion (see Figure 2). Close investigation of these response windows revealed that they were composed of a mix of behaviors, including lever pressing, food cup checking, and moving between these locations. As such, we restricted our analysis to the periods of time within these windows during which the rats were actively poking (i.e., a high response rate state), and we used the lever press topography (e.g., the press duration) as a covariate in our analysis. This analysis revealed that 22% of the striatal neurons and 15% of the anterior cingulate neurons had different firing rates during equivalent behavioral segments that occurred at different times. We interpreted these differential rates at the two intervals as indicating that these cells are sensitive to elapsed time.
Figure 1.
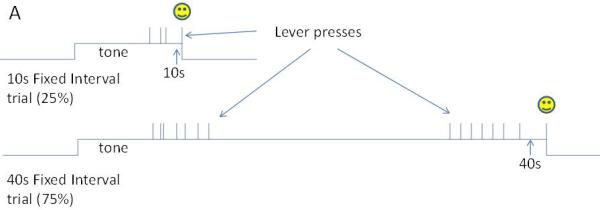

Graphical representation of the timing tasks discussed in this chapter, as well as the typical single trial behavioral pattern.
Panel A. In this two duration fixed-interval procedure, a tone commences signaling the start of a trial. On “short” trials (top), the first lever press after 10s earns reinforcement and terminates the signal. On “long” trials (bottom), the first lever press after 40s earns reinforcement and terminates the signal. There is no programmed consequence of responding prior to the criterion duration, and no signal is provided regarding which duration will be reinforced. As a result, the rats tend to respond around 10s, and if no reinforcement is received, pause for some time and then respond again around 40s.
Panel B. In this concurrent variable-interval/fixed-interval procedure, a tone commences signaling the start of the trial. On variable-interval trials (top), reinforcement is delivered with a low probability (e.g., 1%) for each moment that the rat's snout is in the left nosepoke. On fixed-interval trials (middle), reinforcement is delivered for the first response on the center nosepoke after 15s have elapsed since trial onset. On probe trials (bottom), no reinforcement is provided and the signal stays on for at least 40s. As no signal is provided to indicate trial type, the rats begins responding on the left, variable-interval, nosepoke, switches to responding on the center, fixed-interval, nosepoke as time approaches 15s, and then switches back to responding on the left nosepoke after 15s has passed.
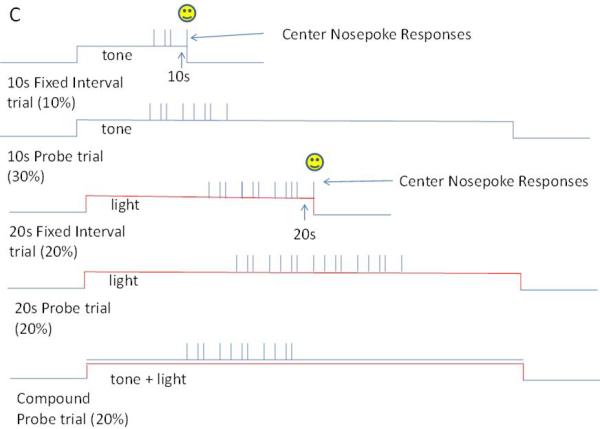
Panel C. In this two-modality, two-duration peak-interval procedure, a signal commences signaling trial onset. On 10s fixed-interval trials, a tone commences, and the first center nosepoke response after 10s is reinforced and the signal is terminated. On 20s fixed-interval trials, a light commences, and the first center nosepoke response after 20s is reinforced and the signal is terminated. A proportion of trials are probe trials in which either the tone or light commences and stays on for 3-4 times the associated fixed-interval duration, but no reinforcement is delivered and the stimulus terminates in a response-independent manner. Rats respond on these trials around the time that reinforcement is normally delivered. In addition, compound probe trials were presented in which the tone and light were simultaneously presented. On these trials, rats responded maximally at a time in-between the two fixed-interval durations.
Figure 2.
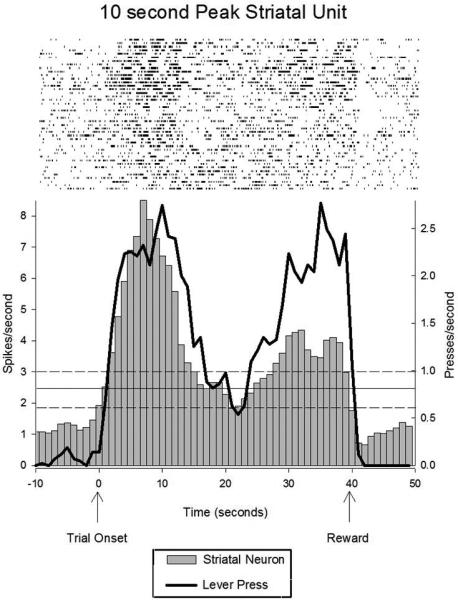
Peristimulus time raster and histogram displaying the activity pattern of a representative striatal neuron showing differential activity at two times associated with possible reinforcement (10 sec and 40 sec), thereby indicating the striatum's sensitivity to a specific temporal interval. The average firing rate of a striatal neuron is shown as a grey histogram, while the subject's lever pressing is shown as a black line. Importantly, the lever pressing rate was equivalent at these two times of reward, thereby ruling out a simple motor coding role of the firing rate differences in the striatal neuron. Figure from Matell,M.S. Meck, W.H., & Nicolelis, M.A., Interval timing and the encoding of signal duration by ensembles of cortical and striatal neurons. Behavioral Neuroscience, 117(4), 760-773, 2003, APA, adapted with permission.
These results are consistent with the postulates of the Striatal Beat Frequency Model (46, 47) that striatal neurons are integrating time-varying cortical activity patterns to generate a temporal expectation. Specifically, the Striatal Beat Frequency model proposed that a broad array of cortical neurons have sub-threshold oscillations in their membrane potentials, with different neurons having different underlying periodicities. These sub-threshold oscillations would result in a pattern of spiking that carries this oscillatory signature (i.e., a Fourier analysis would reveal maximal power at the neuron's oscillation frequency). The model proposes that the onset of a biologically relevant signal would synchronize the oscillatory phase of these neurons, but because of their different intrinsic periodicities, their firing should rapidly desynchronize. As a result, the dynamic pattern of activity across the cortex will evolve and could represent the amount of time elapsed from the synchronizing event. As individual striatal neurons receive input from 10,000-30,000 different cortical neurons (48), they are in a unique position to detect a specific constellation of cortical activity (49). We proposed that dopamine-mediated long-term potentiation would strengthen the synaptic weights of those neurons that were firing around the time of reinforcement, whereas long-term depression would dampen synaptic inputs that were uncorrelated with reward. As such, individual striatal neurons would be stimulated in proportion to the degree to which the current cortical activity pattern matched the pattern associated with previous reinforcement. When the amount of stimulation surpassed a threshold, the striatal neuron would fire, indicating that “time is up”. In this way, the dynamic evolution of cortical activity reflects the clock stage of an information processing account of timing, the cortico-striatal synaptic weights reflect the memory stage, and striatal activity reflects the decision stage. Intriguingly, the difference in firing rate across the two trained durations was consistently larger in the striatal neurons than the cortical neurons. This finding is consistent with the fact that striatal output through the basal ganglia feeds back to the cortex and merges with on-going cortical activity, which should cause the firing pattern of the cortical neurons to reflect a dampened version of the striatal decision stage output. On the other hand, we did not see any oscillatory activity in the cortical activity, which is inconsistent with the proposed clock process of the striatal beat frequency model. Furthermore, the model did not simulate the effects of feedback, so it remains unclear whether the model's ability to generate temporal expectancy would be helped or hindered by such striatal-thalamo-cortical feedback. Nevertheless, while the first issue is a bit of a thorn in the side of the model, the basic tenets of dynamic cortical activity being filtered by a synaptically based memory and read out by striatal neurons remains consistent with the data.
Motor Timing or Abstract Timing?
While the results of the study described above provided clear information that elapsed time modulates striatal activity, the results were ambiguous in regards to what aspect of temporal information was being represented. Take for example the neuron depicted in Figure 2, which was representative of the majority of temporally informative firing patterns. There is a prominent peak at 10s, and a secondary, smaller, rise to 40s. One possible coding scheme that is consistent with this pattern is what we can call “abstract temporal coding”. In this scheme, times of high spike activity correspond to times at which the rat expects food to be available, irrespective of the motor actions concurrently emitted by the rat. The difference in maximal firing rate at the two criterion times might reflect that the neuron is specifically tuned to the 10s duration, or it could reflect the increased precision of representing 10s compared to 40s (i.e., scalar timing), with both times being fully represented by the neuron. In this coding scheme, the temporal information contained in striatal firing rates would be passed to downstream structures that control motor behavior, thereby allowing temporally appropriate responding. This coding scheme can be contrasted with “temporal motor coding” in which the firing rate of the neuron partially reflects the motor behaviors being emitted. In this case, the firing fluctuations are a result of behavioral fluctuations (rather than the cause), and the neuron firing more at 10s than 40s would be due to a temporally informative signal generated either intrinsically or extrinsically (i.e., from another brain structure) and enhancing or diminishing the strength of the motor-related firing. To make this distinction clear, imagine that we were able to disrupt the rat's motor behavior, such that responding was occurring in a random manner across time, as shown in a graphical manner in Figure 3. In the “abstract temporal coding” scheme, the striatal neuron's firing rate would nevertheless continue to peak at the criterion time. In contrast, in the “temporal motor coding” scheme, the firing rate co-varies directly with the response pattern, while a temporally signal (shown in black) modulates the strength of the response-related activity.
Figure 3.
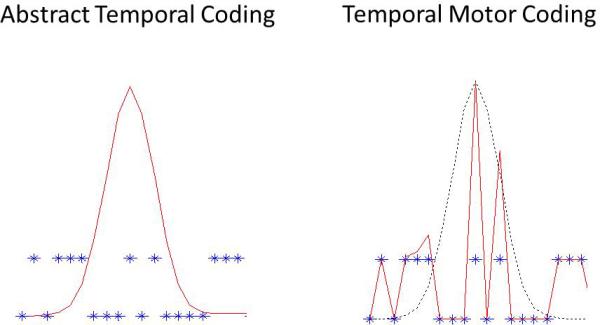
Graphical representation of two different mechanisms for temporal coding. The red lines in the figures show the firing pattern of a temporally sensitive striatal neuron, while the blue crosses indicate the concurrent behavior. In contrast to Figure 2, in which the behavior showed temporal control, thereby preventing a dissociation between motor and abstract timing, we have intentionally disrupted the behavior in this example so that it does not show temporal control. The figure on the left represents an “abstract temporal code” in which the neuron's firing rate peaks around the expected time of reinforcement. The behavior in this coding scheme is generated downstream from the striatum, such that although there is temporally informative activity in the striatal neuron, the behavior does not necessarily reflect this activity. In contrast, the figure on the top right represents temporal motor coding. In this case, the neuron's activity is driven by the behavior, but temporal information (represented here as the black dotted line) modulates the firing rate. Thus in this scheme, the behavior and time are represented in an integrated manner within the striatal neuron.
To investigate this issue, we wanted to conduct another experiment in which the rats would respond without a corresponding temporal expectation (e.g., comparing responding on a fixed-interval schedule with responding under a fixed-ratio schedule). However, this brings up a point of possible contention, namely whether a behavior can be executed without a corresponding temporal expectation. In other words, it seems possible that an organism might always know something about the average time until reward, even if elapsed time is not the contingent factor, as in a fixed-ratio schedule. If this is the case, then comparing across so-called timing versus non-timing conditions would be meaningless, as there are no non-timing conditions. Indeed, a recent theory of learning by Gallistel and Gibbon (3) proposed that all associative learning is based upon establishing the temporal relationships between events. Therefore, we opted to compare responding for a temporally predictable reward to responding for a temporally unpredictable (or at least much less predictable) reward. Specifically, we trained and tested rats on a discrete trials, probabilistic, concurrent variable-interval, fixed-interval reinforcement schedule (see Figure 1, panel B). In this procedure, all trials began with the onset of a tone. On some proportion of the trials (33%), responding at one nosepoke aperture (e.g., one on the left) would be reinforced on a 15s variable-interval schedule, meaning that reinforcement was “primed” at a constant low probability at each moment the rat had its snout in the nosepoke aperture. The probability was set so that a rat who simply held its nose in the left aperture would earn reinforcement on average after 15s, but the precise time at which reinforcement was delivered varied randomly across trials. Upon reinforcement, the trial ended. On other trials (33%), responding on the center nosepoke was reinforced on a 15s fixed-interval schedule, such that the first center response at or after 15s would be reinforced, and the trial would terminate. Additionally, in order to facilitate stable responding, if the rat was holding its snout in the center nosepoke aperture at the moment 15s elapsed, reinforcement was delivered (see 50). Finally, 33% of the trials were non-reinforced probe trials which lasted at least 40s and terminated independently of responding (51). No signal was provided to the rat to indicate what type of trial was in effect. Finally, aluminum hallways were constructed around the nosepoke apertures to prevent rapid switching between nosepokes and to minimize any postural differences across nosepokes or elapsed time.
Our goal here was to have the rats responding on the fixed-interval nosepoke around 15s, but responding at the temporally unpredictable variable-interval nosepoke at all other times. In this manner, motor behavior (i.e., nosepoking) would be emitted at a relatively constant rate across the entire trial, except for the times at which the rat switched from one nosepoke to the other. Figure 4 (top) shows the rat's likelihood of occupying the nosepoke, and the pattern of behavior on a representative single trial (Figure 4, bottom). As can be seen, the rat was either responding on the VI or FI nosepoke, or switching between the nosepokes. As such, we could compare the firing rates across time, as well as across different levels of temporal predictability of reward, while the nosepoking behavior was roughly constant. Further, because overt motor behaviors were most prominent during the transition periods when the rat switched nosepokes, we could address the temporal modulation versus abstract timing question described above. Specifically, if striatal activity represents time in an “abstract” manner, divorced from any motor behaviors required for reinforcement, then average firing rates should be characterized by ramp shaped or peak-shaped activity profiles over the entire trial, without abrupt changes in firing at the transition periods in which a broad array of motor behaviors are emitted (52). In contrast, if the striatal activity is dependent on motor activity, there should be abrupt changes in firing rates during the transition periods, above and beyond any modulation related to elapsed time.
Figure 4.
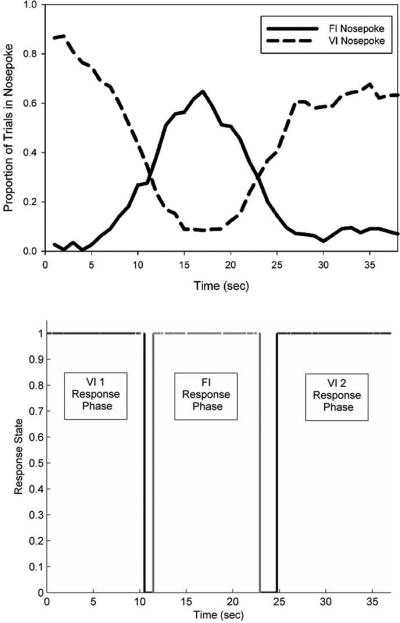
Session average and single trial behavior during a concurrent 15s variable-interval/fixed-interval procedure (see Figure 1B). The top panel shows the average proportion of time in which a representative rat had its snout within either the VI or FI nosepoke. As can be seen, FI responses peaked in a symmetrical manner around the criterion time of 15 sec, with VI responding occurring with high likelihood during all other times. The bottom panel shows VI (black lines) and FI (grey lines) nosepoke occupancy on an individual probe trial. As can be seen, the rat initially occupied the VI nosepoke, before switching to the FI nosepoke around the criterion FI time. After the FI duration had elapsed, the rat switched back to occupying the VI nosepoke. Note the short (~1-2 sec) periods of transition, during which the rat backed away from the nosepoke it was occupying, and approached the nosepoke it was about to occupy. Figure as originally published in Portugal, G. S., Wilson, A. G., & Matell, M. S. (2011). Behavioral sensitivity of temporally modulated striatal neurons. Front Integr Neurosci, 5, 30. doi: 10.3389/fnint.2011.00030
Our recordings demonstrated that 82% of the cells had different firing rates when comparing the same behavior (e.g., nosepoke holding) across different response phases (e.g., variable-interval responding compared to fixed-interval responding), thereby supporting the notion that striatal neurons are a major contributor to interval timing behavior as suggested by our (45), and others (8, 29, 53, 54) findings, as well as the Striatal Beat Frequency model (46). Intriguingly, some neurons had clear peak or ramp shaped activity profiles across the trial or within select phases of the trial (Figure 5) when we restricted the analysis to the periods of time in which the rat's snout was held within one or both nosepoke apertures (i.e., when it's behavior was controlled for). However, when we examined firing rates across the entire trial (i.e., including the transition periods - the periods of time in which the rat was moving between the fixed-interval and variable interval nosepokes), we almost always saw dramatic modulation of firing rates during these transition periods. Indeed, of those cells showing a difference in firing rate across the hold periods (55% of all cells), 91% of them showed significant modulation of firing rates during one or more of the transition periods as compared to both of the surrounding hold periods. For example, Figure 6 shows the average firing rates from several representative neurons during the nose-poking periods and during the transition periods. The nose-poking periods that were analyzed were restricted to the periods of time in which the rat was holding its snout within one of the nosepoke apertures. The transition periods are composed of two sub-periods: the first 200 msec after the rat left the nosepoke aperture at which it had been responding (e.g., the variable-interval nosepoke), and the last 200 msec before the rat entered the nosepoke aperture in which it would subsequently be responding (e.g., the fixed-interval nosepoke). Based on visual inspection of the rats’ behavior, these transition sub-periods were composed of either backing away from the nosepoke (the 1st sub-period), or locomoting toward the nosepoke (the 2nd sub-period). As can be seen, the firing rates during one or more of the transition behaviors are dramatically different than that found for the surrounding hold periods. Indeed, in most of the cases, the firing rates during the transition behaviors moved in the opposite direction from what would be expected from a neuron whose firing rates showed ramp or peak patterns. For example, in Figure 6a, the neuron showed a peak-like structure, firing on average at 4.8 spikes/sec while initially holding its snout in the variable-interval nosepoke, rising to 6.8 spikes/sec during the period of time in which it was holding its snout in the fixed-interval nosepoke, and dropping to 5.5 spikes/sec upon returning to the variable-interval nosepoke. However, when the rat was approaching the fixed-interval nosepoke, its firing rate was significantly below the firing rates of all of these hold-periods, which is incompatible with a peak shaped activity profile that is un-perturbed by motor activity. A similar situation is seen in Figure 6b, in which the firing rates during the hold periods grow in a monotonic manner across the three hold phases. If this neuron were solely coding time, irrespective of motor activity, one would expect the firing rates during the transition periods to be in-between the firing rates of the surrounding hold periods. In contrast, the firing rates during the transitions were both below (while the rat was backing away from the nosepokes) and above (while the rat was approaching the nosepokes), the surrounding hold period rates. As such, these data are clear in demonstrating that striatal neurons are not solely encoding time as an abstract entity. Instead, the passage of time appears to interact with their behaviorally-linked activity, thereby supporting the striatum representing time through temporally-modulated motor coding.
Figure 5.
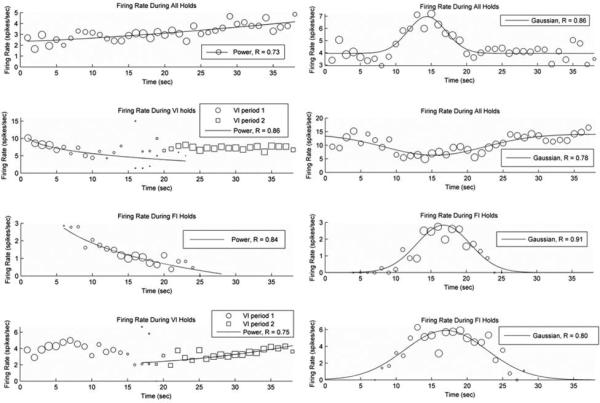
Examples of striatal neurons that exhibited monotonic ramp (left) or peak-shaped (right) changes in spike rate when in the process of holding their snout in the nosepoke (defined as continuous occupancy in the nosepoke aperture for at least 500 msec) as a function of elapsed time in the trial. Because nosepoke occupancy occurred at different times on different nosepokes across trials, the size of the data points reflect the number of trials contributing to each data point. Some neurons had firing rates that fluctuated in a systematic irrespective of the nosepoke aperture on which they were responding, whereas others showed these patterns only within certain phases (either on the FI nosepoke one/both of the VI nosepokes). The degree (fit) to which a power function (indicative of a ramp) or Gaussian function characterized the data is provided in each figure legend.
Figure 6.
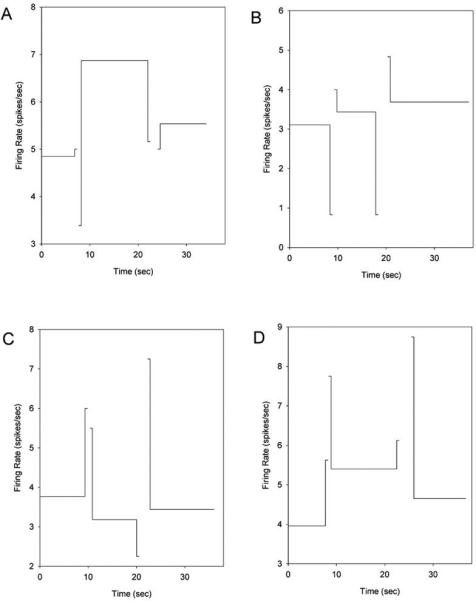
Mean firing rates during the phases of nosepoke occupancy and during the first 200 and last 200 msec of the transition period illustrated in Figure 4. The firing rate of each phase is plotted at the mean time at which these phases began and ended, but was computed with respect to each trial's actual transition times. Although the firing rates were not constant throughout the nosepoking phases (see Figure 5), the pattern of activity across the trial are inconsistent with a monotonic or peak-shaped firing pattern that develops irrespective of the co-occurring motor behaviors, thereby suggesting that the striatum is encoding both the time at which overt behaviors are executed, and the expected reward time or elapsed trial time (i.e., temporal motor coding). The four panels display four representative neurons, but 100% of task-modulated neurons had qualitatively similar patterns. To facilitate display, the duration of the transition segments is shown over 500 msec, rather than the 200 msec used for analysis. Figure as originally published in Portugal, G. S., Wilson, A. G., & Matell, M. S. (2011). Behavioral sensitivity of temporally modulated striatal neurons. Front Integr Neurosci, 5, 30. doi: 10.3389/fnint.2011.00030
A Variety of Temporally Informative Patterns
Given the lack of an abstract representation of time in the striatum, we therefore turned to the inputs of the striatum to attempt to locate the structure(s) that might represent the passage of time in a monotonic or unimodal manner, without the influence of co-occurring behaviors, as predicted by many psychological models. The majority of excitatory striatal inputs come from the cortex, with some additional inputs arising from the thalamus, as well as modulatory dopaminergic inputs from the substantia nigra pars compacta (55). Given work showing that the firing patterns of substantia nigra neurons relate to signal onset as well as trial outcomes (56-58), rather than showing across trial patterns of activity associated with elapsed time (although see 59), we felt that the search for a representation of elapsed time should be focused on the cortex. Of course, the cortex is a broad area, and despite the general topographic organization of cortico-striatal inputs, with motor cortical areas projecting to motor striatal areas, etc. (60), there is sufficient overlap in projections to keep the search open across all cortical areas. Related to this issue is the current question in the field regarding whether the timing system is centralized (and amodal) or localized to specific sensory systems (61-63). To the extent that the striatum is critically involved in timing, one might surmise that both situations may be simultaneously instantiated, as the majority of cortico-striatal inputs would remain largely segregated to specific sensory, motor, or association cortical channels (thus being sensory-specific), whereas the sparser overlap in projections could allow a limited degree of cross-modal interaction (thus being amodal).
In our initial work described above (45), we recorded from the anterior cingulate cortex, which makes up a substantial portion of the inputs to the dorsal lateral striatum that was recorded in the above studies. However, we found scant evidence of monotonic or peak-shaped (uni-modal) activity patterns. Based on evidence from other electrophysiological, functional imaging, and ERP studies (24, 28, 64-69), the premotor and supplementary motor cortices appeared as likely areas to provide a temporal signal. As such, in collaboration with Eric Shea-Brown and others (70), we decided to record from the medial agranular cortex, which has been suggested to be the rodent homologue of premotor cortex (71, 72). In this study, we continued to use a matched behavior design, a two-modality, two-duration peak procedure, such that the same response nosepoke and nosepoke requirements were used to earn reward for two different durations (i.e., 10s and 20s), with two different discriminative stimuli (i.e., tone and light) signaling which duration to time (see Figure 1, Panel C). To equate response strength across the two durations, the 10s cue was reinforced on 25% of trials in which it occurred, with the other 75% of its trials being non-reinforced probe trials lasting three to four times the criterion duration, whereas the 20s cue was reinforced on 50% of the trials on which is occurred, and the other 50% of its trials being non-reinforced probes. In addition, non-reinforced stimulus compound trials were presented in which both the 10s and 20s cues were presented simultaneously.
As shown in Figure 7, peristimulus time histograms showed a range of patterns across time and trial type, with roughly half of the neurons (46%) having significant fluctuations in rate as a function of time in the trial. Of these task sensitive neurons, 59% had peak shaped activations, whereas 21 % were ramp-like on at least one of the trial types. Intriguingly, only 4 cells out of the 155 recorded (e.g., Fig 7, top) showed the same pattern of activation across all trials types. Thus, it appears unlikely that neurons representing a purely abstract temporal signal that operates across modalities and behavioral domains are contained within this structure. However, as there is no reason to require the same neurons to provide a temporal signal for all scenarios, and as a substantial proportion of neurons showed patterns of activity across the trial that could provide an effective clock signal that maps onto time, we felt these data deserved further examination. As with the studies above, because these subjects were freely behaving, the possibility remained that the activity patterns shown in Figure 7 might be related to overt motor activity and not directly associated with the passage of time.
Figure 7.
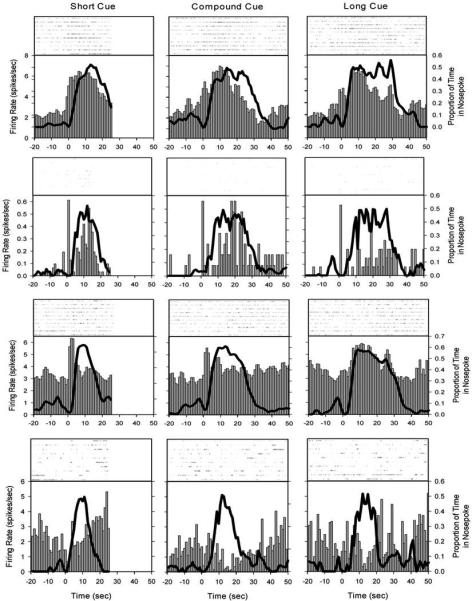
Perievent rasters and histograms from representative neurons on a two-modality, two-duration peak procedure (see Figure 1C). Each row displays a different neuron, and each column corresponds to the short (10s) cue (left), the simultaneous compound cue (middle), and the long (20s) cue (right). The thick black line shows the relative occupancy of the rat's snout in the nosepoke. Notice the dynamics of firing rates across neurons, time within a trial type, and across trial types. Figure from Matell,M.S. Shea-Brown, E., Gooch, C., Wilson, A.G., & Rinzel, J., A heterogeneous population code for elapsed time in rat medial agranular cortex. Behavioral Neuroscience. 125(1), 54-73, APA, with permission.
Indeed, the behavior of the rats in this procedure was similar to what is seen in a single duration peak-interval procedure, where the rate of operant responding is very low at the beginning of the trial, abruptly switches to a high rate sometime before the criterion duration has elapsed, and then abruptly returns to a low rate sometime after the criterion duration has passed (73). In the current experiment, we captured this state of temporally controlled, goal-directed, responding by plotting the occupancy (i.e., in or out) of the rat's snout in the nosepoke as a function of time in the trial, and then exhaustively fitting all possible “out-in-out” step functions until the deviation between the data and the step function was minimized. We saw that the rat's snout occupied the nosepoke less than 10% of the time during the obtained “Out” states, whereas it was within the nosepoke more than 60% of the time during the obtained “In” state. We then restricted our analysis of the firing patterns to those periods of time in which the rats were in the “In” state, so that the temporal evolution of overt motor behaviors across the trial could not account for the fluctuations in firing rate. Figure 8 shows the firing rates of a representative sample of neurons as a function of time during this “In” state, as well as the rat's occupancy of the nosepoke. Because the length of the “In” state varied across both trials and trial types, we plotted these PSTHs using a relative measure of time, the proportion of the “In” state period. As can be seen, nosepoke occupancy during the “In” state was not constant, but fluctuated to some degree as a function of time. Therefore, to further account for this non-stationarity of the rat's behavior, we used the nosepoke occupancy as a covariate when analyzing the firing rate fluctuations across time. In this way, fluctuations in firing rate that are related to fluctuations in occupancy can be “subtracted out”.
Figure 8.
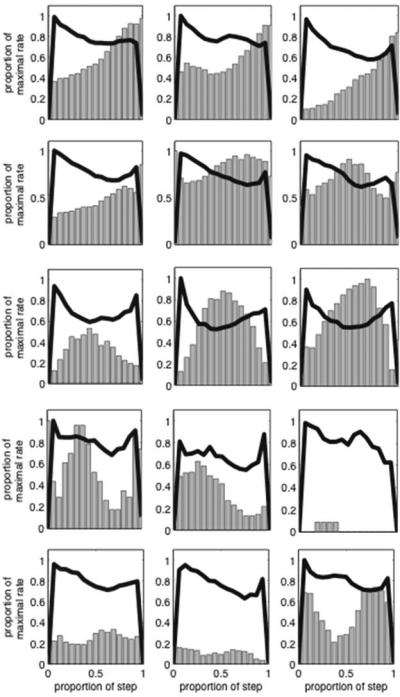
Heterogeneous patterns of firing rate changes in medial agranular cortex neurons during the high nosepoke occupancy “In” state, on probe trials in the mixed 10s/20s peak procedure Different neurons are shown on different rows, and different trial types are shown in different columns, as in Figure 7. To account for trial by trial variability in the length of the “In” state, the figures are binned using varying bin widths, that are 1/15 the width of the “In” state on each trial. Firing rates are shown as vertical bars, and occupancy in the nosepoke aperture is plotted as a thick black line. Firing rates and nosepoke occupancy within the “In” state have been smoothed with a 5-s running mean for presentation and were normalized by the maximum rate across trial types. The lack of stationarity in nose-poke occupancy was accounted for by using the time-varying occupancy as a covariate in the quantitative analysis. Figure from Matell,M.S. Shea-Brown, E., Gooch, C., Wilson, A.G., & Rinzel, J., A heterogeneous population code for elapsed time in rat medial agranular cortex. Behavioral Neuroscience. 125(1), 54-73, APA, with permission.
Our primary goal here was to ascertain the shape of the firing (i.e., whether it was peak or ramp shaped), as well to assess whether the firing rate on an individual trial was reliable enough for an ideal observer to discriminate elapsed time. To do this, we utilized linear discriminant analysis (LDA), which allows one to ask whether a dataset, when split into two (or more) categories, has sufficient separation in their measured statistics, here spike rates, to be reliably segregated (74). Given the limited number of trials available before the subjects became satiated, we asked the simplest question possible: whether the pattern of firing provided sufficient information to predict whether the rat was in the first or second half of the “In” state. The assumption here is that the rat begins responding some time before it expects to get food, but doesn’t stop responding until it is sure that food is not available (e.g., onset of “in state at 7s, expectation of food at 10s, end of “In” state at 13s). We are then asking whether the pattern of activity from 7s to 10s (i.e., early half of the “In” state) is different from the pattern of activity from 10s to 13s (i.e., late half of the “In” state). A graphical example of the approach is shown in Figure 9, and described here. To assess whether either the rate of firing, and/or pattern of firing, of a hypothetical neuron is different between the early and late halves of the “in state”, we split each half period into 2 bins (i.e., early bin 1, early bin 2, late bin 1, and late bin 2). We then plot a point (here in blue) specifying the firing rate during the first half of the “In” state from a single trial on a Cartesian plane, with the firing rate in early bin 1 specifying distance along the X-axis, and the firing rate in early bin 2 specifying distance along the Y-axis. The firing rate of this hypothetical neuron during the second half of the trial is plotted in a similar manner, but with a different symbol (here in red). For example, imagine on trial 1, the firing rate during the “In” state progresses as follows [spike rate = 3,5,8,12 spikes/sec for early bin 1, early bin 2, late bin 1, late bin 2, respectively]. The point in blue at (3,5) and the point in red at (8,12) represent this trial. From these two points, one can see that the neuron monotonically increased its firing rate from the 1st to the 4th bin (i.e., ramped). In comparison, if the two points on a single trial were at (5,10) and (9,6), the firing rates would be construed as peaking. A line that connects these dots specifies what is referred to as the feature dimension in which the difference between categories (early versus late) is maximal. By crossing this feature line with a perpendicular “boundary” line at the midpoint, one could then evaluate in a subsequent trial, whether the current firing rate is more similar to the early half or the late half of the first trial, simply by asking which side of the line it falls on. For example, if you observed that the spike rate was 4 spikes/sec in the first bin of time you watched the neuron and 6 in the second bin of time, you should predict that you are in the early half of the “In” state. Instead of doing this for one trial, LDA allows one to do this for all of the trials, such that the feature line identifies the dimension over which the clusters of blue and red are maximally separated based on their means as well as their variances. Finally, because we were interested in evaluating how reliable single neuron firing was at providing this information, we utilized the standard approach of leave-one-out cross validation, which computes the feature and boundary line based upon all trials but one, and then asks whether the remaining data point is classified correctly. This process is reiterated, such that every trial is assessed using the features and boundaries from all other trials, and the overall percent correct is compared to chance (using a standard binomial test with n trials).
Figure 9.
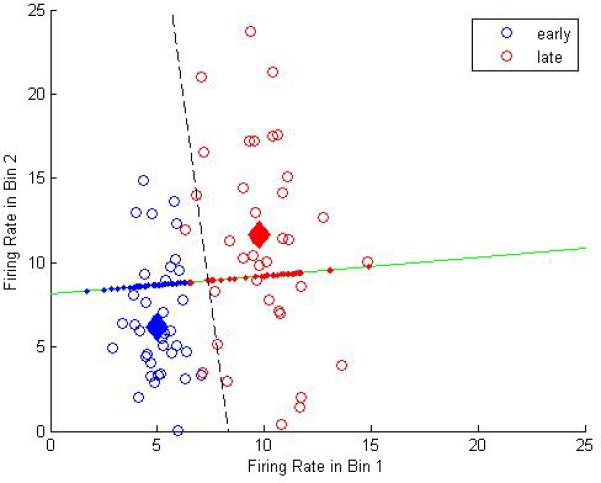
A graphical example showing the optimal feature and boundary line separating the firing rates of a hypothetical neuron that increases in rate the across the “In” state. The “In” state is split into 2 halves (early versus late), and each half is split again (Bin 1 and Bin 2). The firing rate during these bins is plotted as a point in 2-d space. These points are plotted for each trial, and in separate colors for the early and late halves of the “In” state. The means of these points are plotted as filled diamonds. The feature direction that optimally separates these clusters of points is plotted in green (as identified by linear discriminant analysis). The data points are “projected” in an orthoganol direction onto the feature line, and the boundary by which the two clusters of points are maximally separated is plotted as a dashed line. Notice that due to greater variability during Bin 2 in both the early and late halves of the “In” state, the best discriminability is not along the dimension that goes through the cluster means, but that the optimal feature is one that utilizes the Bin 1 rates more heavily than the Bin 2 rates.
This analysis revealed that 55% of the recorded neurons provided information that could be used by an ideal observer to reliably discriminate whether the rat was in the early or late half of the “In” state. The trial types on which a particular neuron provided information differed, with 34% of the neurons providing information on short trials, 25% on long trials, and 39% on compound trials. Only 10% of neurons could reliably discriminate time on all three trial types when each trial type was examined individually. On the other hand, when the same analysis was performed after pooling across trials, thereby increasing power, but also requiring the neural activity pattern to transcend trial type specific activity, we found that 43% of the neurons provided reliable information regarding relative time in the “In” state. Intriguingly, when we examined the firing patterns that provided this information, we found a roughly equal distribution of all possible patterns that could be described by 4 bins (i.e., positive and negative ramp patterns as well as positive and negative peak patterns). Similar variation of patterns was seen for all trial types. To more thoroughly explore this variability in firing patterns, we simplified our description of the pattern by re-binning the data into 3 bins, rather than 4, such that a monotonic increase or decrease represented a ramp pattern, while a non-monotonic pattern of activity across the 3 bins represented a peak or dip. We then graphically characterized the shape of firing as a vector in Cartesian space, by plotting the relative change in rate from bin 1 to bin 2 on the abscissa and the relative change in rate from bin 2 to bin 3 on the ordinate. In such a plot, lines falling in quadrants 1 and 3 indicate positive and negative ramping, respectively, with the slopes indicating the degree and direction of non-linearity. Similarly, lines falling in quadrants 2 and 4 indicate peak or valley shaped firing, respectively, with the slopes indicating the degree and direction of skew. As shown in Figure 10, there were not only a variety of firing patterns in terms of ramps versus peaks, but also in terms of the non-linearities and asymmetries.
Figure 10.
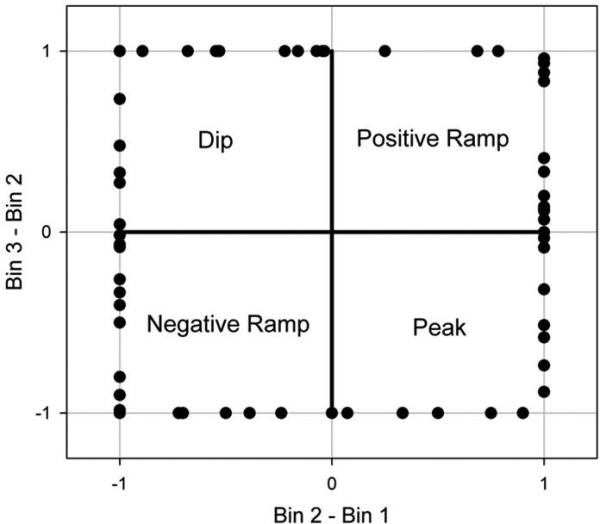
Shapes of the firing rate patterns in neurons whose rates differed across the “In” state defined by 3 relative duration bins, irrespective of trial type. The abscissa provides the change in rate from Bin 1 to Bin 2, while the ordinate provides the change in rate from Bin 2 to Bin 3. The rate changes were normalized by the maximum change, such that all points fall along the unit square. Points in quadrants 1-4 correspond to a positive ramp, a peak, a negative ramp and a dip, respectively. Figure from Matell,M.S. Shea-Brown, E., Gooch, C., Wilson, A.G., & Rinzel, J., A heterogeneous population code for elapsed time in rat medial agranular cortex. Behavioral Neuroscience. 125(1), 54-73, APA, with permission.
Surprised by this variety of temporally informative firing patterns, we asked whether such a scenario provided some benefit to the organism. Specifically, we compared the errors in temporal estimation produced by a model that relates spike counts to elapsed time. We first considered a hypothetical population of ramping cells with Poisson noise, and found that the estimation error was minimized when the rate of ramping was maximally steep (under constraints of maximal firing rates of 40 Hz). This outcome results from the fact that the steeper the slope, the larger the change in spike counts per unit of time, thereby providing maximal discriminability across time. Additionally, the relative rate change is maximal at low firing rates, so sensitivity is greatest at the beginning of the trial for a positively ramping cell, and the end of a trial for a negatively ramping cell. The next model we considered was composed of neurons which peaked or dipped rather than ramped. This model provided a 27% improvement over the ramping models, due to the maximal firing rate changes occurring over a smaller window of time (i.e., the slope of the ramp is steeper as the change in rate occurs from trial start to the peak time, rather than to trial end), and essentially equivalent performance for peaks and dips. Finally, we considered a model in which the population was constructed of a mixture of peaks, dips, and ramps, and in which the peaks/dips could be maximal/minimal at different times across neurons. This heterogeneous model improved the estimation error of the homogeneous peak/dip case by an additional 13%. The basis for this further improvement resulted from the minimal firing rates occurring at different times (i.e., the dips hit zero spikes/sec at different times for different neurons). As stated above, the relative change in firing rate for a given slope is maximal when the firing rate is minimal, so by having the maximum relative change at a variety of temporal locations, timing is maximally precise at each point in time.
These findings suggest that animals have access to neurons with a variety of different firing patterns which could be used to estimate elapsed time, and if accessed as an ensemble, could enhance perceptual sensitivity. It should, of course, be noted that the availability of these patterns in no way implies that these patterns or neurons are actually used by the animal to control behavior in time. Such limits for interpretation are true for every recording experiment, as they are simply correlational. Nevertheless, the fact that we found that so many different patterns co-vary in a reliable manner as a function of time serves as a bit of a cautionary note for further study. Indeed, due to the relatively small number of trials, and to prevent over-fitting in the LDA, we used the smallest number of bins (i.e., 4) that could provide a time-varying pattern of activity, which in turn means we had the lowest resolution for identifying temporal dynamics. Thus, the neural firing patterns that are actually available to the animal could be considerably more complicated than this, and our theories may not be sufficiently advanced to provide incentive to look for such patterns. Indeed, while a number of studies have found or suggested ramp-like activity during timed or delay intervals (22, 25-27, 69, 75-77), one must be prudent in identifying the degree to which other patterns may have been present but unreported and unexplored due to biases resulting from the analytic technique used.
Temporal Memory Averaging
In the above experiment, we occasionally presented the rat with compound probe trials in which both the “short” cue that signaled reinforcement might be available after 10s and the ”long” cue that signaled that reinforcement might be available after 20s were presented simultaneously, and no reinforcement was provided. We added these compound probe trials in order to verify that the differential firing patterns seen across trials were not simply the result of different sensory stimuli being concurrently present. Indeed, we found that approximately half the neurons (35/75) that fired with a different pattern during the “In” state on short versus long trials, also had reliably different patterns on the compound trials as compared to both of the component, single cue, trials. In other words, similar to the differences in firing seen across time within a trial, these neurons had reliably different patterns across trial types that were not related to the presence or absence of a sensory stimulus. As such, these data further support the notion that premotor neurons are sensitive to the amount of time that has elapsed in the trial.
When we designed this task, we anticipated that the rats would adopt a “cover the bases” response strategy on these compound trials, initiating responding as though reinforcement might be earned after the short duration elapsed, and continuing to respond until the long duration elapsed. Unexpectedly, we found that the rats’ behavior on these compound trials peaked at a time in between the peak times of the component trials, and furthermore, that the peak function was scalar. Given the remarkable nature of this finding, and out of concern that the electrode implant surgery or recording cables might have somehow contributed to the effect, we reran the experiment in naïve rats that were not implanted with electrodes (78). As shown in Figure 11, we again found scalar responding at a time (16s) in between the component peak times of 10s and 20s. Importantly, the fact that responding was scalar is not consistent with a scenario in which the rats respond to both of the cues in an independent manner. Rather, we interpreted these data as indicating that the presentation of each component cue led to the retrieval of the appropriate temporal memory, and due to the presumed discrepancy in when reward is judged to be available, the subjects averaged or integrations these temporal memories and timed this average expectation in an otherwise normal manner.
Figure 11.
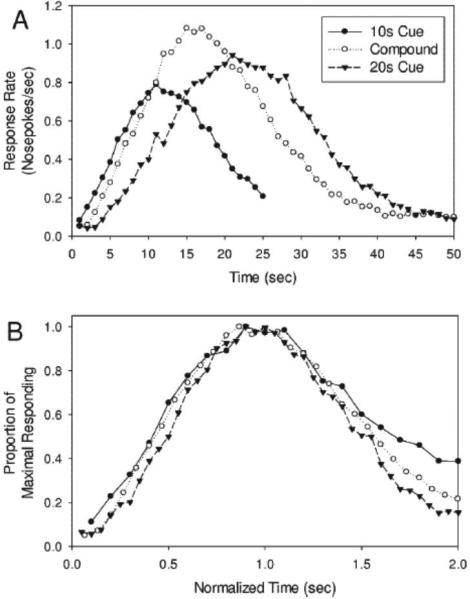
Normal, peak-shaped, scalar responding at a time in between the trained criterion times when tested with the stimulus compound. Rats were trained that one modal stimulus (e.g., a tone) predicted probabilistic food availability (25% of tone trials) at 10s, whereas a different modal stimulus (e.g., a light) predicted probabilistic food availability (50% of light trials) at 20s. The different probabilities of reinforcement led to equivalent peak rates on the component stimuli probe trials as shown (Top). Presentation of the stimulus compound (tone+light) led to responding that peaked in between the criterion times. These compound trials were never reinforced. The bottom panel shows the superimposition of component and compound responding after normalizing the response functions by the obtained peak times, thereby indicating that the compound response was scalar. Such a result strongly suggests normal timing processes operating on an average temporal expectation. Figure from Swanton, D.N., Gooch, C.M, & Matell,M.S. . Averaging of temporal memories by rats. Journal of Experimental Psychology: Animal Behavior Processes, 35(3), 434-439, 2009, APA, with permission.
Subsequent studies (79, 80) have demonstrated that this temporal memory averaging occurs across a range of component durations and duration ratios, indicating that this is not a one-shot phenomenon related to a specific set of durations. Intriguingly, this scalar averaging is only seen when the reinforcement densities of the component cues are approximately equal (i.e., when an increased probability of reinforcement for the long duration offsets the diminished subjective value associated with the longer delay (81). Furthermore, across 5 different studies, the time of peak responding on compound trials could be accurately predicted by an average of the component peak times, but only when each time was weighted by its relative probability of reinforcement. Together, these data suggest a tight link between value and time, and suggest that future recording studies will profit from examining these factors simultaneously (see 44).
While my lab is actively investigating the boundary conditions and moderating factors associated with temporal memory averaging, the phenomenon itself provides important constraints on the possible mechanisms underlying interval timing. Specifically, it is very difficult to explain temporal memory averaging in the context of a network-state based timing model, such as the instantiation of SBF described above (46). This difficulty results from the fact that different times in these models are associated with different states of the network (i.e., patterns of neural activity), but these states do not evolve in a monotonic manner as a function of time (i.e., there is nothing “bigger” about a complex ensemble firing pattern associated with 20s as compared to 10s). As such, the network states that correspond to times in between the component durations are not in any obvious manner “in between” the network states associated with the component durations themselves. In contrast, monotonic clock models, such as Scalar Expectancy Theory (39), the Multiple Timescales model (82), or the Drift-Diffusion timing model (75), have neural activity patterns that grow or decay in a monotonic manner, and an average of component memories, whether they are instantiated as thresholds or clock speeds, would result in maximal responding at a time that falls in between the component peak times. Of course, the ability of these monotonic models to deal with the finer complexities of this phenomenon, such as the weighted averaging and modality-associated asymmetries remains to be seen. Dealing with such issues may require refinement of these models.
The phenomenon of temporal memory averaging may also be helpful in clarifying the functions of neurons that are found to co-vary with time in electrophysiological recording studies. Presumably, the first explanation considered by neuroscientists finding neurons with temporally-informative activity patterns, is that these neurons are used as the basis for temporal perception. However, during a perusal of the numerous posters reporting on electrophysiological investigations on interval timing at the 2012 Society for Neuroscience Annual Meeting, a colleague remarked to me that he wondered whether there were any areas that didn’t show co-variation of neural activity with time. While some of us believe that “Timing is everything,” it is somewhat hard to imagine that every area of the brain is contributing in a direct manner to the temporal control of behavior. Instead, these neurons are likely involved in other facets of behavior, but are nevertheless influenced by temporal factors, perhaps via a temporally informative input signal. For example, as described earlier, we showed that neurons in the anterior cingulate cortex had firing rates that co-varied with time (45). However, current theories of this brain area ascribe its function to one of error detection (83). Such error related processing might be expected to co-vary in intensity as a function of time between expected and obtained outcomes similar to that seen in the activity of dopamine neurons (57), but such temporally varying error signals need not be the source of the subject's temporal perception. Similarly, Shuler and Bear (84) have demonstrated that primary visual cortex neurons have firing rates that peak at the time that reinforcement is typically provided, thereby providing a temporally informative signal. While this is a fascinating finding given the “low-level” sensory functionality classically ascribed to this cortical area, it remains to be seen whether such activity is generated within this structure, or whether it is provided by another area. Similarly, it remains to be seen whether this activity is responsible for the temporally specific overt behaviors produced by the subject (i.e., licking at the spout at the right time), or whether it instead functions to temporally moderate processing of visual inputs. As such, examining the activity of temporally varying neurons in novel and/or conflicting situations, such as that produced by a stimulus compound, may help us to identify how and where different components of the system (clock, memory, decision, output) are integrated. For example, if one recorded from visual, auditory and motor areas in rats while presenting them with stimulus compounds, one might see activity in sensory-specific areas that represent the component expectations, but activity in motor areas that represent the integrated expectations.
Summary
The work presented here supports the idea that cortical and striatal neurons are modulated by the temporal relationships between external events and may temporally modulate the animal's behavior to deal with these contingencies. The involvement of an array of cortical and sub-cortical areas in timing and time perceptions has also been demonstrated recently by other investigators using electrophysiological techniques in behaving animals (see the preceding chapters, as well as 24, 28-30, 85, 86, 87). While this body of work shows that a number of structures have firing patterns that provide an index of elapsed time, whether a “pure” temporal signals exist anywhere in the brain remains to be seen, and will require the adoption of experimental designs that go beyond simply searching for neurons that co-vary with time in stationary subjects. We have also shown that a variety of temporally informative firing patterns are simultaneously present, and that this variation in patterns may facilitate temporal expectations. As such, I believe that we need to be open to the possibility that complex neural activity patterns may contribute to temporal expectations. Indeed, recent work has demonstrated temporal information encoded in complex network states (88, 89), as well in the temporal specific activity of tuned “time cells” in the hippocampus (90) and premotor cortex(91). Nevertheless, as we have found that the cueing retrieval of multiple discrepant temporal memories can lead to temporal memory integration, monotonic coding of time such as that obtained with ramp and decay patterns, seems likely to be a critical component(22, 75). With all of these outstanding questions, I think it is clear that this is an exciting time to be studying timing.
References
- 1.Henderson J, Hurly TA, Bateson M, Healy SD. Timing in free-living rufous hummingbirds, Selasphorus rufus. Curr Biol. 2006;16(5):512–5. doi: 10.1016/j.cub.2006.01.054. [DOI] [PubMed] [Google Scholar]
- 2.Bateson M. Currencies for decision making: the foraging starling as a model animal [D. Phil.] Oxford; Oxford: 1993. [Google Scholar]
- 3.Gallistel CR, Gibbon J. Time, rate, and conditioning. Psychological review. 2000;107(2):289–344. doi: 10.1037/0033-295x.107.2.289. [DOI] [PubMed] [Google Scholar]
- 4.Miller RR, Barnet RC. The role of time in elementary associations. Current Directions in Psychological Science. 1993;2(4):106–11. [Google Scholar]
- 5.Meck WH. Selective adjustment of the speed of internal clock and memory processes. Journal of Experimental Psychology: Animal Behavior Processes. 1983;9(2):171–201. [PubMed] [Google Scholar]
- 6.Matell MS, Bateson M, Meck WH. Single-trials analyses demonstrate that increases in clock speed contribute to the methamphetamine-induced horizontal shifts in peak-interval timing functions. Psychopharmacology (Berl) 2006;188(2):201–12. doi: 10.1007/s00213-006-0489-x. Epub 2006/08/29. [DOI] [PubMed] [Google Scholar]
- 7.Buhusi CV, Meck WH. Differential effects of methamphetamine and haloperidol on the control of an internal clock. Behav Neurosci. 2002;116(2):291–7. doi: 10.1037//0735-7044.116.2.291. [DOI] [PubMed] [Google Scholar]
- 8.Meck WH. Neuroanatomical localization of an internal clock: A functional link between mesolimbic, nigrostriatal, and mesocortical dopaminergic systems. Brain Res. 2006 doi: 10.1016/j.brainres.2006.06.031. [DOI] [PubMed] [Google Scholar]
- 9.Galtress T, Kirkpatrick K. The role of the nucleus accumbens core in impulsive choice, timing, and reward processing. Behav Neurosci. 2010;124(1):26–43. doi: 10.1037/a0018464. Epub 2010/02/10. [DOI] [PMC free article] [PubMed] [Google Scholar]
- 10.Harrington DL, Haaland KY. Neural underpinnings of temporal processing: a review of focal lesion, pharmacological, and functional imaging research. Rev Neurosci. 1999;10(2):91–116. doi: 10.1515/revneuro.1999.10.2.91. [DOI] [PubMed] [Google Scholar]
- 11.Gooch CM, Wiener M, Hamilton AC, Coslett HB. Temporal discrimination of sub- and suprasecond time intervals: a voxel-based lesion mapping analysis. Front Integr Neurosci. 2011;5:59. doi: 10.3389/fnint.2011.00059. Epub 2011/10/21. [DOI] [PMC free article] [PubMed] [Google Scholar]
- 12.Coull JT. fMRI studies of temporal attention: allocating attention within, or towards, time. Brain Res Cogn Brain Res. 2004;21(2):216–26. doi: 10.1016/j.cogbrainres.2004.02.011. [DOI] [PubMed] [Google Scholar]
- 13.Ferrandez AM, Hugueville L, Lehericy S, Poline JB, Marsault C, Pouthas V. Basal ganglia and supplementary motor area subtend duration perception: an fMRI study. Neuroimage. 2003;19(4):1532–44. doi: 10.1016/s1053-8119(03)00159-9. [DOI] [PubMed] [Google Scholar]
- 14.Lewis PA, Miall RC. Brain activation patterns during measurement of sub- and supra-second intervals. Neuropsychologia. 2003;41(12):1583–92. doi: 10.1016/s0028-3932(03)00118-0. [DOI] [PubMed] [Google Scholar]
- 15.Wiener M, Turkeltaub P, Coslett HB. The image of time: a voxel-wise meta-analysis. Neuroimage. 2010;49(2):1728–40. doi: 10.1016/j.neuroimage.2009.09.064. Epub 2009/10/06. [DOI] [PubMed] [Google Scholar]
- 16.Drew MR, Simpson EH, Kellendonk C, Herzberg WG, Lipatova O, Fairhurst S, et al. Transient overexpression of striatal D2 receptors impairs operant motivation and interval timing. J Neurosci. 2007;27(29):7731–9. doi: 10.1523/JNEUROSCI.1736-07.2007. Epub 2007/07/20. [DOI] [PMC free article] [PubMed] [Google Scholar]
- 17.Wiener M, Lohoff FW, Coslett HB. Double dissociation of dopamine genes and timing in humans. J Cogn Neurosci. 2011;23(10):2811–21. doi: 10.1162/jocn.2011.21626. Epub 2011/01/26. [DOI] [PubMed] [Google Scholar]
- 18.Fuster JM, Alexander GE. Neuron activity related to short-term memory. Science. 1971;173(3997):652–4. doi: 10.1126/science.173.3997.652. Epub 1971/08/13. [DOI] [PubMed] [Google Scholar]
- 19.Kubota K, Niki H. Prefrontal cortical unit activity and delayed alternation performance in monkeys. J Neurophysiol. 1971;34(3):337–47. doi: 10.1152/jn.1971.34.3.337. Epub 1971/05/01. [DOI] [PubMed] [Google Scholar]
- 20.Romo R, Brody CD, Hernandez A, Lemus L. Neuronal correlates of parametric working memory in the prefrontal cortex. Nature. 1999;399(6735):470–3. doi: 10.1038/20939. [DOI] [PubMed] [Google Scholar]
- 21.Prut Y, Vaadia E, Bergman H, Haalman I, Slovin H, Abeles M. Spatiotemporal structure of cortical activity: properties and behavioral relevance. J Neurophysiol. 1998;79(6):2857–74. doi: 10.1152/jn.1998.79.6.2857. [DOI] [PubMed] [Google Scholar]
- 22.Kojima S, Goldman-Rakic PS. Delay-related activity of prefrontal neurons in rhesus monkeys performing delayed response. Brain Res. 1982;248(1):43–9. doi: 10.1016/0006-8993(82)91145-3. [DOI] [PubMed] [Google Scholar]
- 23.Genovesio A, Tsujimoto S, Wise SP. Feature- and order-based timing representations in the frontal cortex. Neuron. 2009;63(2):254–66. doi: 10.1016/j.neuron.2009.06.018. Epub 2009/07/31. [DOI] [PMC free article] [PubMed] [Google Scholar]
- 24.Mita A, Mushiake H, Shima K, Matsuzaka Y, Tanji J. Interval time coding by neurons in the presupplementary and supplementary motor areas. Nat Neurosci. 2009;12(4):502–7. doi: 10.1038/nn.2272. Epub 2009/03/03. [DOI] [PubMed] [Google Scholar]
- 25.Janssen P, Shadlen MN. A representation of the hazard rate of elapsed time in macaque area LIP. Nat Neurosci. 2005;8(2):234–41. doi: 10.1038/nn1386. [DOI] [PubMed] [Google Scholar]
- 26.Brody CD, Hernandez A, Zainos A, Romo R. Timing and neural encoding of somatosensory parametric working memory in macaque prefrontal cortex. Cereb Cortex. 2003;13(11):1196–207. doi: 10.1093/cercor/bhg100. [DOI] [PubMed] [Google Scholar]
- 27.Leon MI, Shadlen MN. Representation of time by neurons in the posterior parietal cortex of the macaque. Neuron. 2003;38(2):317–27. doi: 10.1016/s0896-6273(03)00185-5. [DOI] [PubMed] [Google Scholar]
- 28.Merchant H, Zarco W, Perez O, Prado L, Bartolo R. Measuring time with different neural chronometers during a synchronization-continuation task. Proc Natl Acad Sci U S A. 2011;108(49):19784–9. doi: 10.1073/pnas.1112933108. Epub 2011/11/23. [DOI] [PMC free article] [PubMed] [Google Scholar]
- 29.Chiba A, Oshio K, Inase M. Striatal neurons encoded temporal information in duration discrimination task. Exp Brain Res. 2008;186(4):671–6. doi: 10.1007/s00221-008-1347-3. Epub 2008/03/19. [DOI] [PubMed] [Google Scholar]
- 30.Oshio K, Chiba A, Inase M. Temporal filtering by prefrontal neurons in duration discrimination. The European journal of neuroscience. 2008;28(11):2333–43. doi: 10.1111/j.1460-9568.2008.06509.x. Epub 2008/11/21. [DOI] [PubMed] [Google Scholar]
- 31.Oshio K, Chiba A, Inase M. Delay period activity of monkey prefrontal neurones during duration-discrimination task. The European journal of neuroscience. 2006;23(10):2779–90. doi: 10.1111/j.1460-9568.2006.04781.x. Epub 2006/07/05. [DOI] [PubMed] [Google Scholar]
- 32.Roberts S. Isolation of an internal clock. J Exp Psychol Anim Behav Process. 1981;7(3):242–68. Epub 1981/07/01. [PubMed] [Google Scholar]
- 33.Church RM, Deluty HZ. The bisection of temporal intervals. Journal of Experimental Psychology: Animal Behavior Processes. 1977;3:216–28. doi: 10.1037//0097-7403.3.3.216. [DOI] [PubMed] [Google Scholar]
- 34.Fetterman JG, Killeen PR, Hall S. Watching the clock. Behavioural processes. 1998;44(2):211–24. doi: 10.1016/S0376-6357(98)00050-3. [DOI] [PMC free article] [PubMed] [Google Scholar]
- 35.Killeen PR, Weiss NA. Optimal timing and the Weber function. Psychological review. 1987;94(4):455–68. [PubMed] [Google Scholar]
- 36.Rakitin BC, Gibbon J, Penney TB, Malapani C, Hinton SC, Meck WH. Scalar expectancy theory and peak-interval timing in humans. Journal of Experimental Psychology: Animal Behavior Processes. 1998;24(1):15–33. doi: 10.1037//0097-7403.24.1.15. [DOI] [PubMed] [Google Scholar]
- 37.Aldridge JW, Berridge KC. Coding of serial order by neostriatal neurons: a “natural action” approach to movement sequence. Journal of Neuroscience. 1998;18(7):2777–87. doi: 10.1523/JNEUROSCI.18-07-02777.1998. [DOI] [PMC free article] [PubMed] [Google Scholar]
- 38.Green L, Myerson J. A discounting framework for choice with delayed and probabilistic rewards. Psychol Bull. 2004;130(5):769–92. doi: 10.1037/0033-2909.130.5.769. Epub 2004/09/16. [DOI] [PMC free article] [PubMed] [Google Scholar]
- 39.Gibbon J. Scalar expectancy theory and Weber's Law in animal timing. Psychological review. 1977;84:279–325. [Google Scholar]
- 40.Wearden JH. Do humans possess an internal clock with scalar properties. Learning & Motivation. 1991;22:59–83. [Google Scholar]
- 41.Buhusi CV, Meck WH. What makes us tick? Functional and neural mechanisms of interval timing. Nature Reviews Neuroscience. 2005;6:755–65. doi: 10.1038/nrn1764. [DOI] [PubMed] [Google Scholar]
- 42.Taylor KM, Horvitz JC, Balsam PD. Amphetamine affects the start of responding in the peak interval timing task. Behavioural processes. 2007;74(2):168–75. doi: 10.1016/j.beproc.2006.11.005. Epub 2007/01/16. [DOI] [PubMed] [Google Scholar]
- 43.Gallistel CR, Fairhurst S, Balsam P. The learning curve: implications of a quantitative analysis. Proc Natl Acad Sci U S A. 2004;101(36):13124–31. doi: 10.1073/pnas.0404965101. Epub 2004/08/28. [DOI] [PMC free article] [PubMed] [Google Scholar]
- 44.Galtress T, Marshall AT, Kirkpatrick K. Motivation and timing: clues for modeling the reward system. Behavioural processes. 2012;90(1):142–53. doi: 10.1016/j.beproc.2012.02.014. Epub 2012/03/17. [DOI] [PMC free article] [PubMed] [Google Scholar]
- 45.Matell MS, Meck WH, Nicolelis MA. Interval timing and the encoding of signal duration by ensembles of cortical and striatal neurons. Behav Neurosci. 2003;117(4):760–73. doi: 10.1037/0735-7044.117.4.760. [DOI] [PubMed] [Google Scholar]
- 46.Matell MS, Meck WH. Cortico-striatal circuits and interval timing: coincidence detection of oscillatory processes. Brain Res Cogn Brain Res. 2004;21(2):139–70. doi: 10.1016/j.cogbrainres.2004.06.012. [DOI] [PubMed] [Google Scholar]
- 47.Matell MS, Meck WH. Neuropsychological mechanisms of interval timing behavior. Bioessays. 2000;22(1):94–103. doi: 10.1002/(SICI)1521-1878(200001)22:1<94::AID-BIES14>3.0.CO;2-E. [DOI] [PubMed] [Google Scholar]
- 48.Groves PM, Garcia-Munoz M, Linder JC, Manley MS, Martone ME, Young SJ. Models of Information Processing in the Basal Ganglia. MIT Press; Cambridge: 1995. Elements of the intrinsic organization and information processing in the neostriatum. In: Houk JC, Davis JL, Beiser DG, editors. pp. 51–96. [Google Scholar]
- 49.Houk JC. Information processing in modular circuits linking basal ganglia and cerebral cortex. In: Houk JC, Davis JL, Beiser DG, editors. Models of Information Processing in the Basal Ganglia. MIT Press; Cambridge: 1995. pp. 3–10. [Google Scholar]
- 50.Gooch CM, Wiener M, Portugal GS, Matell MS. Evidence for separate neural mechanisms for the timing of discrete and sustained responses. Brain Res. 2007;1156:139–51. doi: 10.1016/j.brainres.2007.04.035. [DOI] [PubMed] [Google Scholar]
- 51.Matell MS, Portugal GS. Impulsive responding on the peak-interval procedure. Behavioural processes. 2007;74(Special Issue in Tribute to Russell Church):198–208. doi: 10.1016/j.beproc.2006.08.009. [DOI] [PMC free article] [PubMed] [Google Scholar]
- 52.Portugal GS, Wilson AG, Matell MS. Behavioral sensitivity of temporally modulated striatal neurons. Front Integr Neurosci. 2011;5:30. doi: 10.3389/fnint.2011.00030. Epub 2011/08/03. [DOI] [PMC free article] [PubMed] [Google Scholar]
- 53.Harrington DL, Haaland KY, Hermanowicz N. Temporal processing in the basal ganglia. Neuropsychology. 1998;12(1):3–12. doi: 10.1037//0894-4105.12.1.3. [DOI] [PubMed] [Google Scholar]
- 54.Livesey AC, Wall MB, Smith AT. Time perception: manipulation of task difficulty dissociates clock functions from other cognitive demands. Neuropsychologia. 2007;45(2):321–31. doi: 10.1016/j.neuropsychologia.2006.06.033. [DOI] [PubMed] [Google Scholar]
- 55.Parent A, Hazrati LN. Anatomical aspects of information processing in primate basal ganglia. Trends Neurosci. 1993;16(3):111–6. doi: 10.1016/0166-2236(93)90135-9. [DOI] [PubMed] [Google Scholar]
- 56.Schultz W. The phasic reward signal of primate dopamine neurons. Adv Pharmacol. 1998;42:686–90. doi: 10.1016/s1054-3589(08)60841-8. [DOI] [PubMed] [Google Scholar]
- 57.Hollerman JR, Schultz W. Dopamine neurons report an error in the temporal prediction of reward during learning. Nat Neurosci. 1998;1(4):304–9. doi: 10.1038/1124. [DOI] [PubMed] [Google Scholar]
- 58.Schultz W, Dayan P, Montague PR. A neural substrate of prediction and reward. Science. 1997;275(5306):1593–9. doi: 10.1126/science.275.5306.1593. [DOI] [PubMed] [Google Scholar]
- 59.Fiorillo CD, Tobler PN, Schultz W. Discrete coding of reward probability and uncertainty by dopamine neurons. Science. 2003;299(5614):1898–902. doi: 10.1126/science.1077349. [DOI] [PubMed] [Google Scholar]
- 60.Alexander GE, Crutcher MD, DeLong MR. Basal ganglia-thalamocortical circuits: parallel substrates for motor, oculomotor, “prefrontal” and “limbic” functions. Progress in Brain Research. 1990;85:119–46. [PubMed] [Google Scholar]
- 61.Coull J, Nobre A. Dissociating explicit timing from temporal expectation with fMRI. Curr Opin Neurobiol. 2008;18(2):137–44. doi: 10.1016/j.conb.2008.07.011. Epub 2008/08/12. [DOI] [PubMed] [Google Scholar]
- 62.Wiener M, Matell MS, Coslett HB. Multiple mechanisms for temporal processing. Front Integr Neurosci. 2011;5:31. doi: 10.3389/fnint.2011.00031. Epub 2011/08/03. [DOI] [PMC free article] [PubMed] [Google Scholar]
- 63.Ivry RB, Spencer RM. The neural representation of time. Curr Opin Neurobiol. 2004;14(2):225–32. doi: 10.1016/j.conb.2004.03.013. [DOI] [PubMed] [Google Scholar]
- 64.Rao SM, Mayer AR, Harrington DL. The evolution of brain activation during temporal processing. Nat Neurosci. 2001;4(3):317–23. doi: 10.1038/85191. [DOI] [PubMed] [Google Scholar]
- 65.Lucchetti C, Ulrici A, Bon L. Dorsal premotor areas of nonhuman primate: functional flexibility in time domain. Eur J Appl Physiol. 2005;95(2-3):121–30. doi: 10.1007/s00421-005-1360-1. Epub 2005/07/28. [DOI] [PubMed] [Google Scholar]
- 66.Roesch MR, Olson CR. Neuronal activity dependent on anticipated and elapsed delay in macaque prefrontal cortex, frontal and supplementary eye fields, and premotor cortex. J Neurophysiol. 2005;94(2):1469–97. doi: 10.1152/jn.00064.2005. [DOI] [PubMed] [Google Scholar]
- 67.Hernandez A, Zainos A, Romo R. Temporal evolution of a decision-making process in medial premotor cortex. Neuron. 2002;33(6):959–72. doi: 10.1016/s0896-6273(02)00613-x. [DOI] [PubMed] [Google Scholar]
- 68.Macar F, Anton JL, Bonnet M, Vidal F. Timing functions of the supplementary motor area: an event-related fMRI study. Brain Res Cogn Brain Res. 2004;21(2):206–15. doi: 10.1016/j.cogbrainres.2004.01.005. [DOI] [PubMed] [Google Scholar]
- 69.Macar F, Vidal F, Casini L. The supplementary motor area in motor and sensory timing: evidence from slow brain potential changes. Exp Brain Res. 1999;125(3):271–80. doi: 10.1007/s002210050683. [DOI] [PubMed] [Google Scholar]
- 70.Matell MS, Shea-Brown E, Gooch C, Wilson AG, Rinzel J. A heterogeneous population code for elapsed time in rat medial agranular cortex. Behav Neurosci. 2011;125(1):54–73. doi: 10.1037/a0021954. Epub 2011/02/16. [DOI] [PMC free article] [PubMed] [Google Scholar]
- 71.Reep RL, Cheatwood JL, Corwin JV. The associative striatum: organization of cortical projections to the dorsocentral striatum in rats. J Comp Neurol. 2003;467(3):271–92. doi: 10.1002/cne.10868. [DOI] [PubMed] [Google Scholar]
- 72.Reep RL, Corwin JV. Topographic organization of the striatal and thalamic connections of rat medial agranular cortex. Brain Res. 1999;841(1-2):43–52. doi: 10.1016/s0006-8993(99)01779-5. [DOI] [PubMed] [Google Scholar]
- 73.Church RM, Meck WH, Gibbon J. Application of scalar timing theory to individual trials. Journal of Experimental Psychology: Animal Behavior Processes. 1994;20(2):135–55. doi: 10.1037//0097-7403.20.2.135. [DOI] [PubMed] [Google Scholar]
- 74.Duda RO, Hart PE, Stork DG. Pattern classification. 2nd ed. xx. Wiley; New York: 2001. p. 654. [Google Scholar]
- 75.Simen P, Balci F, de Souza L, Cohen JD, Holmes P. A model of interval timing by neural integration. J Neurosci. 2011;31(25):9238–53. doi: 10.1523/JNEUROSCI.3121-10.2011. Epub 2011/06/24. [DOI] [PMC free article] [PubMed] [Google Scholar]
- 76.Durstewitz D. Neural representation of interval time. Neuroreport. 2004;15(5):745–9. doi: 10.1097/00001756-200404090-00001. [DOI] [PubMed] [Google Scholar]
- 77.Fuster JM. The prefrontal cortex : anatomy, physiology, and neuropsychology of the frontal lobe. 3rd ed. xvi. Lippincott-Raven; Philadelphia: 1997. p. 333. [Google Scholar]
- 78.Swanton DN, Gooch CM, Matell MS. Averaging of temporal memories by rats. J Exp Psychol Anim Behav Process. 2009;35(3):434–9. doi: 10.1037/a0014021. Epub 2009/07/15. [DOI] [PMC free article] [PubMed] [Google Scholar]
- 79.Kurti A, Swanton DN, Matell MS. The potential link between temporal averaging and drug-taking behavior. In: Arstila V, Lloyd D, editors. Subjective Time. MIT Press; 2013. in press. [Google Scholar]
- 80.Swanton DN, Matell MS. Stimulus compounding in interval timing: the modality-duration relationship of the anchor durations results in qualitatively different response patterns to the compound cue. J Exp Psychol Anim Behav Process. 2011;37(1):94–107. doi: 10.1037/a0020200. Epub 2010/08/20. [DOI] [PMC free article] [PubMed] [Google Scholar]
- 81.Matell MS, Kurti AN. Reinforcement probability modulates temporal memory selection and integration processes. Acta Psychol (Amst) 2013 doi: 10.1016/j.actpsy.2013.06.006. Epub 2013/07/31. [DOI] [PMC free article] [PubMed] [Google Scholar]
- 82.Staddon JER, Higa JJ. Time and memory: Towards a pacemaker-free theory of interval timing. Journal of the Experimental Analysis of Behavior. 1999;71(2):215–51. doi: 10.1901/jeab.1999.71-215. [DOI] [PMC free article] [PubMed] [Google Scholar]
- 83.Bush G, Luu P, Posner MI. Cognitive and emotional influences in anterior cingulate cortex. Trends Cogn Sci. 2000;4(6):215–22. doi: 10.1016/s1364-6613(00)01483-2. Epub 2000/05/29. [DOI] [PubMed] [Google Scholar]
- 84.Shuler MG, Bear MF. Reward timing in the primary visual cortex. Science. 2006;311(5767):1606–9. doi: 10.1126/science.1123513. [DOI] [PubMed] [Google Scholar]
- 85.Schneider BA, Ghose GM. Temporal production signals in parietal cortex. PLoS biology. 2012;10(10):e1001413. doi: 10.1371/journal.pbio.1001413. Epub 2012/11/03. [DOI] [PMC free article] [PubMed] [Google Scholar]
- 86.Shinomoto S, Omi T, Mita A, Mushiake H, Shima K, Matsuzaka Y, et al. Deciphering elapsed time and predicting action timing from neuronal population signals. Frontiers in computational neuroscience. 2011;5:29. doi: 10.3389/fncom.2011.00029. Epub 2011/07/08. [DOI] [PMC free article] [PubMed] [Google Scholar]
- 87.Itskov V, Curto C, Pastalkova E, Buzsaki G. Cell assembly sequences arising from spike threshold adaptation keep track of time in the hippocampus. J Neurosci. 2011;31(8):2828–34. doi: 10.1523/JNEUROSCI.3773-10.2011. Epub 2011/03/19. [DOI] [PMC free article] [PubMed] [Google Scholar]
- 88.Laje R, Buonomano DV. Robust timing and motor patterns by taming chaos in recurrent neural networks. Nat Neurosci. 2013;16(7):925–33. doi: 10.1038/nn.3405. Epub 2013/05/28. [DOI] [PMC free article] [PubMed] [Google Scholar]
- 89.Johnson HA, Goel A, Buonomano DV. Neural dynamics of in vitro cortical networks reflects experienced temporal patterns. Nat Neurosci. 2010;13(8):917–9. doi: 10.1038/nn.2579. Epub 2010/06/15. [DOI] [PMC free article] [PubMed] [Google Scholar]
- 90.MacDonald CJ, Lepage KQ, Eden UT, Eichenbaum H. Hippocampal “time cells” bridge the gap in memory for discontiguous events. Neuron. 2011;71(4):737–49. doi: 10.1016/j.neuron.2011.07.012. Epub 2011/08/27. [DOI] [PMC free article] [PubMed] [Google Scholar]
- 91.Merchant H, Perez O, Zarco W, Gamez J. Interval tuning in the primate medial premotor cortex as a general timing mechanism. J Neurosci. 2013;33(21):9082–96. doi: 10.1523/JNEUROSCI.5513-12.2013. Epub 2013/05/24. [DOI] [PMC free article] [PubMed] [Google Scholar]