

Abstract
Ferritins, complex protein nanocages, form internal iron-oxy minerals (Fe2O3.H2O), by moving cytoplasmic Fe2+ through intracage ion channels to cage-embedded enzyme (2Fe2+/O2 oxidoreductase) sites where ferritin biomineralization is initiated. The products of ferritin enzyme activity are diferric oxy complexes that are mineral precursors. Conserved, carboxylate amino acid side chains of D127 from each of three cage subunits project into ferritin ion channels near the interior ion channel exits and, thus, could direct Fe2+ movement to the internal enzyme sites. Ferritin D127E was designed and analyzed to probe properties of ion channel size and carboxylate crowding near the internal ion channel opening. Glu side chains are chemically equivalent to, but longer by one – CH2 than Asp, side chains. Ferritin D127E assembled into normal protein cages, but diferric peroxo formation (enzyme activity) was not observed, when measured at 650nm (DFP λmax). The caged biomineral formation, measured at 350 nm in the middle of the broad, nonspecific Fe3+-O absorption band, was slower. Structural differences (protein X-ray crystallography), between ion channels in wild type and ferritin D127E, which correlate with the inhibition of ferritin D127E enzyme activity include: 1. narrower interior ion channel openings/pores, 2. increased numbers of ion channel protein-metal binding sites, and 3. a change in ion channel electrostatics due to carboxylate crowding. The contributions of ion channel size and structure to ferritin activity reflect metal ion transport in ion channels are precisely regulated both in ferritin protein nanocages and membranes of living cells.
Keywords: ferritin, iron oxidation, ion channels, crystal structure, electrostatics, di-iron center, diferric peroxo, caged iron-oxy biomineral, oxidoreductase enzyme reactivity
Introduction
Ferritins are hollow, spherical, multimeric protein nanocages (Fig. 1A), located mainly in the cytoplasm, that self-synthesize encapsulated iron minerals within the ∼ 8 nm in diameter central cavity [1-7]. The iron biominerals are Fe2O3•H2O, with variable phosphate content, and are metabolic iron concentrates [8]o. Iron moves through channels in ferritin protein subunits to multiple ferroxidase sites (oxidoreductase site) [9], which are embedded in the ferritin protein cage or, in small ferritins in bacteria (Dps proteins) on the inner surface [10]. In eukaryotic ferritins the enzyme site substrates, 2 ferrous ions and dioxygen, react to form blue color transient diferric peroxo (DFP) species that decay to diferric oxo bridged complexes, an analogy to DFP formation in di-iron oxygenases [1, 2, 6, 11-16]; ferritin in bacteria have divergent amino acid sequences and reaction pathways from eukaryotic ferritins, while Dps proteins (bacterial mini-ferritins), not only diverge from ferritins in sequence but also in oxidant and enzymatic pathway [17]. Ferritin biomineral precursors migrate from within the ferritin protein cage to the protein cavity for mineral growth [18]. In addition to concentrating iron, ferritin enzymatic activity is also cytoplasmic antioxidant actvity [17] because the substrates consumed during the initiation of iron biomineralization are the Fenton chemistry substrates, Fe2+ and O2 or H2O2. The crucial role of ferritin in biology is illustrated by fact that gene deletion in mammalian embryos is lethal [19].
Figure 1. (A-D): Fe2+ traffic into the buried enzyme sites of ferritin protein cages (eukaryotic model: frog M).
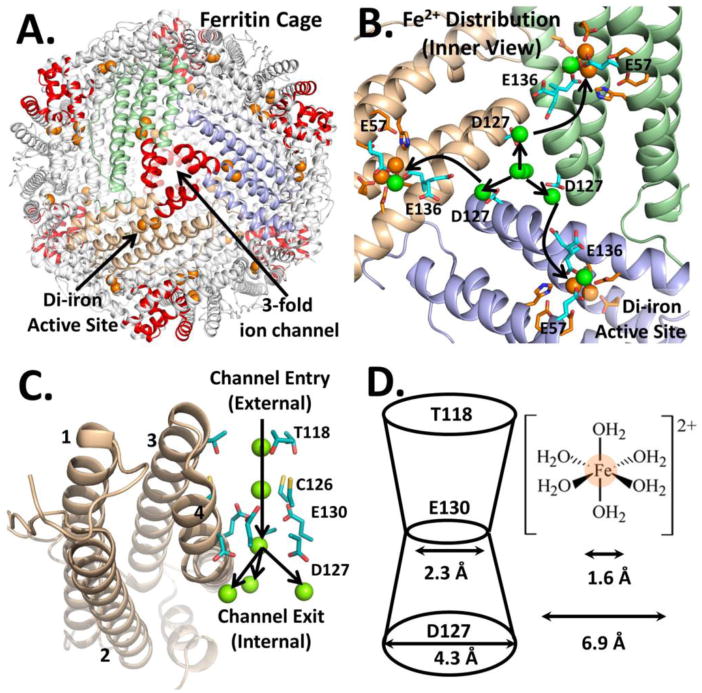
Ferritin enzyme activity (Fe2+/O2 oxidoreductase) requires Fe2+ entry into the ferritin protein nanocage from the external environment, which are connected by 8 ion channels around the 3-fold symmetry axes of 24 subunit ferritin cages A. A ferritin nanocage: self-assembled from 24 subunits, there are 8 ion channels around the 3-fold symmetry axes (red helices) for delivery of iron to 24 di-iron active sites (one/subunit); one arrow point to 1 of 24 enzyme sites with 2 substrate ions (orange spheres) and another arrow points to an ion channel where Fe2+ substrate enters or Fe2+ from dissolved, caged ferritin mineral exits. B. Symmetric distribution of incoming metals ions from D127, at the inner ion channel exits (inside view); arrows indicate connections between an interior ion channel and ferritin enzymatic (2Fe2+/O2 oxidoreductase) sites; oxidoreductase site residues- red-orange. C. A line of Mg2+ ions (green spheres), bind to conserved residues in ferritin ion channels, around each 3-fold symmetry axis of the protein cage. D. Side chains from three conserved E130 residues (one from each of three protein cage subunits forming the ion channels at the protein cage 3-fold symmetry axes) create a constriction mid-way in ferritin ion channels. The diameter at a ferritin protein channel constriction is smaller than the 6.9 Å diameter of [Fe (H2O)6]2+ ; fully or partially dehydrated Fe2+ ions, which have diameters smaller than the 6.9 Å diameter at the ferritin ion channel constrictions, suggest partial or full dehydration of transiting Fe2+ ions.
Each cage-penetrating ion channel in ferritin is formed by segments of three protein cage subunits around the 3-fold symmetry axes of the nanocages (Fig. 1) [20, 21]. In 24 subunits ferritin, the only size found in animals and plants, there are eight such channels. Rather than being shaped like cylindrical tubes, ferritin ion channels are constricted in the middle like an hour-glass [22]. Fe2+ moves rapidly through the ion channels, reaching the active sites in milliseconds, as evidenced by the rate of formation of the blue, DFP enzymatic intermediate. Each polypeptide subunit in a ferritin protein cage is folded in the common, four α-helix bundle motif [6, 7] and the ion channels are linked to the di-Fe2+/O2 oxidoreductase active sites by transfer residues E136 and E57 located within the bundles (Fig. 1B) [23]. High resolution (1.5 Å) cocrystal structures of ferritin protein (frog M) cages, with Co2+ and Mg2+ as proxies for the labile Fe2+ substrate indicate the structural connectivity between Fe2+ ions moving from the protein cage exterior, through the ion channels around the 3-fold cage axes, and into the interior of the protein nanocage (Fig. 1)[22]. The ferritin 3-fold ion channels are 15 Å long; metal binding is observed in the ion channels in ferritin protein crystals (Fig. 1C). Ferritin ion channel width is variable with the narrowest dimension of 2.3 Å (Fig. 1D) caused by carboxylate side chains of three, conserved ion channel residues, E130.
The diameter of fully hydrated Fe2+ ions is 6.9 Å suggesting that in order for Fe2+ to pass through ferritin ion channels, either partial/full dehydration of Fe2+•(H2O)6, protein channel conformational flexing/channel widening, or both is required, in order for the Fe2+ substrate to reach the enzyme sites in ferritin [24]. Variable-temperature variable field (VTVH) magnetic circular dichroism (MCD) spectroscopy of Fe2+ ions bound to ferritin enzymatic sites demonstrated that Fe2+ in this environment is coordinated by only a single water molecule. Widening of the mid-channel constriction in ferritin variants E130D and E130A resulted in inhibition of enzyme activity as judged by the rate of formation of the DFP intermediate [22, 23, 25]. Together these observations suggest that the internal dimensions and charge of the ion channel are critical to efficient function and that a possible role of the ring of E130 carboxylates is to dehydrate Fe2+ ions en-route to the active site [26, 27].
Ferritin ion channels contain a second conserved carboxylate, D127 (Fig 1B, C and D) [22, 28], the sidechain of which is located near the interior exits of the ion channels, where the channel diameter widens to ∼4.5 Å (Fig. 1D). Divalent metal cations bind at the three D127 residues in protein-cation cocrystals in a symmetrical manner [22]. Why metal ions accumulate around ferritin ion channel exits is puzzling since the ferroxidase centers would be expected to have a higher affinity for the Fe2+ substrates than the ion channels, which manage Fe2+ traffic into and out of the ferritin protein cage; however, the active protein conformation may not be fully represented in the metal-protein cocrystals. Thus a possible role for metal binding at D127 is the distribution of Fe2+, passing through an ion channel to the ferroxidase sites in each of the three ferritin polypeptide subunits that also contribute helical polypeptide segments to the ion channel walls (Fig 1). Support for such a hypothesis includes the brief study of ferritin D127A, with decreased ferritin enzyme activity [15 and the VTVH-MCD studies on wild type (WT) ferritin, previously mentioned [29]. In such studies, even in the absence of the second ferritin enzyme substrate, dioxygen, Fe2+ binding at ferritin enzyme sites displays positive cooperativity (Hill coefficient n∼3). Such an observation suggests that Fe2+ binding involves changes in protein-protein interactions.
Among the two sets of conserved carboxylate residues in ferritin ion channels, only the structure/function effects of the ring of three glutamate residues (E130) in the middle of the ion channels have been systematically investigated; an activity study, showed that ferritin E130A is enzymatically inactive [7, 25], indicates the importance of E130. Here we carried out a comprehensive structure/function study to further understand the role of the second set of conserved, ion channel, metal-ion binding carboxylates, D127, which dictate the ion channel size and electrostatics near the internal exits of the ferritin ion channels. To probe the role of D127, a minor addition of a methylene group was made to this aspartate residue. The ferritin D127E was synthesized and its ion channel transport properties were examined and the results are discussed below.
Materials and Methods
Protein Preparation
The ferritin 3-fold ion channel exit variant, D127E, was prepared using the WT frog M ferritin gene inserted into a pET-3a vector, the template DNA, by Quick-change Site Directed Mutagenesis Kit (Stratagene) [29, 30]. Primer oligonucleotides: (D127E sense; 5′ gacccccatctgtgtgagttcctggaatctgaata-3′ and D127E antisense; 5′ tattcagattccaggaactcacacagatgggggtc-3′), used for site-specific mutagenesis, were supplied by integrated DNA technology (IDT). The letter in bold and underlined in oligonucleotide primer sequences indicates the position at which changes introduced in the nucleotide base for synthesis of ferritin D127E mutant. The DNA sequence encoding recombinant ferritin D127E was confirmed by sequencing (Quintarabio). Recombinant WT frog M ferritin protein and the D127E variant were expressed in Escherichia coli BL21(DE3) pLysS (Stratagene) and purified using methods reported previously [30]. The purified proteins were dialyzed against 100 mM MOPS (pH 7.0) containing 100 mM NaCl and concentrated by centrifugation on a 50 kD cutoff membrane (Millipore). Protein concentrations were determined by the Bradford method (Biorad protein assay reagent) with bovine serum albumin as a standard (Thermo Scientific).
Ferritin Enzyme (Fe2+/O2 oxidoreductase) Kinetics
Studies of the first enzymatic turnover in ferritin protein used 48 Fe2+/cage (2 Fe2+/catalytic site); 4.16 μM of ferritin cage (or 100 μM subunits) in 0.2 M MOPS (pH 7.0), 0.2 M NaCl. Protein solutions were rapidly mixed (< 10 msec) with equal volumes of freshly prepared solutions of 200 μM FeSO4 in 0.001 M HCl at 20°C, using a stopped-flow UV-visible spectrophotometer (Applied Photophysics). The Fe2+/O2 oxidoreductase rates were monitored in solutions of ferritin protein cages by recording progress curves for the formation of the blue, transient intermediate in ferritin enzyme activity, diferric peroxo (Fe3+-O-O-Fe3+, DFP), at the absorbance maximum (λmax 650 nm)[6] and for the multiple ferric oxo species (Fe3+-O), at 350 nm. All the ferric oxy species in ferritin, including DFP, oligomeric ferric oxo/hydroxo species and ferric biominerals contribute to the broad absorbance from 310-450 nm; absorbance at 350 nm was used for convenience.[30] Initial rates (Vi) of formation of DFP at 650 nm and Fe3+-O species at 350 nm were calculated by linear fitting of the initial part (up to 30 msec) of each kinetic trace.
For multiple turnover experiments (480 Fe/cage = 10 turnovers), 2.08 μM (50 μM subunits) ferritin solutions in 0.2 M MOPS (pH 7.0), 0.2 M NaCl were rapidly mixed with freshly prepared 1.0 mM FeSO4 in 0.001 M HCl as described above. For 480 Fe/cage experiment, the final protein concentration was decreased to half (2.08 to 1.04 μM) in order to avoid oxygen as limiting factor.
Iron Release Kinetics
To form the protein-caged ferritin iron mineral, freshly prepared solutions of FeSO4 in 0.001 M HCl were mixed, manually, with buffered solutions of recombinant WT or D127E ferritin protein; the ferritin iron minerals contained 480 Fe/ ferritin protein cage. After 2 hours at room temperature, the protein/iron mixtures were placed at 4°C, overnight, to complete the iron mineralization process [28]. Final concentrations were 2.08 μM ferritin protein cage and 1.0 mM ferritin protein-caged iron mineral, which is equivalent to 480 iron atoms as mineral/ protein cage, in 0.1 M MOPS (pH 7.0), 0.1 M NaCl.
Reduction and dissolution of the iron in protein-caged ferritin iron minerals was initiated with NADH/FMN [28]. Fe2+, reduced and dissolved from ferritin (protein caged iron minerals), was detected as the Fe2+ bipyridyl complex. Mineral dissolution/Fe2+ release kinetics were measured as the change in absorbance at 522 nm [λmax, Fe2+-(2,2′-bipyridyl)3 = 522 nm] at 25°C [28]. The reaction was initiated by addition of 2.5 mM NADH (final concentration) to a solution containing mineralized ferritin cages (250 μL), 2.5 mM FMN, and 2.5 mM bipyridyl, all in the final protein buffer (0.1 M MOPS, pH 7.0, 0.1 M NaCl). Note that a no protein control, i.e., mixing solutions of Fe2+ salts with bipyridyl under the same conditions, but without ferritin protein, formed the iron –bipyridyl complex too rapidly to capture even with rapid mixing spectrophotometers (mixing times < 10 msec). Data analyses used Origin Pro 8.0. The data are averages of results from 4-6 independent experiments, using 2 different preparations of each protein. Errors are the standard deviation. Statistical analyses used the student t test.
Protein Crystallization
The frog M ferritin protein cage variant, D127E, was crystallized as previously described for WT frog M ferritin for both Mg2+ and Co2+ bound crystals [22]. In brief, crystals were grown by hanging-drop vapor diffusion method with drops consisting of 10 mg/mL D127E frog M ferritin solution and an equal volume of the precipitant solution, 2.0 M MgCl2 and 100 mM N,N-bis (2- hydroxyethyl) glycine (BICINE) (pH 9.0) with and without 0.1 mM CoCl2. After soaking crystals for 5 min in precipitant solution containing 20% (v/v) ethylene glycol as a cryoprotectant, they were frozen in liquid nitrogen.
X-ray Data Collection
X-ray diffraction data were collected at 100 K. Native data sets were obtained for both Mg2+-D127E ferritin and Co2+-D127E ferritin crystals (λ= 1.0 Å) to 1.65 Å with an additional anomalous data set for Co2+-D127E ferritin at the Co2+ edge (λ= 1.61 Å). Data processing was carried out with the HKL-2000 suite [31]. Data collection statistics are summarized in Table 2.
Table 2. Data collection and refinement statistics.
| D127E-ferritin (Co2+) | D127E-ferritin (Mg2+) | D127E-ferritin (Co2+) Anomalous | |
|---|---|---|---|
| Wavelength (Å) | 1.0 | 1.0 | 1.61 |
| Resolution range (Å) | 50-1.65 (1.71-1.65) | 50-1.65 (1.71-1.65) | 50-1.84 (1.91-1.84) |
| Space group | F 4 3 2 | F 4 3 2 | F 4 3 2 |
| Unit cell (Å) | 184.0 184.0 184.0 | 183.9 183.9 183.9 | 183.7 183.7 183.7 |
| (°) | 90 90 90 | 90 90 90 | 90 90 90 |
| Total reflections | 596172 | 678016 | 446803 |
| Unique reflections | 32085 | 32597 | 21148 |
| Multiplicity | 18.6 (13.3) | 20.8 (20.9) | 10.3 (7.6) |
| Completeness (%) | 99.94 (99.55) | 100.00 (100.00) | 100.00 (100.00) |
| Mean I/sigma(I/σ) | 22.52 (6.65) | 37.22 (8.35) | 17.41 (3.83) |
| Wilson B-factor (Å2) | 16.56 | 13.63 | 23.62 |
| R-sym# | 0.079 (0.486) | 0.081 (0.376) | 0.113 (0.877) |
| R-factor++ | 0.1586 (0.1701) | 0.1297 (0.1106) | - |
| R-free | 0.1768 (0.1877) | 0.1665 (0.1754) | - |
| Number of atoms | 3187 | 3319 | - |
| Cobalt | 11 | 0 | - |
| Magnesium | 2 | 11 | - |
| Chlorine | 9 | 6 | - |
| Water | 193 | 305 | - |
| Protein residues | 172 | 174 | - |
| RMS(bonds) (Å) | 0.009 | 0.009 | - |
| RMS(angles) (°) | 1.17 | 1.12 | - |
| Ramachandran favored (%) | 97 | 98 | - |
| Ramachandran outliers (%) | 0 | 0 | - |
| Clashscore | 3.34 | 4.74 | - |
| Average B-factor (Å2) | 18.50 | 16.50 | - |
| macromolecules | 17.30 | 14.00 | - |
| solvent | 32.00 | 28.90 | - |
| Metals | 26.90 | 20.30 | - |
| PDB Code | 4LPM | 4LPN |
Statistics for the highest-resolution shell are shown in parentheses.
Rsym = Σ Σi |Ii – (I)|/ Σ Σi Ii.
Rwork = Σ ‖Fobs| - | Fcalc‖/ Σ |Fobs|. Rfree was computed identically except all reflections belonged to a test set consisting of a 5% random selection of the data.
Structure Refinement
Initial models were obtained by molecular replacement using search models of WT frog M ferritin Mg2+ (PDB code: 3KA3) and Co2+ (PDB code: 3KA4) structures excluding water or ions utilizing Phenix.Phaser-MR [32]. Density modification and an initial round of refinement were performed for each model using Phenix.Autobuild [32]. This was followed by manual building through Coot[33] with iterative cycles of refinement with Phenix.Refine [32]. Final placement of Mg2+, Co2+ and Cl- ions were determined by coordination geometry, and Co2+ and Mg2+ ions were distinguished by the strong anomalous scattering of Co2+. The final stereochemistry and geometry for each model was validated with Molprobity [32]. The refinement parameters are summarized in Table 2. Structure comparisons of ferritin WT and the D127E variant were carried out with the aid of difference Fourier maps using Phenix.maps [32]. All molecular graphics were prepared using PyMOL [34].
Results
Ferritin enzyme activity and mineralization were inhibited by ion channel modification D127E
The alterations in ferritin protein cage ion channel dimensions and electrostatics caused by the single -CH2 extension of the carboxylate side chain in conserved residue D127 (ferritin D127E), near the internal 3-fold pores of ferritin ion channels (Fig. 1D), inhibited ferritin mineralization. Whether the first turnover (48 Fe/cage) or multiple turnovers, were examined, both ferritin enzyme (Fe2+/O2 oxidoreductase) activity (DFP formation) and protein-caged biomineral formation were inhibited (Figs. 2A & 2B). Measuring the initial rate of DFP formation in ferritin D127E was not possible due to lack of its formation to a detectable amount, which contrasts with WT - 0.9 s-1; Fe3+-O mineral formation was ∼25-fold less in ferritin D127E than in WT (Table 1). The absence of detectable DFP in ferritin D127E could reflect no DFP accumulation due to slower Fe2+ entry, combined with the transient nature of DFP. Initial rates of Fe3+-O formation, measured at 350nm, in ferritin D127E were similar to other channel variants, such as ferritin E130A and ferritin D127A [7] (see Table 1). In the ferritins E130A and D127A, while Fe2+ movement should be facilitated by the larger diameters of ferritin ion channels, the absence of guiding carboxylate side chains appears to dominate Fe2+ traffic. Even the addition of a 10-fold excess of Fe2+ substrate to ferritin D127E failed to rescue DFP formation or enzyme activity (Figs. 2C & 2D), in contrast to the mild rescue of activity in ferritin D127A under comparable conditions (Fig. S1) [7]. The loss of function in ferritin D127E emphasizes the importance not only of ion channel diameter but also of negative charge density for transiting Fe2+ through ferritin ion channels to the enzyme sites embedded in the ferritin cage.
Figure 2. (A-D): Ferritin enzyme activity (Fe2+/O2 oxidoreduction) is inhibited in ferritin D127E, an amino acid substitution near the inner exits of the ion channels: single and multiple turnover experiments.
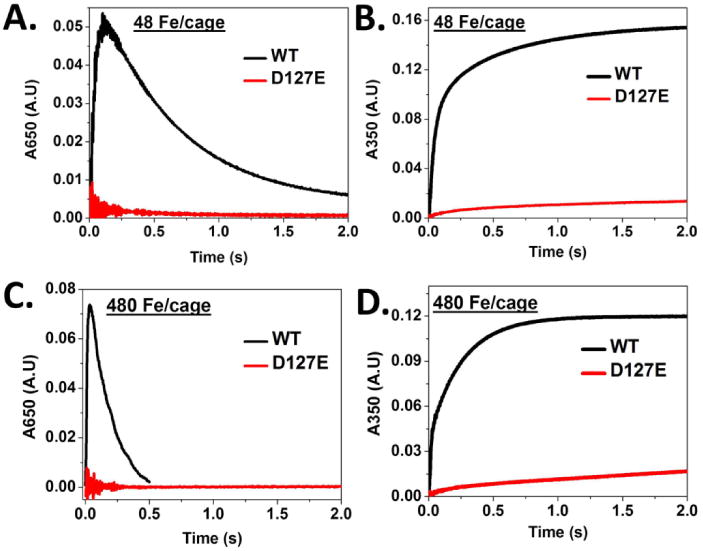
A. Progress curves at A650nm for formation/decay of DFP intermediate. B. Progress curves of A350nm for formation [Fe3+-O]x species. WT and variant ferritin (4.16 μM nanocages) in 200 mM MOPS, 200 mM NaCl at pH 7.0 and 200 μM FeSO4 (48 Fe/cage) in 1.0 mM HCl were mixed in equal volumes at 20°C in a stopped-flow spectrophotometer. (See Experimental Procedures.) C. and D. Progress curves for WT and D127E ferritins with 480 Fe/cage at A650nm and A350nm; conditions are same as in A and B except the final protein concentration was decreased to half (from 2.08 to 1.04 μ) in order to avoid oxygen as limiting factor. NOTE: the most rapid period of change occurs in less than one second after mixing.
Table 1. Kinetic parameters (first turnover - 48 Fe/cage) for the formation of DFP and [Fe3+O]x species in WT and D127E variant frog M ferritin protein.
The kinetics of the reactions (48 Fe/cage) were initiated by mixing 4.16 μM ferritin nanocage and 200 μM ferrous sulfate simultaneously, using the stopped flow instrument. Initial rates of formation of DFP at 650 nm and Fe3+-O species at 350 nm were calculated by linear fitting initial point of each kinetic trace (Figure 2).
| Protein | Initial rate of DFP formation (ΔA650nm/Δt), s-1 | Initial rate of [Fe3+O]x formation (ΔA350nm/Δt), s-1 |
|---|---|---|
| WT | 0.90 ± 0.05 | 1.65 ± 0.05 |
| D127E | #N.D. | 0.07 ± 0.03* |
| aD127A | 0.015 ± 0.020* | 0.04 ± 0.01* |
| aE130A | 0.005 ± 0.005* | 0.05 ± 0.05* |
The data shown are averages (± standard deviation) of 4 - 8 independent experiments, using 2 different protein preparations of each ferritin variant.
for p-value < 0.0001, computed against WT. Statistical analyses used the student t test.
Not determined due to lack of detectable amount of DFP formation.
Data obtained from [7].
Ferritin mineral dissolution and Fe2+ exit increased with ferritin protein ion channel modification D127E
Iron exiting from the ferritin protein cages, after reduction of the ferric mineral and dissolution, can be monitored by formation of Fe2+-(2,2′-bipyridyl)3; the progress curves for Fe2+-(2,2′-bipyridyl)3 formation are multiphasic (Fig. 3A); the process is sometimes called “iron release”. In ferritin D127E, more Fe2+-(2,2′-bipyridyl)3 formed than in ferritin WT (Fig. 3A). For example, at 30 min more than twice the amount of Fe2+-(2,2′-bipyridyl)3 had formed from dissolved ferritin iron mineral in ferritin D127E than in WT (Fig. 3B). However, WT iron release kinetics were unaffected by D127A and E130A ion channel substitutions [7]. An alternative explanation, enhanced access between the internal, ferritin ferric mineral and external FMNH2 in ferritin D127E, is unlikely because in ferritin D127E the ion channels are more crowded by the longer carboxylate side chains [35]. However, the larger density of negative charges from the longer carboxylate side chains in ferritin D127E could attract Fe2+ into to the ion channels, after reduction and dissolution from the protein-caged iron mineral, thereby facilitating Fe2+ exit.
Figure 3. Mineral dissolution increased in ferritin D127E, substitutions in the three subunits forming ferritin ion channels.
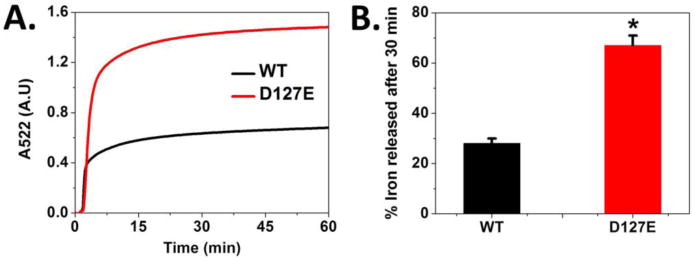
Mineral dissolution requires access between the protein caged- ferric iron mineral and reductants, NADH/FMN and, as measured here, between Fe2+ dissolved from the ferritin ferric mineral, and the chelator. A. The iron release kinetics were monitored at 25°C by measuring the amount of Fe2+- (2,2′-bipyridyl)3 outside the ferritin nanocage (absorbance change at 522 nm) (See Experimental Procedures). B. Effect of D127E substitution in ferritin protein cages on the percentage of iron released after 30 min. The final concentrations of the solutions were 250 μM caged ferric mineral, 2.5 mM NADH, 2.5 mM FMN, and 2.5 mM bipyridyl, in 0.1 M MOPS and 0.1 M NaCl, pH 7.0. * for p-value <0.0001 computed against WT. The data shown are averages of results from 4-6 independent experiments, using two different preparations of each protein. Errors are the standard deviation.
More metal ions bind in the ion channels of ferritin D127E protein crystals than ferritin WT
To fully understand the functional differences caused by the addition of a –CH2 group to D127 compared to WT at the molecular level, we solved the three-dimensional crystal structure of the D127E variant in the presence of divalent metal ions. The metal binding sites and residue side chain conformations were compared between WT and D127E variant structures at both the 3-fold ion channels and ferroxidase sites. Conserved, ion channel, glutamate side chains in ferritin D127E bind Mg2+ or Co2+ near the internal exits of ferritin ion channels in ferritin protein cocrystals in a line similar to WT ferritin[22] protein cage structures (Fig 4). These metals serve as Fe2+ ion proxies where the weaker complexes of Mg2+-protein, in contrast with Co2+, have the advantage in ferritin of representing more transient metal-protein interactions even though Co2+ is chemically more similar to Fe2+ than Mg2+. As such, in WT ferritin cocrystal structures[22], Mg2+ ions are observed in weaker binding sites than Co2+ (Fig. 4), which is also observed in ferritin D127E, albeit with different ion locations; the differences were observed in both the Mg2+ and the Mg2+ + Co2+ cocrystal structures (Fig. 4).
Figure 4. (A-F): Differences and similarities in ion distribution in ferritin ion channels helices in WT and D127E ferritin protein cages.
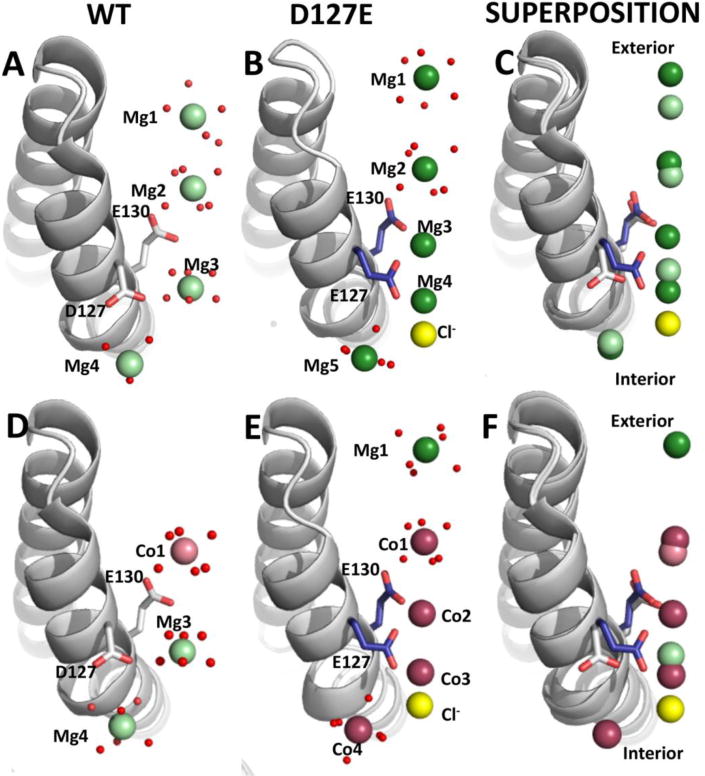
Ion channels form around the 3-fold axes of ferritin protein cages. The channels consist of segments from two α helices (α3 and α4) in the four α-helix bundles that form each subunit of ferritin protein cages. Helices are shown as ribbon representation and waters as small red spheres. A-C. Side views of Mg2+ bound ferritin cocrystal structures. A. WT ferritin structure with Mg2+ (PDB code: 3KA3): carbon and oxygen atoms in white and red stick, respectively; Mg2+ as pale green spheres; Cl- ions as yellow spheres. B. D127E ferritin structure (PDB code: 4LPM) carbon, and oxygen atoms in white and red stick, respectively; Mg2+ ions as dark green spheres; Cl- as yellow spheres. C. Superposition of WT and D127E Mg2+ bound ferritin cocrystal structures. D-F. Side views of Co2+ and Mg2+ bound ferritin cocrystal structures. D. WT ferritin structure (PDB code: 3KA4): carbon and oxygen atoms in white and red stick, respectively; Co2+ as pale pink spheres; Cl- as yellow spheres. E. D127E ferritin structure (PDB code: 4LPN): carbon and nitrogen atoms in blue and stick, respectively, Co2+ as dark pink spheres, Cl- as yellow spheres. F. Superimposition of WT and D127E Co2+ and Mg2+ bound ferritin cocrystal structures.
In the Mg2+ cocrystal structures, five Mg2+ are bound in the ion channels of ferritin D127E contrasting with the four Mg2+ ions in ferritin WT; the average B-factor for Mg2+ sites in ferritin D127E of ∼20 Å2 are comparable to the value of ∼12 Å2 for WT. The additional Mg2+ ion binds between E130 and E127 (Fig. 4C) where the side chain of E127 is flipped 30° compared to D127 in WT. As a result, the three carboxylates of residue 127 contributed from each of the three subunits forming the ion channels, point toward the center of the internal pore of the ion channels coordinating two Mg2+ ions (Mg3 & Mg4) between the carboxylate oxygen atoms of E127 and E130 (Fig. 4B).
The 3-fold symmetry of ferritin ion channels accentuates the effects of the D127E substitution on Mg2+ binding in the channels. Six carboxylates (three E127 + three E130) bind Mg3 with an octahedral coordination. There is sufficient negative charge to bind an additional Mg2+ (Mg4), albeit weakly enough for interactions of Mg4 with a Cl- ion (Figure 4B). In ferritin WT, where the side chain of residue 127 is the shorter aspartate carboxylate, there is only one Mg2+ ion near the three aspartate carboxylates and that Mg2+ ion is coordinated entirely by waters with no protein ligands (Fig. 4A). Near the exterior opening of ferritin ion channels there are two Mg2+ ions both coordinated by water alone (Mg1 & Mg2) that are closer to the surface by 0.8 and 2.2 Å, respectively.
There are three main differences in Co2+ and Mg2+ binding for Co2+ + Mg2+ cocrystal structures between ferritin WT and D127E. Only Co1 in ferritin D127E is in a similar position to WT (Fig. 4D, E, and F): 1. Mg1 is absent in the WT Co2+ structure. 2. There are additional Co2+ ions (Co3 and Co4) in place of Mg3 between the carboxylate oxygen atoms of E127 and E130 as seen for the Mg2+ cocrystal structure. 3. Co4 replaces Mg4 from WT ferritin, near the interior pore in Co2+ + Mg2+- ferritin cocrystal structures, but as with Mg2+ cocrystal structure an additional Cl- is bound (Fig. 4E). The consequences of the change in the properties of the ion channels in ferritin D127E compared to WT are the presence of an additional Cl- ion, more metal ion binding sites, and a shift in the distribution of metal ions in the channels towards the external and internal openings (Fig. 4E).
The interior exits of ion channels, around the 3-fold symmetry axes of ferritin protein cages, were narrower in D127E compared to WT for both the Mg2+ and Co2+ + Mg2+ structures (Figs. 4C&F, Table 3). Since the minimization of fluctuations in ion channels might be caused by the high divalent metal ion concentrations in the crystallization solutions, energy minimizations (Fig. S2) were performed on the ferritin WT and D127E ion channel structures comparing the structures with and without metalions (Fig. S2). In the absence of metal ions in ferritin WT, the size of the ion channel constriction, the inter-carboxylate distances, the intra-carboxylate distances and the carboxylate conformations are all very similar to those of WT ferritin protein structures with metal ions present (PDB 3KA3 and 3KA4) (Table 3). Moreover, energy minimized structures of both ferritin WT and D127E variant were similar whether or not metal ions were present (Fig. S2). Therefore, the narrower channel diameter created by lengthening the carboxylate side chain of residue 127 in the aspartate substitution by glutamate contribute toward the impedance of Fe2+ transit through the 3-fold ion channels in ferritin D127E.
Table 3. Ferritin ion channel diameters in WT and D127E protein cages.
Comparisons of the shortest intrasubunit and intersubunit distances between oxygen atoms (from center to center) of carboxylates in residues 127 and 130, which point into the ion channels; ion channel/pore diameters are shown in parenthesis. The absolute values of the pore diameters are computed, after taking into account the van der Waals radii of the oxygen atoms (1.52 Å), from the inscribed circle between three oxygen atoms of three carboxylates, one from each subunit.
| Protein (PDB) | Intersubunit carboxylate distances (Å) | Intrasubunit carboxylate distances (Å) | ||
|---|---|---|---|---|
|
|
||||
| 130 – 130 | 127 –127 | 130 – 127 | 130 – 127 | |
|
| ||||
|
WT + Mg2+ (3KA3) |
4.6 (2.3) |
6.3 (4.3) |
4.2 | 6.2 |
|
| ||||
|
WT + Co2+ (3KA4) |
4.7 (2.4) |
6.6 (4.6) |
4.3 | 6.3 |
|
| ||||
|
D127E + Mg2+ (4LPM) |
3.6 (1.2) |
3.3 (0.8) |
3.1 | 3.2 |
|
| ||||
|
D127E + Co2+ (4LPN) |
3.5 (1.0) |
3.1 (0.6) |
2.9 | 2.9 |
|
| ||||
|
aWT + Mg2+ (1MFR) |
3.9 (1.5) |
5.6 (3.5) |
3.8 | 4.6 |
No divalent metal ions were detectable in the 3-fold ion channels of an older, lower resolution (2.8Å) ferritin structure (PDB 1MFR),[43] in which the channel structure (carboxylate conformation) was similar to WT structures (PDB:3KA3 and 3KA4).
Protein structures obtained for ferritin WT and D127E were derived from X-ray diffraction data of high quality. Metal ion positions were assigned based on the clear spherical density for the Mg2+ ions in the electron density maps, the quality of the anomalous data for Co2+ ions collected at the Co-edge (Fig. S3). Electron density for the side chains within the vicinity of the metal ion sites is clearly defined. Moreover, the B-factors for the metal ions are relatively low (26 Å2 and 20 Å2 for the Mg2+, and Co2+ + Mg2+ structures, respectively, Table 2), which also suggests there is little positional movement in metal ions among each subunit of the ferritin 24-subunit nanocage or from multiple nanocages packed within the crystal lattice. In ferritin D127E protein crystals, the metal ions are in similar positions in the 3-fold pore for structures with Mg2+, and Co2+ + Mg2+ (Figure 4B&E), in spite of the loss of normal, solution enzyme activity with the Fe2+ substrate.
Ferritin D127E alters active site metal binding and fixes the conformation of transfer residue
Metal substrate binding in the enzyme sites of ferritin protein cages (Fe2+/O2 oxidoreductase sites, also called ferroxidase sites) differ between ferritins D127E and WT (Fig. 5) in Mg2+ cocrystal structures. In ferritin D127E there is one Mg2+ ion (Mg8) bound in the ferritin di-Fe2+ substrate site and two additional Mg2+ ions (Mg6 and Mg7) bound at other sites en route to the enzyme centers. The ferritin D127E Mg2+ binding residues at the enzyme center are the same as those of WT ferritin, observed by VTVH MCD[29] and in some protein crystal structures,[22, 25, 29, 30] where the metal ion is bound to D/S140, Q137, E103 and E58. The other Mg2+ binding residues Q137, E136, D140, E103 and E57 along with several coordinating waters (Fig. 5B) binding the other two Mg2+ ions observed near, but not bound to the same set of active site ligands (Fig. 5B) in WT ferritin from the same crystallization condition (Fig. 5A). Another distinction of metal-ferritin D127E interactions is the location of Mg8, with 50% occupancy; (Mg8) is shifted by 0.8 Å toward residue E103 compared to WT (Fig. 5C). Moreover, an additional water molecule coordinates Mg7 and Mg8 in ferritin D127E (Fig. 5B). Of note, the most profound difference between the WT and D127E Mg2+ ferritin cocrystal structures at the ferroxidase sites is the lack of an alternate conformation in the D127E variant for the Fe2+ transfer residue E136, on the path between the ion channel exits and the enzyme sites, which is observed in the WT structure.
Figure 5. (A-F): Structural and conformational comparisons of Fe2+ transfer and Fe2+/O2 oxidoreductase sites in WT and the D127E ferritin protein cages.
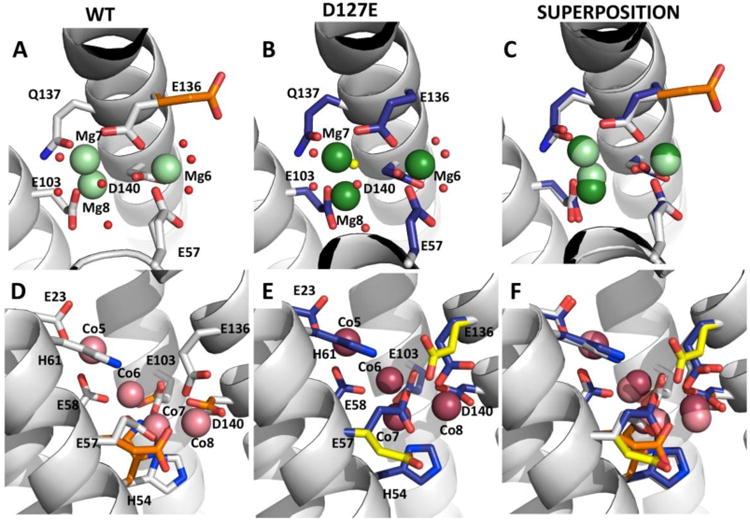
E57 and E136 are transfer residues. Helices are shown as ribbon representation and waters are shown as small red spheres. A-C. Side views of the Mg2+ bound ferritin cocrystal structures A. WT ferritin structure (PBD code: 3KA3), where carbon, nitrogen and oxygen atoms in white, blue and red stick, respectively, Mg2+ ions represented as pale green spheres, and alternate WT side-chain conformations carbons are colored orange. B. D127E ferritin structure, where carbon atoms are shown in carbon, nitrogen and oxygen atoms in dark blue, blue and red stick, respectively, Mg2+ ions represented as dark green spheres, and the extra water characteristic of the D127E ferritin variant is a yellow sphere. C. Superposition of WT and D127E Mg2+ bound structures. D-F. Side view of Co2+ bound ferritin cocrystal structures. D. WT ferritin structure (PDB code: 3KA4), carbon, nitrogen and oxygen atoms in white, blue and red stick, respectively, Co2+ ions represented as pale pink spheres, and alternate side-chain conformations carbons are colored orange. E. D127E ferritin structure, where carbon, nitrogen and oxygen atoms in dark blue, blue and red stick, respectively, Co2+ ions represented as dark pink spheres, and alternate D127E side-chain conformations carbons are colored yellow. F. Superimposition of WT and D127E ferritin Co2+ bound structures.
Co2+ binding at ferritin D127E enzymatic sites in protein-metal ion cocrystal structures of ferritin D127E, a metal ion proxy chemically more similar to Fe2+ than Mg2+, was similar, although not identical to WT ferritins (Fig. 5D & E); all 4 Co2+ ions could be superimposed (Fig. 5F). However, the Co6-H54 ligand interaction in WT is missing in ferritin D127E and Co7 is coordinated to an additional water molecule and E58 but lacks E57 and D140 ligand interactions. Otherwise the orientation of the other Co2+ binding residues is similar in D127E and WT structures maintaining a similar coordination environment (Fig. 5F, Table ST2).
Metal ion binding differences, between WT and D127E ferritin structures in the region of ferritin Fe2+ transfer residues and Fe2+/O2 catalytic sites, are illustrated in the superposition (Fig. 5C and 5F); note the differences in side chain orientations as well as metal binding. For example, the alternate conformation of residue E136, on a path between the ion channel exits and the enzyme sites in WT-Mg2+ ferritin cocrystal structures,[22, 23] was absent in D127E ferritin. The change in the conformation of E136 in the Mg2+ ferritin cocrystal structure and the loss of the metal ligand interaction involving D140 in the Co2+ + Mg2+ cocrystal structure could contribute to the loss of enzyme activity in ferritin D127E. The low occupancy of metal ions at the metal substrate binding site in ferritin D127E compared to WT (Table ST1), also emphasizes the impact of ferritin ion channel structure/function on active site function, in spite of the relatively long distance (13Å) between them.
Narrowing ferritin ion channels by the glutamate substitution of conserved aspartate (ferritin D127E) changed the electrostatic potential of the channels
The calculated electrostatic potential along the 3-fold ion channels of D127E ferritin increased compared to WT (Fig. S4). Fe2+ has to traverse the 3-fold ion channel and the cage helices themselves to reach the di-iron enzymatic sites in ferritin subunits,. It is likely that conserved ion channel carboxylates adopt conformations favorable to the formation of transient complexes with the entering Fe2+ along the channel, and, in case of the three E130 residues, which form a constriction favorable to partially dehydrate Fe2+ ions. The Mg2+- ferritin cage protein cocrystal structure is a reasonable model for the electrostatic potential calculations as these structures mimic the intermediates in the passage of Fe2+ through ferritin ion channels. In WT ferritin, the attraction of the active sites for Fe2+ must be greater than the ion channel residues that guide incoming Fe2+ toward them.
To assess the relative interactions we computed the electrostatic potential (Fig. S4) of WT ferritin at the mid-channel constriction (2.3 Å), Glu 130 from each of three ferritin subunits and found a value in WT ferritin similar to an earlier report for the ion channels in horse L ferritin with no enzyme sites [36]. In ferritin D127E, where the internal pores of the ion channel are only 0.8 Å in diameter compared to 4.3 Å in WT (Table 3), the computed electrostatic potential in the ion channels was four times more negative than WT ferritin. When the electrostatic potential in the ion channels in ferritin D127E was compared to that in the ion channels of Dps protein from Listeria innocua, which are miniferritins [20, 37], they were similar. The narrower ion channels, the crowded carboxylates, and the consequent increase in electronegativity in ferritin D127E will all influence Fe2+ transport and, hence, enzyme activity.
Discussion
Self-assembling ferritin protein nanocages protect living cells by converting potentially toxic Fe2+ ions to solid, Fe2O3•H2O minerals containing thousands of iron and oxygen atoms encapsulated by the ferritin protein cage. The ferritin iron concentrates are an essential part of cell metabolism. Access of cytoplasmic reductant to ferritin iron mineral, which is dissolved as Fe2+, is regulated by specific subdomains in ferritin protein cages [4, 6, 38].
Acquisition of external Fe2+ by the enzyme sites within ferritin protein cages is fast and cooperative, reflecting Fe2+ traffic into the protein cage through cage-penetrating, ion channels around the 3-fold symmetry axes of the protein cages (Fig. 1) [1, 11, 12, 27, 39, 40]. Fe2+ acquisition by ferritin occurs when cellular concentrations of iron are in excess of immediate, physiological need. Fe2+ entry and, later, Fe2+ exit after ferritin mineral dissolution, depend on different sets of conserved amino acids in the ion channels of ferritin protein cages [6]. For example, E130 and D127 facilitate entry of Fe2+ into ferritin cages and active site binding, while D122, L134 and L110 facilitate exit/chelation of Fe2+ dissolved from ferritin mineral [7]. During Fe2+ entry into ferritin protein cages and transfer to ferritin cage enzyme sites, residues E136 and E57 within each subunit shuttle Fe2+ from the 8 ion channel exits to active (di-iron oxidoreductase) sites in the middle of each catalytically active subunit; mixtures of active (H) and inactive (L) subunits occur in animal ferritins, while only catalytically active types of subunits occur in plant and microbial ferritins [4, 23]. To achieve the observed, rapid (msec), enzymatically controlled Fe2+ oxidation in ferritins requires coordination among the ion channels, active sites, and channel pore gates in the multiple subunits complemented by conformational flexibility of the intrasubunit residues that shuttle Fe2+ between the ion channel exits and each active site [23]. The conformational flexibility of ferritin ion channel sidechain residues required for such a model of Fe2+ movement from the ferritin protein cage exterior to the inner surface of the protein nanocavity and the enzyme sites is indicated by the alternate side chain conformations observed in mouse L-chain ferritin protein crystals [5]. Fe2+ transport through the narrowest part of the 3-fold ion entry channels in ferritin protein cages also requires partial dehydration/water exchange [24, 32].
The properties of ferritin protein that facilitate ferritin Fe2+/O2 enzyme activity are: 1. Labile coordination chemistry of Fe2+ among ferritin ion channel residues; 2.Conformational flexibility among ion channel residues; 3. Flexibility (“breathing”) of ferritin pores and ion channels; 4. Directed delivery between internal, ion channel exits and the di-iron enzyme sites buried in the subunit 4α-helix bundles. Other amino acid residues in ferritin protein cages facilitate downstream ferric oxy nucleation and mineralization processes [25].
The precision of ferritin ion channel structure required for adequate delivery of the Fe2+ substrate in ferritin enzyme activity (Fe2+/O2 oxidoreductase) is illustrated by the severe enzyme inhibition that occurred by simply lengthening a carboxylate side chain, in the conserved ion channel residue 127, by one – CH2 (Fig 2) [7]. Negative charge density in the ion channels was increased in part, because in ferritin D127E, the longer carboxylate side chain of glutamate was flipped up toward E130 (Fig. 4); the channel dimensions in protein crystals of D127E are so narrow that even fully dehydrated Fe2+ could not pass through (Table 3), which suggests some conformational flexibility occurs in solution. Interestingly, the smaller channel radii in ferritin D127E, compared to ferritin WT, (Table 3), accommodate a larger number of metal ions (Fig 4). In addition to changes in channel charge density the carboxylate side chains of E127 residues in ferritin D127E point upward into the ion channels toward those of E130 and away from the transit carboxylate residue, E136, contrasting with ferritin WT. E136, which has multiple conformations between the ion channel internal exits, and the enzyme sites in ferritin WT is required for Fe2+/O2 enzyme activity(Fig. 4F) [23]. Thus, not only was the negative electrostatic potential of the ion channels increased in D127E ferritin, the molecular Fe2+ transfer links between ferritin ion channels and ferritin active sites, via E136, were disrupted (Fig. 1B and Fig. 5C).
A combination of three changes in ferritin D127E explains the loss of ferritin enzyme activity: 1) decreased ion channel diameters, 2) conformational changes in residues linking the ion channel exits to the enzyme sites and 3) higher –ve electrostatic potential along the ion channels. Each of the Fe2+-protein interactions during Fe2+ movement through D127E ferritin protein ion channels, past ferritin protein cage transfer residues, and to the buried enzyme sites, contrast with cytoplasmic metal ion transporters in which metal ions are weakly held by comparatively flexible residues [41]. The less flexible metal – coordination interactions in ferritin, in contrast to the metal ion transporters, can contribute to the directionality of Fe2+ ion movement within ferritin protein cages. Increased iron release from D127E ferritin likely reflects changed access of the external reductant to the mineral [17, 42] or more rapid Fe2+ exit, using the presumed path of the ion channels.
The unidirectional nature of the decreased Fe2+ ion flux in ferritin D127E indicates that ferritin ion channel size and flexibility constraints contribute to ion channel electrostatics and ion distribution to other ferritin cage residues. Particularly important in ferritin ion channels, is the regulatory role of conserved carboxylate side chains, which are clustered through contributions of the three subunits that form the ion channel. This important structural feature provides a functional rationale for the 3-fold symmetry structure integral to ferritin protein cages. Ferritin Fe2+ ion channels control entry of Fe2+ substrate into ferritin cages for Fe2+/O2 enzymatic activity, iron-oxy mineral formation and Fe2+ exit after reduction and dissolution of the ferritin caged iron mineral. D127 therefore is an important part of the specific delivery system for Fe2+ substrate to the ferritin enzyme site. In ferritin D127E, when this linkage was broken, activity was disrupted because controlled trafficking of Fe2+ to the multiple active sites was lost. The ideas developed from studying ion channel variants in a eukaryotic ferritin model protein and caged/template nanomineral synthesis add to the understanding of ion transport mechanisms as well as elucidating details of iron ion transport in the life-supporting ferritin protein superfamily.
Supplementary Material
Acknowledgments
We thank Dr. Francesco Oteri, Dr. Ho Leung Ng and Dr. Anshuman Dixit for helpful discussions. We also thank the Advanced Light Source (ALS) at Berkeley National Laboratories and Stanford Synchrotron Radiation Light source (SSRL) for their invaluable help in data collection.
Funding Source: This work was supported by the CHORI Partners and National Institutes of Health Grants DK20251 (to E.C.T, R.K.B), AI081161 (to C.W.G) and DST-INSPIRE Faculty Award (to R.K.B).
Abbreviations
- DFP
diferric peroxo
- WT
wild type
- di-Fe2+/O2 center
oxidoreductase or ferroxidase center (Fox Center)
Footnotes
Structural Coordinates: Placed in the RCSB Protein Data bank. PDB ID codes are 4LPM and 4LPN.
Supporting information: Supporting information is uploaded as separate file.
References
- 1.Treffry A, Zhao Z, Quail MA, Guest JR, Harrison PM. Biochemistry. 1995;34:15204–15213. doi: 10.1021/bi00046a028. [DOI] [PubMed] [Google Scholar]
- 2.Zhao Z, Treffry A, A Quail M, R Guest J, M Harrison P. Journal of the Chemical Society, Dalton Transactions. 1997:3977–3978. [Google Scholar]
- 3.Chasteen ND, Harrison PM. J Struct Biol. 1999;126:182–194. doi: 10.1006/jsbi.1999.4118. [DOI] [PubMed] [Google Scholar]
- 4.de Val N, Declercq JP, Lim CK, Crichton RR. Journal of inorganic biochemistry. 2012;112:77–84. doi: 10.1016/j.jinorgbio.2012.02.031. [DOI] [PubMed] [Google Scholar]
- 5.Granier T, Langlois d'Estaintot B, Gallois B, Chevalier JM, Precigoux G, Santambrogio P, Arosio P. J Biol Inorg Chem. 2003;8:105–111. doi: 10.1007/s00775-002-0389-4. [DOI] [PubMed] [Google Scholar]
- 6.Theil EC, Behera RK, Tosha T. Coord Chem Rev. 2013;257:579–586. doi: 10.1016/j.ccr.2012.05.013. [DOI] [PMC free article] [PubMed] [Google Scholar]
- 7.Haldar S, Bevers LE, Tosha T, Theil EC. J Biol Chem. 2011;286:25620–25627. doi: 10.1074/jbc.M110.205278. [DOI] [PMC free article] [PubMed] [Google Scholar]
- 8.Jutz G, van Rijn P, Santos Miranda B, Boker A. Chemical reviews. 2015;115:1653–1701. doi: 10.1021/cr400011b. [DOI] [PubMed] [Google Scholar]
- 9.Pozzi C, Di Pisa F, Lalli D, Rosa C, Theil E, Turano P, Mangani S. Acta crystallographica. 2015;71:941–953. doi: 10.1107/S1399004715002333. [DOI] [PMC free article] [PubMed] [Google Scholar]
- 10.Honarmand Ebrahimi K, Hagedoorn PL, Hagen WR. Chemical reviews. 2015;115:295–326. doi: 10.1021/cr5004908. [DOI] [PubMed] [Google Scholar]
- 11.Fetter J, Cohen J, Danger D, Sanders-Loehr J, Theil EC. Journal of Biological Inorganic Chemistry. 1997;2:652–661. [Google Scholar]
- 12.Hwang J, Krebs C, Huynh BH, Edmondson DE, Theil EC, Penner-Hahn JE. Science. Vol. 287. New York, N.Y: 2000. pp. 122–125. [DOI] [PubMed] [Google Scholar]
- 13.Pereira AS, Small W, Krebs C, Tavares P, Edmondson DE, Theil EC, Huynh BH. Biochemistry. 1998;37:9871–9876. doi: 10.1021/bi980847w. [DOI] [PubMed] [Google Scholar]
- 14.Watt RK. Chembiochem. 2013;14:415–419. doi: 10.1002/cbic.201200783. [DOI] [PubMed] [Google Scholar]
- 15.Wong SG, Grigg JC, Le Brun NE, Moore GR, Murphy ME, Mauk AG. The Journal of biological chemistry. 2015;290:3732–3739. doi: 10.1074/jbc.M114.623082. [DOI] [PMC free article] [PubMed] [Google Scholar]
- 16.Moenne-Loccoz P, Krebs C, Herlihy K, Edmondson DE, Theil EC, Huynh BH, Loehr TM. Biochemistry. 1999;38:5290–5295. doi: 10.1021/bi990095l. [DOI] [PubMed] [Google Scholar]
- 17.Chiancone E, Ceci P. Biochim Biophys Acta. 2010;1800:798–805. doi: 10.1016/j.bbagen.2010.01.013. [DOI] [PubMed] [Google Scholar]
- 18.Lalli D, Turano P. Acc Chem Res. 2013;46:2676–2685. doi: 10.1021/ar4000983. [DOI] [PubMed] [Google Scholar]
- 19.Ferreira C, Bucchini D, Martin ME, Levi S, Arosio P, Grandchamp B, Beaumont C. J Biol Chem. 2000;275:3021–3024. doi: 10.1074/jbc.275.5.3021. [DOI] [PubMed] [Google Scholar]
- 20.Ceci P, Di Cecca G, Falconi M, Oteri F, Zamparelli C, Chiancone E. J Biol Inorg Chem. 2011;16:869–880. doi: 10.1007/s00775-011-0784-9. [DOI] [PubMed] [Google Scholar]
- 21.Khare G, Gupta V, Nangpal P, Gupta RK, Sauter NK, Tyagi AK. PloS one. 2011;6:e18570. doi: 10.1371/journal.pone.0018570. [DOI] [PMC free article] [PubMed] [Google Scholar]
- 22.Tosha T, Ng HL, Bhattasali O, Alber T, Theil EC. Journal of the American Chemical Society. 2010;132:14562–14569. doi: 10.1021/ja105583d. [DOI] [PMC free article] [PubMed] [Google Scholar]
- 23.Behera RK, Theil EC. Proc Natl Acad Sci USA. 2014;111:7925–7930. doi: 10.1073/pnas.1318417111. [DOI] [PMC free article] [PubMed] [Google Scholar]
- 24.Barnes CM, Theil EC, Raymond KN. Proc Natl Acad Sci USA. 2002;99:5195–5200. doi: 10.1073/pnas.032089399. [DOI] [PMC free article] [PubMed] [Google Scholar]
- 25.Bertini I, Lalli D, Mangani S, Pozzi C, Rosa C, Theil EC, Turano P. Journal of the American Chemical Society. 2012;134:6169–6176. doi: 10.1021/ja210084n. [DOI] [PMC free article] [PubMed] [Google Scholar]
- 26.Ruvinsky AM, Vakser IA, Rivera M. The Journal of chemical physics. 2014;140:115104. doi: 10.1063/1.4868229. [DOI] [PMC free article] [PubMed] [Google Scholar]
- 27.Laghaei R, Kowallis W, Evans DG, Coalson RD. The journal of physical chemistry. 2014;118:7442–7453. doi: 10.1021/jp500198u. [DOI] [PubMed] [Google Scholar]
- 28.Tosha T, Behera RK, Ng HL, Bhattasali O, Alber T, Theil EC. J Biol Chem. 2012;287:13016–13025. doi: 10.1074/jbc.M111.332734. [DOI] [PMC free article] [PubMed] [Google Scholar]
- 29.Schwartz JK, Liu XS, Tosha T, Theil EC, Solomon EI. Journal of the American Chemical Society. 2008;130:9441–9450. doi: 10.1021/ja801251q. [DOI] [PMC free article] [PubMed] [Google Scholar]
- 30.Liu X, Theil EC. Proc Natl Acad Sci USA. 2004;101:8557–8562. doi: 10.1073/pnas.0401146101. [DOI] [PMC free article] [PubMed] [Google Scholar]
- 31.Otwinowski Z, Minor W. Elsevier. 1997:307–326. doi: 10.1016/S0076-6879(97)76066-X. [DOI] [PubMed] [Google Scholar]
- 32.Adams PD, Afonine PV, Bunkoczi G, Chen VB, Davis IW, Echols N, Headd JJ, Hung LW, Kapral GJ, Grosse-Kunstleve RW, McCoy AJ, Moriarty NW, Oeffner R, Read RJ, Richardson DC, Richardson JS, Terwilliger TC, Zwart PH. Acta crystallographica. 2010;66:213–221. doi: 10.1107/S0907444909052925. [DOI] [PMC free article] [PubMed] [Google Scholar]
- 33.Emsley P, Lohkamp B, Scott WG, Cowtan K. Acta crystallographica. 2010;66:486–501. doi: 10.1107/S0907444910007493. [DOI] [PMC free article] [PubMed] [Google Scholar]
- 34.DeLano WL. version 1.3r1. Schrödinger, LLC.; New York: 2010. [Google Scholar]
- 35.Jones T, Spencer R, Walsh C. Biochemistry. 1978;17:4011–4017. doi: 10.1021/bi00612a021. [DOI] [PubMed] [Google Scholar]
- 36.Takahashi T, Kuyucak S. Biophys J. 2003;84:2256–2263. doi: 10.1016/S0006-3495(03)75031-0. [DOI] [PMC free article] [PubMed] [Google Scholar]
- 37.Bellapadrona G, Stefanini S, Zamparelli C, Theil EC, Chiancone E. J Biol Chem. 2009;284:19101–19109. doi: 10.1074/jbc.M109.014670. [DOI] [PMC free article] [PubMed] [Google Scholar]
- 38.Liu X, Theil EC. Acc Chem Res. 2005;38:167–175. doi: 10.1021/ar0302336. [DOI] [PubMed] [Google Scholar]
- 39.Moënne-Loccoz P, Krebs C, Herlihy K, Edmondson DE, Theil EC, Huynh BH, Loehr TM. Biochemistry. 1999;38:5290–5295. doi: 10.1021/bi990095l. [DOI] [PubMed] [Google Scholar]
- 40.Bou-Abdallah F, Zhao G, Biasiotto G, Poli M, Arosio P, Chasteen ND. J Am Chem Soc. 2008;130:17801–17811. doi: 10.1021/ja8054035. [DOI] [PMC free article] [PubMed] [Google Scholar]
- 41.Allen TW, Andersen OS, Roux B. J Gen Physiol. 2004;124:679–690. doi: 10.1085/jgp.200409111. [DOI] [PMC free article] [PubMed] [Google Scholar]
- 42.Liu XS, Patterson LD, Miller MJ, Theil EC. J Biol Chem. 2007;282:31821–31825. doi: 10.1074/jbc.C700153200. [DOI] [PubMed] [Google Scholar]
- 43.Ha Y, Shi D, Small GW, Theil EC, Allewell NM. J Biol Inorg Chem. 1999;4:243–256. doi: 10.1007/s007750050310. [DOI] [PubMed] [Google Scholar]
Associated Data
This section collects any data citations, data availability statements, or supplementary materials included in this article.