

Abstract
The Kv2 family of voltage-gated potassium channel α subunits, comprising Kv2.1 and Kv2.2, mediate the bulk of the neuronal delayed rectifier K+ current in many mammalian central neurons. Kv2.1 exhibits robust expression across many neuron types and is unique in its conditional role in modulating intrinsic excitability through changes in its phosphorylation state, which affect Kv2.1 expression, localization, and function. Much less is known of the highly related Kv2.2 subunit, especially in forebrain neurons. Here, through combined use of cortical layer markers and transgenic mouse lines, we show that Kv2.1 and Kv2.2 are localized to functionally distinct cortical cell types. Kv2.1 expression is consistently high throughout all cortical layers, especially in layer (L) 5b pyramidal neurons, whereas Kv2.2 expression is primarily limited to neurons in L2 and L5a. In addition, L4 of primary somatosensory cortex is strikingly devoid of Kv2.2 immunolabeling. The restricted pattern of Kv2.2 expression persists in Kv2.1-KO mice, suggesting distinct cell- and layer-specific functions for these two highly related Kv2 subunits. Analyses of endogenous Kv2.2 in cortical neurons in situ and recombinant Kv2.2 expressed in heterologous cells reveal that Kv2.2 is largely refractory to stimuli that trigger robust, phosphorylation-dependent changes in Kv2.1 clustering and function. Immunocytochemistry and voltage-clamp recordings from outside-out macropatches reveal distinct cellular expression patterns for Kv2.1 and Kv2.2 in intratelencephalic and pyramidal tract neurons of L5, indicating circuit-specific requirements for these Kv2 paralogs. Together, these results support distinct roles for these two Kv2 channel family members in mammalian cortex.
SIGNIFICANCE STATEMENT Neurons within the neocortex are arranged in a laminar architecture and contribute to the input, processing, and/or output of sensory and motor signals in a cell- and layer-specific manner. Neurons of different cortical layers express diverse populations of ion channels and possess distinct intrinsic membrane properties. Here, we show that the Kv2 family members Kv2.1 and Kv2.2 are expressed in distinct cortical layers and pyramidal cell types associated with specific corticostriatal pathways. We find that Kv2.1 and Kv2.2 exhibit distinct responses to acute phosphorylation-dependent regulation in brain neurons in situ and in heterologous cells in vitro. These results identify a molecular mechanism that contributes to heterogeneity in cortical neuron ion channel function and regulation.
Keywords: electrophysiology, immunohistochemistry, localization, modulation, neocortex, network
Introduction
Neurons within the neocortex are arranged in a laminar architecture composed broadly of six layers, and they contribute to the input, processing, or output of sensory and motor signals in a layer-specific manner (Martin, 2002). Mirroring their differences in location within a cortical layer, neurons of different layers express diverse populations of ion channels and thus possess distinct intrinsic membrane properties that regulate their excitability (Mason and Larkman, 1990; Toledo-Rodriguez et al., 2004; Vacher et al., 2008; Khazen et al., 2012). Understanding ion channel expression patterns of neurons within different cortical layers is essential to understanding their intrinsic excitability and how information is processed within and between layers of the cortex. In particular, the localization and function of voltage-gated potassium or Kv channels can dramatically influence the excitability and function of individual neurons (Trimmer, 2015).
Among Kv channels, the voltage-gated potassium channel subunit Kv2.1 is unusual in its broad and robust expression in neurons across mammalian brain (Trimmer, 1991; Hwang et al., 1993; Du et al., 1998). In neocortex, in situ hybridization (ISH) analyses and single-cell RT-PCR revealed widespread and relatively homogenous expression of Kv2.1 mRNA across cortical layers (Drewe et al., 1992; Hwang et al., 1992; Guan et al., 2007). Immunohistochemical analyses of Kv2.1 expression (Trimmer, 1991; Hwang et al., 1993; Maletic-Savatic et al., 1995; Rhodes et al., 1995; Rhodes et al., 2004; Mandikian et al., 2014) yielded similar results, although detailed analysis of Kv2.1 cortical expression has not been performed. Functionally, Kv2.1 underlies the bulk of the delayed-rectifier potassium current (IK) in diverse types of neurons, making it a key regulator of intrinsic excitability (Murakoshi and Trimmer, 1999; Du et al., 2000; Malin and Nerbonne, 2002; Liu and Bean, 2014). High levels of neuronal activity lead to dephosphorylation of Kv2.1 and corresponding changes in its subcellular localization and voltage-dependent gating, which have been linked to homeostatic suppression of neuronal excitability (Misonou et al., 2005; Mohapatra et al., 2009). Conversely, in conditions of normal activity, Kv2.1 facilitates high-frequency firing (Guan et al., 2013; Liu and Bean, 2014), suggesting that Kv2.1 can either decrease or increase neuronal activity depending on a cell's firing history.
In general, less is known about Kv2.2. ISH and single-cell RT-PCR analyses show a more restricted localization relative to Kv2.1 (Hwang et al., 1992; Guan et al., 2007). Initial immunohistochemistry studies demonstrated striking differences in cellular and subcellular patterns of Kv2.1 and Kv2.2 expression (Hwang et al., 1993; Maletic-Savatic et al., 1995); however, a recent study revealed that these results were confounded by the use of Abs generated against a variant sequence of Kv2.2 the biological relevance of which is unclear (Kihira et al., 2010). Kv2.2 exhibits a subcellular localization remarkably similar to that of Kv2.1, being present in large clusters on the soma and proximal dendrites (Kihira et al., 2010). This study also noted that Kv2.1 and Kv2.2 expression are not uniform across cortical neurons; however, the specific neuronal populations that express these Kv2 paralogs were not investigated. Functionally, Kv2.2 facilitates high-frequency firing in auditory neurons (Johnston et al., 2008), as well as activity of GABAergic interneurons in the basal forebrain (Hermanstyne et al., 2010) and KO of Kv2.2 leads to disrupted sleep–wake cycles (Hermanstyne et al., 2013). Whether Kv2.2 is subjected to dynamic, activity-dependent regulation through changes in phosphorylation, as is Kv2.1, has not been addressed.
Here, we use a set of recently generated, KO-validated Abs and a strategic battery of immunohistochemical markers and transgenic mouse lines to define the cell- and layer-specific expression of Kv2.1 and Kv2.2 in mammalian neocortex. We also investigate whether Kv2.2 is regulated by stimuli that lead to dephosphorylation-dependent changes in Kv2.1 localization and function in both cortical neurons in situ and in heterologous cells expressing recombinant Kv2.2. Finally, we show that the expression of Kv2.1 and Kv2.2 is associated with distinct efferent pathways. Together, these results suggest independent roles for these highly related Kv2 channel paralogs in cortical function and plasticity.
Materials and Methods
Antibodies.
See Table 1 for detailed descriptions of Abs used in this study.
Table 1.
Antibody information
| Antigen and antibody name | Species/isotype/immunogen | Manufacturer information | Concentration used |
|---|---|---|---|
| Kv2.1 (L61C/30) | Mouse IgG1 mAb binds within aa 595–616 | In-house (Trimmer laboratory), RRID:AB_2532100 | 1:5 tissue culture supernatant |
| Kv2.1 (K89/34R) | Mouse IgG2a mAb binds within aa 837–853 | In-house (Trimmer laboratory), recombinant mouse monoclonal antibody expressed in HEK cells RRID: AB_2315768 | 1:2 tissue culture supernatant |
| Kv2.1 (K89/34) | Mouse IgG1 mAb binds within aa 837–853 | NeuroMab catalog #73-014 RRID:AB_10672253 | 10 μg/ml purified |
| Kv2.1 (L80/21) | Mouse IgG3 mAb binds within aa 837–853 | NeuroMab catalog #73-315, RRID:AB_2315862 | 1:2 tissue culture supernatant |
| Kv2.2 (N372B/1) | Mouse IgG1 mAb binds within aa 764–907 Species reactivity with mouse, rat, ferret, macaque and human | NeuroMab catalog #73-369, RRID:AB_2315869 | 1:5 tissue culture supernatant |
| Kv2.2 (N372C/51) | Mouse IgG1 mAb binds within aa 717–763 | NeuroMab catalog #73-358, RRID:AB_2315865 | 10 μg/ml (LM) |
| 1 μg/ml (EM) purified | |||
| Kv2.2 (N372B/60) | Mouse IgG2b mAb binds within aa 764–907 species reactivity with mouse and rat | NeuroMab catalog #73-360, RRID:AB_2315867 | 1:5 tissue culture supernatant |
| Mortalin/Grp 75 (N52A/42) | Mouse IgG1 mAb | NeuroMab catalog #73-127, RRID:AB_10674108 | 1:20 tissue culture supernatant |
| GFP (N86/38) | Mouse IgG2a mAb binds within aa 1–238 (full-length) | NeuroMab catalog #73-131, RRID:AB_2313651 | 1:5 tissue culture supernatant |
| vGlut2 (N29/29) | Mouse IgG1 mAb binds within aa 501–582 | NeuroMab catalog #75-067, RRID:AB_2239153 | 1:5 tissue culture supernatant |
| Cux1 | Rabbit pAb, binds within aa 1111–1332 | Santa Cruz Biotechnology catalog #sc-13024, RRID:AB_2261231 | 0.4 μg/ml purified |
| Ctip2 | Rat IgG2a mAb, binds within aa 1–150 | Abcam catalog #ab18465, RRID:AB_2064130 | 0.5 μg/ml purified |
| Satb2 | Mouse IgG1 mAb, binds within C-terminus | Abcam catalog #ab51502, RRID:AB_882455 | 0.1 μg/ml purified |
Animals.
All animal use procedures were performed in strict accordance with the Guide for the Care and Use of Laboratory Animals of the National Institutes of Health (NIH) and were approved by the University of California–Davis (UC-Davis) and the University of Tennessee Health Science Center Institutional Animal Care and Use Committees. Mice and rats were maintained under standard light–dark cycles and allowed to feed and drink ad libitum. Kv2.1-KO mice (RRID:IMSR_MGI:3806050) have been described previously (Jacobson et al., 2007; Speca et al., 2014) and were generated from breeding of Kv2.1+/− mice that had been backcrossed on the C57BL/6J background (RRID:IMSR_JAX:000664) such that all experiments with Kv2.1-KO mice used WT littermates as controls. Kv2.2-KO mice (Hermanstyne et al., 2010; Hermanstyne et al., 2013) were obtained from Drs. Tracey Hermanstyne and Jeanne Nerbonne. All Kv2.2-KO mice used here were obtained from homozygotic crosses. Both male and female mice were used, all >10 weeks old. Sprague Dawley rats (female 200–300 g, Charles River Laboratories) were all >15 weeks old. We also studied layer 5 (L5) neurons from two BAC lines of mice (Swiss Webster background), which were originally obtained from the Mutant Mouse Regional Resource Centers of the GENSAT project. The first line was Tg(Etvl-EGFP)BZ192Gsat/Mmucd (Etv1) and the second line was Tg(Glt25d2-EGFP)BN20Gsat/Mmnc (Glt). We have previously characterized the laminar location and firing properties of these mouse lines (Guan et al., 2015). For the original characterization of these BAC lines, see Gong et al. (2007) and Doyle et al. (2008). A more detailed characterization is found in Groh et al. (2010). Slice recordings were performed on juvenile mice from 2 to 4 weeks of age, a time when Kv2.1 and Kv2.2 expression are mostly established (Trimmer, 1993; Maletic-Savatic et al., 1995).
Tracer injections.
Adult male C57/B6J mice (10–12 weeks old) were anesthetized with isoflurane and a small craniotomy was stereotaxically placed above primary somatosensory cortex. A small injection (500 nL) of 10% biotinylated dextran amine (BDA) (3000 MW; Thermo Fisher) dissolved in 0.1 m PBS, pH 7.4, or a modified rabies virus (SADΔG-EGFP) expressing GFP instead of a glycoprotein essential for replication (Wickersham et al., 2007; Osakada and Callaway, 2013) was made unilaterally into the dorsolateral striatum using a glass micropipette (∼40 μm tip). Five to 7 d after the BDA or 3 d after the rabies injection, mice were transcardially perfused and brains were processed for immunolabeling (see below).
Preparation of brain sections.
Mice were briefly anesthetized with 60 mg/kg sodium pentobarbital and then subjected to CO2 inhalation for 2 min in a closed chamber connected to a CO2 gas cylinder to induce ischemic stress in vivo (Misonou et al., 2005). Control mice were anesthetized by pentobarbital (60 mg/kg) without CO2 exposure. Mice were then perfused with 4% formaldehyde (FA) for immunohistochemistry (see below). We have previously shown that CO2 inhalation and global decapitation ischemia exhibit a similar extent of Kv2.1 modulation in vivo (Misonou et al., 2005).
For preparation of brain sections, rats and mice were deeply anesthetized with 60 mg/kg sodium pentobarbital and transcardially perfused with ∼5 ml PBS (150 mm NaCl, 10 mm Na-phosphate buffer, pH 7.4) containing 10 U/ml heparin, followed by ∼30 ml ice-cold 4% FA (freshly prepared from PFA) in 0.1 m sodium phosphate buffer, pH 7.4 (0.1 m PB). The brains were removed and cryoprotected for 24 h in 10% sucrose and then for 24–48 h in 30% sucrose in 0.1 m PB. Perfusion-fixed and cryoprotected ferret brains were gifts from the laboratory of our late colleague, Dr. Barbara Chapman. Fresh-frozen macaque samples were a gift from the laboratory of our late colleague, Dr. Edward G. Jones. Fresh-frozen human brain samples (49.5-year-old Caucasian male, 5 h postmortem interval) were obtained from the Eunice Kennedy Shriver National Institute of Child Health and Human Development Brain and Tissue Bank for Developmental Disorders (NICHD contract HHSN275200900011C, reference NO1-HD-9-0011). Samples from the visual cortex of human and macaque were thawed in 4% FA, freshly prepared from PFA, in 0.1 m PB, pH 7.4, fixed for 45 min at 4°C, and cryoprotected for 24 h in 10% sucrose and then for 48 h in 30% sucrose. After cryoprotection, all samples were frozen and cut into 30 μm sections on a freezing stage sliding microtome. Sections were collected in 0.1 m PB and processed for immunohistochemistry.
Multiplex immunofluorescence labeling.
Multiplex immunofluorescence labeling was performed essentially as described previously (Manning et al., 2012). In brief, free-floating sections were incubated in 10% goat serum in 0.1 m PB containing 0.3% Triton X-100 (TX-100, vehicle) for 1 h and then incubated 3 h at room temperature (RT) in vehicle containing different combinations of primary Abs. After incubation, sections were washed 3× for 10 min each in 0.1 m PB and incubated for 1 h in vehicle containing affinity-purified species and/or mouse IgG-subclass-specific goat secondary Abs conjugated to Alexa Fluor (Thermo Fisher). Sections were labeled with the DNA-specific dye Hoechst 33258 during the secondary Ab step. Sections were washed 3× for 10 min each in 0.1 m PB, mounted and dried onto gelatin-coated slides, treated with 0.05% Sudan black (EM Sciences) in 70% ethanol for 5 min (Schnell et al., 1999), extensively washed in water, and mounted with Prolong Gold (Thermo Fisher).
Low-magnification images were acquired on Zeiss AxioObserver Z1 microscope using a 10×/0.5 numerical aperture (NA) Fluar objective and an AxioCam MRm digital camera and reconstructed as tiled mosaics using Axiovision 4.0 (Carl Zeiss, RRID:S-ciRes_000111). High-magnification images were acquired on a Zeiss AxioImager M2 microscope using a 40×/0.8 NA plan-Apochromat oil-immersion objective or a 63×/1.40 NA plan-Apochromat oil-immersion objective and an AxioCam MRm digital camera. Optical sections were acquired using an ApoTome 2 structured illumination system (Carl Zeiss). Imaging and postprocessing was performed in Axiovision (Carl Zeiss), ImageJ, and MATLAB (The MathWorks). Super-resolution light microscopy was performed on a Zeiss Elyra system (SR-SIM) using a 100×/1.4 NA plan-Apochromat oil-immersion objective, and Z-stacks were reconstructed with Zen software (Carl Zeiss). Linear adjustments to contrast and brightness were performed using Photoshop (Adobe Systems) or ImageJ. All panels in a given figure were imaged and treated identically unless otherwise noted.
Immunogold labeling and electron microscopy.
Adult mice were anesthetized with sodium pentobarbital and transcardially perfused with 60–80 ml of ice-cold 4% FA (freshly prepared from PFA) with 0.05% glutaraldehyde (Ted Pella) in 0.1 m PB, pH 7.4. Brains were removed and sectioned to 50 μm using a vibratome. Sections were then cryoprotected by sequential incubation in 10% and 20% (w/v) sucrose in 0.1 m PB for 30 min each and finally 25% sucrose/30% glycerol for 1 h. After cryoprotection, sections were freeze-thawed in liquid nitrogen for ∼30 s each and then blocked with 10% goat serum and 0.025% TX-100 in 50 mm TBS at 4°C for 1 h. Free-floating sections were probed with anti-Kv2.2 IgG1 Ab (N372C/51; 1 μg/ml) diluted in vehicle (2% goat serum/50 mm TBS) for 48 h. After Ab incubation, sections were washed with 50 mm TBS 3× for 20 min each and then incubated with 1.4 nm gold-conjugated secondary Abs (Nanoprobes) diluted in vehicle for 12 h at 4°C. Sections were washed at RT 3× for 10 min each with 50 mm TBS, followed by 25 mm PBS. Sections were then postfixed with 1% glutaraldehyde/25 mm PBS for 10 min and washed with Milli-Q water (Millipore) 3× for 5 min each. Silver enhancement was then performed using the HQ silver (Nanoprobes) EM intensification kit. After washing with water 3× for 5 min each and with 0.1 m PB 2× for 10 min each, osmification was performed by treatment with 1% OsO4/PB for 40 min. After the sections were washed with water 3× for 10 min each, sections were counterstained using 1% uranyl acetate for 35 min. Sections were then dehydrated with 50%, 70%, 90%, 95%, and 100% ethanol, followed by 100% propylene oxide. Dehydrated sections were infiltrated with Durcupan resin overnight and cured on glass slides at 60°C for 12–24 h. Regions of interest (ROIs) were excised and re-embedded in Durcupan blocks to be sectioned at 70 nm using an ultramicrotome (Leica). Ultrathin sections were mounted on single-slot copper grids using Pioloform support film and imaged using a CCD camera connected to a Philips CM120 TEM. For immunogold particle counts, intracellular gold particles found within 40 nm of the plasma membrane were considered to be plasma membrane associated. Plasma membrane lengths were measured using ImageJ.
Preparation of cortical and crude brain homogenates.
For immunoblot analyses of Kv2.1 and Kv2.2 expression levels, mice were decapitated without anesthesia, brains removed, and neocortices dissected and homogenized in ice-cold homogenization buffer containing the following: 5 mm PB, pH 7.4, 320 mm sucrose, 100 mm NaF, 500 μm PMSF, and a protease inhibitor mixture (2 μg/ml aprotinin, 2 μg/ml antipain, 1 μg/ml leupeptin, and 10 μg/ml benzamidine). Because the extended postmortem period associated with cortical dissections could affect phosphorylation state, as demonstrated for other phosphoproteins (Gärtner et al., 1998; Oka et al., 2011; Gündisch et al., 2013) including Kv2.1 (Misonou et al., 2005), for analyses of phosphorylation state, we prepared samples from whole mouse brains that were removed and homogenized within a 1 min postmortem period. Whole-brain crude homogenates or crude membrane fractions were prepared from mice that were either briefly anesthetized with sodium pentobarbital (60 mg/kg to match perfused immunohistochemistry samples, procedure described above) and decapitated, or decapitated without anesthesia, respectively. For crude mouse brain membrane preparations, homogenates were centrifuged twice at 750 × g for 10 min at 4°C. The resulting supernatants were mixed and centrifuged at 38,000 × g for 90 min at 4°C and the resulting pellet rehomogenized in homogenization buffer. Homogenates and membranes were then incubated with or without calf intestinal alkaline phosphatase (AP; 100 U/ml; Roche) for 2 h at 37°C and diluted in 1× reducing sample buffer to a concentration of 1 mg/ml.
Immunoblots.
Samples (30 μg of protein/lane) were separated on a 7.5% SDS-PAGE gel and transferred to a nitrocellulose membrane. Lauryl sulfate (L-5750, Sigma-Aldrich) was the form of SDS used in all gel solutions (Shi et al., 1994). Immunoblots were blocked in 4% nonfat dry milk/0.1% Tween 20/TBS (TBS: 20 mm Tris/150 mm NaCl pH 8.0) and probed for Kv2.1 (K89/34), Kv2.2 (N372B/60) and Grp75/Mortalin (N52A/42) using mAbs (clone number in parentheses) obtained from the UC-Davis/NIH NeuroMab Facility (http://neuromab.ucdavis.edu/), a not-for profit supplier of monoclonal antibodies administered through the University of California. Alexa Fluor-conjugated fluorescent secondary Abs (Thermo Fisher) were used to detect bound primary Abs and imaged using a FluorChem Q imager (ProteinSimple). Immunoblots were analyzed using FluorChem software and statistical analysis was performed using StatPlus.
Cell culture and plasmids.
Recombinant rat Kv2.2 in the RBG4 vector (Kihira et al., 2010) was used to generate a serine-to-alanine mutation at the serine 605 site following standard molecular biology methods as described previously (Scannevin et al., 1996; Lim et al., 2000). HEK293T cells, a generous gift from Dr. Vladimir Yarov-Yarovoy, UC-Davis, and originally obtained from Cell Genesis (Eaholtz et al., 1994) were grown on poly-l-lysine-coated coverslips or tissue culture-treated cell culture dishes at 37°C and 5% CO2 in DMEM high glucose medium (Thermo Fisher) supplemented with 10% fetal bovine serum. Cells were transiently transfected with Kv2.1/RBG4 (Shi et al., 1994), Kv2.2/RBG4 (Kihira et al., 2010), Kv2.1-S586A/RBG4 (Lim et al., 2000), Kv2.2-S605A/RBG4 (see above), and empty RBG4 plasmids using Lipofectamine 2000 (Thermo Fisher) according to the manufacturer's instructions. Cells were seeded at 10% confluence, transfected 24 h later (incubated with lipofectamine-containing transfection mixture for 5 h in serum/antibiotic-free culture media, after which the cells were incubated in the serum/antibiotic-containing medium), and left for an additional 36–48 h after transfection before fixation or lysis.
For ionomycin (Inm) treatments, transfected HEK293T cells were washed once with HBSS containing Ca2+/Mg2+ at 37°C, followed by a 15 min incubation in HBSS Ca2+/Mg2+ either with (treated) or without (control) 1 μm Inm at 37°C. For fixed cells, HBSS was removed and cells were fixed in DPBS containing freshly prepared 3% FA plus 4% sucrose for 30 min at 4°C. After 3 washes with DPBS, nonspecific protein binding sites were blocked with Blotto (TBS with 4% w/v nonfat dry milk plus 0.1% TX-100) for 1 h at RT and then incubated with primary Abs for 1 h at RT. After washing 3 times with Blotto, cells were incubated with affinity-purified species and/or mouse IgG-subclass-specific goat secondary Abs conjugated to Alexa Fluor (Thermo Fisher) for 1 h at RT, washed 3× with DPBS, and mounted in ProLong Gold (Thermo Fisher). Cells were labeled with dyes (Hoechst 33258; phalloidin; Thermo Fisher) during the secondary Ab step. To prepare detergent lysates, cells were washed once with ice-cold DPBS and then lysed with ice-cold 1% TX-100-containing buffer and centrifuged at 12,000 × g and the resulting supernatant used as the cell lysate. Aliquots of cell lysates were incubated with and without AP (100 U/ml; Roche) in the presence of 0.1% SDS for 2 h at 37°C.
HEK293 electrophysiology.
HEK293 cells were cultured at 37°C and 5% CO2 in MEM supplemented with 10% fetal bovine serum, 1% penicillin–streptomycin, and 1% nonessential amino acids. HEK293 cells (70% confluent) were transiently transfected with 50 ng of either Kv2.1/RBG4 or Kv2.2/RBG4 and 0.5 μg of GFP (as a transfected cell marker) according to the standard Lipofectamine 2000 (Thermo Fisher) protocol. Sixteen to 24 h after transfection, cells were trypsinized, replated, and used for electrophysiological analysis within 5 h.
Whole-cell current recordings were obtained at room temperature (22–23°C) using an Axopatch-200B amplifier (Molecular Devices) connected to a Digidata 1440 data-acquisition system (Molecular Devices). Current recordings were low-pass filtered, sampled at 1–10 kHz, and command voltages were controlled with the pClamp10 software (Molecular Devices). Patch pipettes were pulled with a laser puller P2000 (Sutter Instruments) from 1.2 mm borosilicate glass (World Precision Instruments), heat polished, and filled with an intracellular solution containing the following (in mm): 110 KCl, 5 K4BAPTA, 5 K2ATP, 1 MgCl2, and 10 HEPES, pH 7.2 adjusted with KOH. Cells were continuously superfused with an extracellular solution containing the following (in mm): 145 NaCl, 4 KCl, 1.8 CaCl2, 1 MgCl2, 10 HEPES, and 10 glucose, pH 7.35 adjusted with NaOH. Series resistances were compensated (80%) and cells were excluded from analysis if voltage errors exceeded 5 mV.
Inm treatments were performed by replacing the bath solution of the recording chamber with 1 μm Inm (Thermo Fisher) dissolved in HBSS with Ca2+/Mg2+ after the whole-cell configuration was obtained. After 10 min, the bath solution was exchanged to the extracellular recording solution and current recordings after Inm treatment were obtained. AP treatments were performed by dissolving 10 U/ml rAPID AP (Roche) in the pipette solution and current recordings after AP treatment were obtained 15–20 min after patch disruption.
Glt and Etv1 brain slices.
Mice were anesthetized with isoflurane until they were areflexive. Briefly, the mouse was placed into a sealed plastic container into which gauze soaked with isoflurane was placed under a fiberglass screen floor. After anesthesia with isoflurane, the mouse was decapitated and the brain was removed and dropped into ice-cold cutting solution bubbled with O2 for 30–60 s. This solution contained the following (in mm): 250 sucrose, 2.5 KCl, 1 NaH2PO4, 11 glucose, 4 MgSO4, 0.1 CaCl2, 0.4 ascorbate, 0.6 sodium pyruvate, and 15 HEPES, pH 7.3–7.4; 300 mOsm/L. The brain was then sliced into 300-μm-thick coronal sections using a vibrating tissue slicer (Vibroslice; Campden Instruments).
Slice recordings.
Slices were placed in a recording chamber on the stage of an Olympus BX50WI upright microscope. Slices were bathed in aCSF bubbled with 95% O2/5% CO2 delivered at 2 ml/min and heated with an in-line heater (Warner Instruments) to 33 ± 1°C (measured with a thermistor in the bath adjacent to the slice). The aCSF contained the following (in mm): 125 NaCl, 3 KCl, 2 CaCl2, 2 MgCl2, 1.25 NaH2PO4, 26 NaHCO3, and 20 glucose, pH 7.4, 310 mOsm. Pharmacological agents were added directly to the aCSF. TTX (0.5 μm) was added to the bath to block Na+ channels. In some experiments, we added 200 μm Cd2+ to block Ca2+ channels. Guangxitoxin-1E (GxTX; Alomone Laboratories) was dissolved directly into aCSF containing 0.25% BSA.
Pyramidal neurons in L5 were visualized with infrared/differential interference contrast (IR/DIC) video microscopy (Dodt and Zieglgänsberger, 1990; Stuart et al., 1993) using a 40× (0.8 NA) Olympus water-immersion objective and an IR-sensitive camera (Olympus OLY-150 or DAGE-MTI). Etv1 or Glt pyramidal cells were visually identified by the presence of EGFP epifluorescence using an FITC filter. Recordings were directed within the main band of EGFP+ cells in L5 in each slice. We switched between IR/DIC and epifluorescence to determine cell type and to obtain a GΩ seal. Electrode position was controlled with Luigs–Neumann manipulators and controller. Whole-cell patch-clamp recordings were acquired using an Axon Multiclamp 700A amplifier (Molecular Devices) and PClamp 9 software. For voltage-clamp recordings, the data were digitized at 10–50 kHz and filtered at 4–10 kHz. We recorded with borosilicate electrodes (Warner G150F: 1.5–3 MΩ in the bath) produced with a horizontal electrode puller (Flaming-Brown P-87; Sutter Instruments). For outside-out voltage-clamp recordings, electrodes were filled with an internal solution containing the following (in mm): 130.5 KMeSO4, 10 KCl, 7.5 NaCl, 2 MgCl2, 10 HEPES, 2 ATP, and 0.2 GTP; 5 mm EGTA was added to the intracellular solution to prevent activation of Ca2+-dependent conductances. Data were collected only from cells forming a 1 GΩ or tighter seal. All reported voltages were corrected by subtracting the measured liquid junction potential (8 mV).
The slice preparation allowed us to record from cell types identified by EGFP but space clamp is a serious issue for whole-cell recordings from dendritic neurons such as pyramidal cells. To allow accurate biophysical measurements of outward K+ currents, we used outside-out macropatches that were formed after break in to whole-cell mode by withdrawing the pipette without additional suction. The patch capacitance was typically 2–4 pF and the Rseries was 5–9 MΩ.
For the Ab perfusion experiments, the same patch was compared before and after exposure to Ab by replacing the pipette solution using a home-made device based upon principles outlined in Tipparaju and Bhatnagar (2007). Outside-out patches are very sensitive to negative pressure, so we used light positive pressure to drive the drug solution out from the perfusion line (∼1.5 mmHg: 20 mm water height, derived from a water-filled u-tube). The recording pipette was filled with the standard internal solution to ∼1/7 of its volume to secure good contact for the Ag-AgCl electrode. During the formation of outside-out patches from cells, we closed the internal solution off from the room air with a three-way valve. After formation of outside-out patches, the valve is opened, allowing communication with room air pressure. The perfusion line has two valves, either of which can control the drug flow. The perfusion tip is placed close to the pipette tip (in the internal). When perfusion starts (added pressure from a syringe), the drug solution moves into the patch and mixes with the original internal solution until most of the empty space in the pipette is filled. When the pipette is removed from the headstage, ∼4/7 to 5/7 of its volume is occupied by the combination of the original and new solution, meaning there is an ∼3:1 to 4:1 drug solution relative to the original internal. The perfusion process usually takes ∼0.5 to 1.5 min, depending on the positive pressure used. For perfusion, we used Teflon tubing with inner diameter (ID) 0.3 mm and outer diameter (OD) 0.6 mm. The front end of the perfusion line is made of quartz microcapillary with OD of ∼0.36 mm and ID 0.03 to 0.08 mm. The quartz microcapillary was fire polished as in Tipparaju and Bhatnagar (2007).
For Ab-induced blockade of Kv2.1, we used pAb Anti-Kv2.1 at 1:100 (Alomone Laboratories; catalog #APC-012, RRID:AB_2040162) in internal solution containing 1% BSA. For Ab-induced blockade of Kv2.2, we used mAb N372B/60 at 10 μg/ml or ∼100 nm, again with 1% BSA. As a control, both Abs were heated to 65°C for 3 h to inactivate them.
For measurements of voltage dependence and kinetics of GxTX-sensitive currents from outside-out macropatches, all recording solutions were as in previous voltage-clamp experiments (33 ± 1°C). Data were obtained at 10 kHz and filtered at 4 kHz. To determine steady-state voltage dependence, a family of 200 ms voltage steps was made from a holding potential of −75 mV to voltages between −50 and +50 mV in 20 mV increments (20 s between sweeps). This protocol was run in control solution without GxTX and repeated after application of 100 nm GxTX. Both solutions contained 0.5 μm TTX. The GxTX-sensitive current was obtained by subtracting traces in GxTX from control traces. Current at 200 ms was converted to conductance by dividing current by driving force (E − EK+; EK+ was calculated as −102 mV from the internal and external K+ concentrations). Conductances were normalized by the maximum conductance and the normalized conductance was plotted as a function of test voltage. These data were fit with a single Boltzmann relationship as follows:
 |
where G is the calculated conductance and V is the step potential. Data from both cell types (Etv1 and Glt) were well fit by a single Boltzmann equation.
To compare activation and inactivation kinetics between cell types, we fit the rising phase and decay phase of currents, each with a single exponential (Eq. 2). A 500 ms step from −75 to 0 mV was used (20 s between steps). GxTX-sensitive currents without a readily observable A-current component (identified as a fast peak in the first 2 ms after step onset in a few recordings) were used to fit the following activation-inactivation equation:
 |
where I(t) represents the GxTX-sensitive current, τ0 is the activation time constant, and τ1 is the inactivation time constant.
Statistics.
Prism (GraphPad) software was used to perform statistical tests on the data obtained from the pyramidal neurons and HEK293 cells. For CV measurements, a one-way randomized block ANOVA (experiments were treated as matched sets to account for experiment-to-experiment variability) with post hoc Tukey's multiple-comparison test was used to determine which individual CV means differed and summary data are presented as across-replicate means ± SEM. For Etv1 and Glt data, a Student's t test was used to compare sample population data between Etv1 and Glt cells and summary data are presented as means ± SEM unless noted otherwise. Paired t tests were used to compare control (Ctl) versus drug effects. We used a one-way ANOVA to compare multiple experimental groups (Etv1, Glt), with post hoc Tukey's multiple-comparison tests to determine which individual means differed. For all tests, p values <0.05 were considered significantly different. Sample population data are represented as histograms of mean ± SEM or scatter plots. Unless otherwise stated, all values are expressed as mean ± SEM.
Results
Highly related Kv2 paralogs show distinct patterns of cortical expression corresponding to neocortical lamina-specific cell types
Recent results suggest that Kv2.1 and Kv2.2 are expressed in partially overlapping patterns in pyramidal neurons of rat neocortex (Kihira et al., 2010). To address comprehensively the overall patterns of expression and localization of Kv2.1 and Kv2.2 in cortical neurons, we used a set of KO-validated Abs, including mAbs with nonoverlapping binding sites on the same target protein, to perform multiplex immunofluorescence labeling of brain sections from adult mammals.
As shown in Figure 1, we first examined labeling for Kv2.1 (green) and Kv2.2 (red) in conjunction with Hoechst 33258 nuclear labeling (blue) in mouse and rat brain sagittal sections (note that in all subsequent examples of Kv2.1 and Kv2.2 double labeling, unless noted otherwise, we use green for Kv2.1 and red for Kv2.2). Kv2.1 and Kv2.2 showed distinct patterns of immunolabeling, as shown by the nonuniformity of the green and red signals (Fig. 1A). These patterns of Kv2.1 and Kv2.2 immunolabeling in cortex correspond to specific cortical layers because they are present in horizontal bands parallel to the pial surface throughout the anterior–posterior axis of the cortex. An especially robust band of Kv2.2 immunolabeling is seen just below the granular layer 4 (L4) granule cells, as marked by the prominent labeling for the blue nuclear dye. A strong band of Kv2.1 immunolabeling is seen just beneath this prominent Kv2.2-positive band. Lamina-specific differences in Kv2 immunolabeling varied across cortical regions. For example, in somatosensory cortex, L4 is markedly devoid of Kv2.2 signal, especially in rat (Fig. 1A, region between arrowheads). Equivalent patterns of immunolabeling for both Kv2.1 and Kv2.2 were also obtained in single labeling experiments showing that the distinct patterns of immunolabeling seen in Figure 1A and throughout the other experiments in this study were not due to interference of binding between Kv Abs (data not shown). Moreover similar results were obtained using two different sets of Kv2.1 and Kv2.2 Abs determined to recognize distinct, nonoverlapping epitopes on their respective target proteins (see Materials and Methods for detailed Ab information), an important consideration for establishing validity of immunolabeling (Rhodes and Trimmer, 2006).
Figure 1.
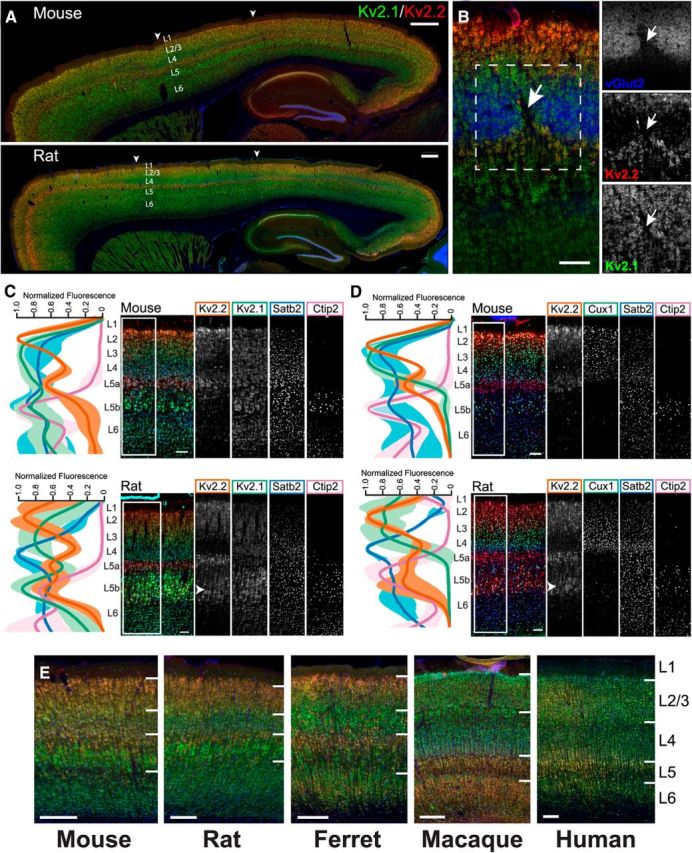
Kv2.1 and Kv2.2 exhibit specific and unique expression patterns in mammalian cortex. A, Mouse and rat sagittal brain sections immunolabeled for Kv2.1 (green) and Kv2.2 (red), with Hoechst (blue) to label nuclei. Arrowheads denote S1, in which L4 is relatively devoid of Kv2.2 immunoreactivity. Scale bars, 500 μm. B, Mouse coronal section of S1 barrel cortex immunolabeled for Kv2.1 (green), Kv2.2 (red), and vGlut2 (blue). Arrow denotes septum between barrels. Scale bar, 100 μm. C, Mouse and rat sagittal sections from S1 immunolabeled for Kv2.1 (green), Kv2.2 (red/orange), Satb2 (L2-6, blue), and Ctip2 (L5b-6, cyan/pink). Line plots depict depth profile of average fluorescence intensity calculated for the region within the rectangle across three animals. Data were smoothed (rolling average, 25 points) and normalized to maximum intensity for each channel in MATLAB. Light, thick lines represent the SD. Note that, whereas Kv2.1 expression is relatively consistent across all cortical layers, Kv2.2 shows strongest expression in layers 2 and 5a. Arrowhead in rat section denotes additional Kv2.2 expression in cells of lower L5. Scale bars, 100 μm. D, Mouse and rat sagittal sections from S1 immunolabeled for Kv2.2 (red/orange), Cux1 (L2-4, green), Satb2 (L2-6, blue), and Ctip2 (L5b-6, cyan/pink). Line plots are constructed as in C. Arrowhead highlights the portion of rat L5b exhibiting high Kv2.2 expression. Scale bars, 100 μm. E, Sections of striate visual cortex from mouse, rat, ferret, macaque, and human immunolabeled for Kv2.1 (green) and Kv2.2 (red) and with Hoechst (blue) to label nuclei. Lines demarcate layer boundaries, which are labeled to the right. Scale bar, 200 μm.
We next determined whether variations in the distribution of Kv2.1 and Kv2.2 were related to the functional cytoarchitecture of the cortex. We used immunolabeling for vGlut2 (blue) to identify thalamocortical terminals in L4 of mouse brain corresponding to the “barrels” of somatosensory cortex (S1) where information from whisker stimulation is received (Wimmer et al., 2010; Fig. 1B). We found that Kv2.1 immunolabeling is relatively high in neurons adjacent to and throughout the barrels. However, labeling for Kv2.2 was mostly absent from the barrel cores themselves, but was high in L5a and, to a lesser extent, in L3 surrounding each of the barrels and extending into the septal regions between the barrels (Fig. 1B, arrows). These results show that variations in Kv2.1 and Kv2.2 cortical expression are associated with the functional cytoarchitecture of the cortex.
To refine our understanding of the laminar organization of Kv2.1 and Kv2.2 in rodent cortex, we next performed multiplex immunolabeling using well established cortical layer markers. Mouse and rat sagittal sections were quadruple labeled in various combinations with Abs against Kv2.1, Kv2.2, and the cortical layer markers Cux1 (L2-4; Nieto et al., 2004), Satb2 (L2-6; Alcamo et al., 2008; Leone et al., 2015) and Ctip2 (L5b-6; Alcamo et al., 2008). As shown in Figure 1C and in the lower-magnification images in Figure 1A, Kv2.1 immunolabeling (Fig. 1C, green) in S1 was fairly consistent across all layers in mouse (Fig. 1C, top), whereas in rat (Fig. 1C, bottom) decreased Kv2.1 signal was observed in L5a and enhanced signal in L5b. Kv2.2 immunolabeling in S1 (Fig. 1C,D, red) was markedly nonuniform across cortical layers, with prominent peaks of signal in L2 and L5a in both mouse and rat. Within L5, Kv2.2 immunolabeling displayed a pattern largely converse to that of Kv2.1 in both mouse and rat, being high in L5a and low in L5b, with the exception that, in rat, an additional band of Kv2.2 labeling was seen in lower L5b (Fig. 1C,D, arrowhead). Consistent with Figure 1, A and B, L4 in both mouse and rat had low levels of Kv2.2 signal.
We next determined whether the distinct laminar pattern of Kv2.1 and Kv2.2 immunolabeling in rodent cortex is common to other mammalian species. We chose to focus on striate visual cortex (V1) because it is more readily identifiable across mammalian species. We immunolabeled sections of V1 from mouse, rat, ferret, macaque, and human for Kv2.1 and Kv2.2 and found clear differences in laminar patterns (Fig. 1E). Interestingly, the patterns of immunolabeling with respect to their laminar position are distinct across all five species. Macaque and human are particularly distinct, with macaque showing high expression of Kv2.2 throughout the deep layers of V1 and both macaque and human showing lower expression in upper layers 2/3 compared with rodent and ferret. The layer-specific patterns of Kv2.1 and Kv2.2 expression in cortex as revealed by these immunolabeling experiments suggest distinct yet conserved requirements for expression of these highly related Kv2 paralogs in cortical neurons.
Lack of compensatory Kv2.2 expression in the Kv2.1-KO suggests independent functions
These distinct and somewhat complementary patterns of Kv2.1 and Kv2.2 expression in cortex raise questions as to possible mechanisms underlying their observed patterns. One possibility involves functional interplay between their respective expression levels, for example, to meet an overall requirement for expression of one or the other Kv2 channel subunit, a model consistent with the observed similarities in function between these two highly-related paralogs when expressed in heterologous cells (Kihira et al., 2010). To address this possibility, we determined whether elimination of one Kv2 isoform affected the cellular expression pattern of the other by performing multiplex immunohistochemistry and immunoblots on brain samples from WT, Kv2.1-KO, and Kv2.2-KO mice.
Figure 2A shows representative images of somatosensory cortex from WT (Fig. 2A, left), Kv2.1-KO (Fig. 2A, middle), or Kv2.2-KO (Fig. 2A, right) mice double labeled for Kv2.1 (Fig. 2A, green) and Kv2.2 (Fig. 2A, red) under identical conditions and imaged at equal exposure. First, it is important to note that the Kv2.1 immunolabeling is eliminated in the Kv2.1-KO and the Kv2.2 labeling in the Kv2.2-KO (note that intense red labeling around the ventricles is nonspecific secondary Ab signal because it is also present in the Kv2.2-KO and in controls lacking primary Ab). As is already apparent from the multicolor panels, but is most evident in the single-label grayscale insets (Fig. 2B), there are no obvious changes in the spatial pattern or the overall intensity of either Kv2.1 or Kv2.2 labeling in response to the elimination of the other paralog. The distinct laminar pattern of cortical Kv2.2 immunolabeling seen in WT mice, being highest in L2 and L5a, remained unchanged in Kv2.1-KO mice. Kv2.1 labeling, already quite broad in WT mice, was also grossly unchanged in the Kv2.2-KO. We also used multiplex immunofluorescence immunoblots to analyze expression levels of Kv2.1 and Kv2.2 in samples prepared from dissected neocortices from these mice (Fig. 2C). Similar to a previous report on whole-brain expression (Speca et al., 2014), we found that in the neocortex there were no significant differences in expression of either Kv2.1 or Kv2.2 between WT mice and the mice in which the expression of their respective paralog is eliminated (Fig. 2D; Kv2.1, p = 0.89; Kv2.2, p = 0.35, independent t test; n = 5).
Figure 2.
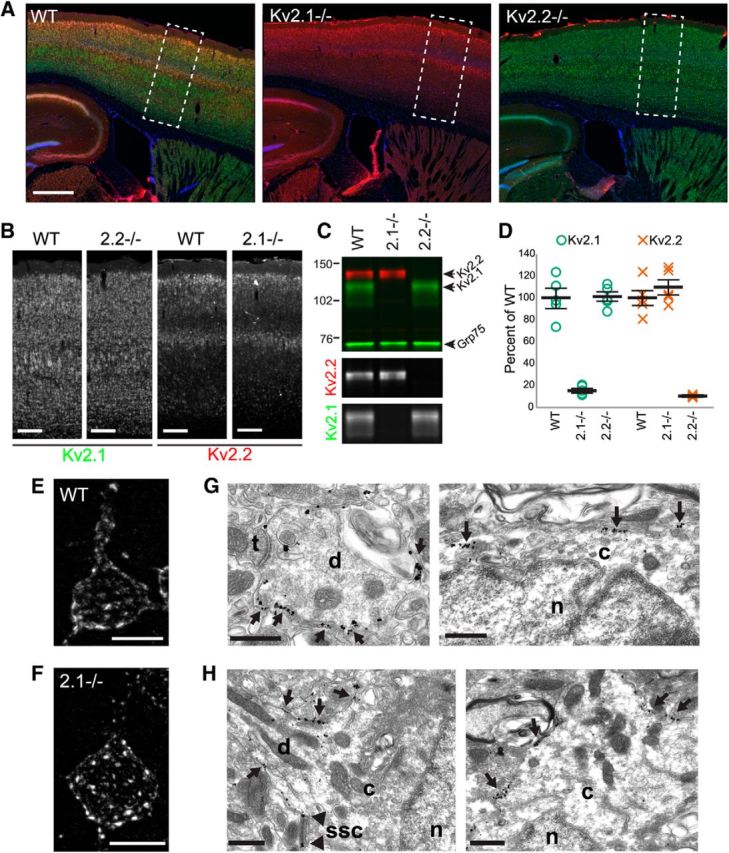
Kv2.2 expression and subcellular localization is maintained in Kv2.1 KO mice. A, WT (left), Kv2.1-KO (Kv2.1−/−, center), and Kv2.2-KO (Kv2.2−/−, right) sagittal sections immunolabeled for Kv2.1 (green) and Kv2.2 (red) and with Hoechst (blue) to label nuclei and imaged at equal exposures. Rectangles outline regions shown in B. Scale bar, 500 μm. B, Grayscale insets from images in A, again at equal exposures (2.2−/− = Kv2.2-KO; 2.1−/− = Kv2.1-KO). Note that Kv2.2 expression is maintained in L2 and L5a in the Kv2.1-KO. Scale bar, 200 μm. C, Example immunoblot of crude neocortical homogenates from WT, Kv2.1-KO (2.1−/−), and Kv2.2-KO (2.2−/−) mice probed for Kv2.1 (top green band), Kv2.2 (red) and Grp75 (bottom green band) as a loading control. Numbers on the left indicate the mobility of molecular weight standards in kilodaltons. Lower grayscale panels show the individual Kv2.2 and Kv2.1 signals extracted from the color immunoblot. D, Summary graph of differences in Kv2.1 and Kv2.2 protein levels in cortex between WT and KO mice. Fluorescence intensity values were background subtracted and normalized to the loading control (Grp75) and then expressed as percentage of total WT signal. Error bars represent the SEM and symbols represent each independent measurement (n = 5 mice per group). Differences in Kv2 expression between WT and KO samples were not statistically significant as evaluated by independent t test (Kv2.1, p = 0.89; Kv2.2, p = 0.35). E, F, High-magnification images of L5a pyramidal neurons from WT (E) and Kv2.1-KO (2.1−/−) mice (F) immunolabeled for Kv2.2. Note that, whereas Kv2.2 clusters in WT mice are plaque like, Kv2.2 clusters in the Kv2.1-KO are more punctate. Scale bars, 10 μm. G, H, Immunogold electron microscopy of Kv2.2 in WT (G) and Kv2.1-KO (H) tissue. Kv2.2 immunogold particles can be seen as discrete clusters (arrows) in the large caliber dendrite (G, left) and the somatic plasma membrane (G, right). The clustered localization of Kv2.2 is not altered in tissue obtained from Kv2.1-KO mice (H). Kv2.2 immunogold particles are seen as clusters (arrows) in the plasma membrane of the proximal dendrite and soma. Immunogold particles can also be seen in close proximity (arrowheads in H, left) to subsurface cisternae (SSC). t, Axon terminal; c, cytoplasm; d, dendrite; n, nucleus; ssc, subsurface cisternae. Scale bars, 500 nm.
Finally we sought to determine whether the subcellular distribution of Kv2.2 is in any way altered after genetic deletion of Kv2.1. We first performed high-magnification imaging to visualize details of Kv2.1 and Kv2.2 clusters. As seen in Figure 2, E and F, L5a pyramidal neurons from Kv2.1-KO mice show brighter, more punctate clusters of Kv2.2 than L5a cells of WT mice. To determine whether the distinct morphology of these Kv2.2 clusters still represented plasma membrane-associated Kv2.2, we performed pre-embedding immunogold electron microscopy. Kv2.2 immunogold particles can be seen primarily in the plasma membrane of L5/6 cortical pyramidal cells in both WT (Fig. 2G) and Kv2.1-KO (Fig. 2H) tissues. Specifically, 74% and 72% of immunogold particles counted across 10 cells per mouse were associated with the plasma membrane in WT and Kv2.1-KO, respectively (WT: 323/435 particles associated with the plasma membrane, average 63.3 ± 7.9 immunogold particles/μm2; Kv2.1-KO: 378/528 particles, average 62.6 ± 6.7 immunogold particles/μm2), which were not significantly different (p = 0.644, independent t test, n = 10 cells). In addition, the clustered localization of plasma membrane-associated Kv2.2 immunogold particles (Fig. 2G,H, arrows) is observed in the tissue obtained from both WT and Kv2.1-KO mice. Similar to previous analyses of the ultrastructural localization of Kv2.1 (Du et al., 1998; Mandikian et al., 2014), plasma-membrane-associated Kv2.2 immunogold particles can also be seen in close proximity to subsurface cisternae (Fig. 2H, bottom left). Therefore, the overall subcellular localization of Kv2.2 is similar to Kv2.1, and as it is retained in the Kv2.1-KO mouse, is not dependent on the presence of Kv2.1.
Kv2.2 phosphorylation and localization is less responsive to acute hypoxia in vivo than Kv2.1
Mass-spectrometry-based phosphoproteomics analyses of mammalian brain samples suggest that Kv2.2 is less extensively modified by in vivo phosphorylation than is Kv2.1 (for review, see Trimmer and Misonou, 2015). We experimentally addressed the overall level of phosphorylation of Kv2.2 in mouse brain relative to Kv2.1 by performing immunoblots on samples of mouse brain crude membrane preparations that were treated with AP and then fractionated on SDS gels under conditions that amplify electrophoretic mobility shifts upon changes in phosphorylation state (Shi et al., 1994). These analyses revealed a relatively small shift in relative electrophoretic mobility (Mr) of Kv2.2 after dephosphorylation with AP compared with the large shift seen for Kv2.1 (Fig. 3A). Specifically, whereas the Mr of Kv2.1 shifts ∼30 kDa (∼125 kDa to ∼95 kDa), that of Kv2.2 shifts ∼10 kDa (∼140 kDa to ∼130 kDa). Because the degree of AP-induced shifts in Mr can be correlated with extent of phosphorylation (Wegener and Jones, 1984), these results suggest that, in mammalian brain, Kv2.2 is not phosphorylated to the same extent as Kv2.1.
Figure 3.
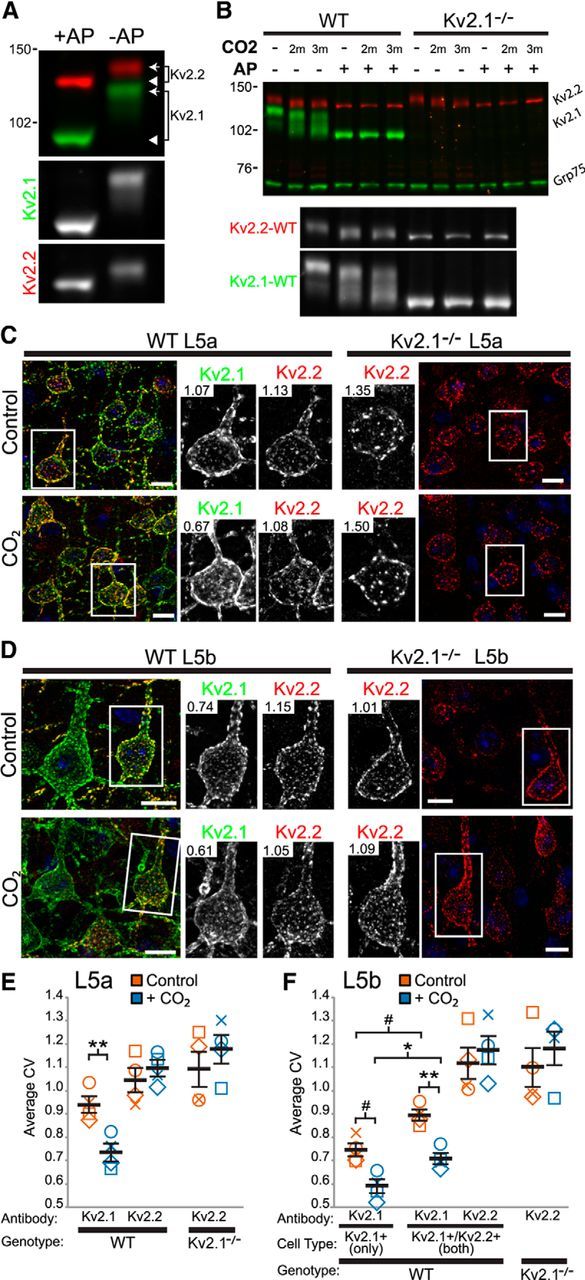
Kv2.2 exhibits a less robust response to hypoxia than Kv2.1 in situ. A, Example immunoblot of a crude WT mouse brain membrane fraction treated either with (+AP) or without (−AP) AP and probed for Kv2.1 (green) and Kv2.2 (red). Numbers on the left indicate the mobility of molecular weight standards in kilodaltons. The arrows indicate the phosphorylated form (Kv2.1 Mr ∼125 kDa; Kv2.2 Mr ∼140 kDa) and the arrowheads point to the dephosphorylated form (Kv2.1 Mr ∼95 kDa; Kv2.2 Mr ∼130 kDa). Bottom grayscale panels show the individual Kv2.1 and Kv2.2 signals extracted from the color immunoblot. B, Example immunoblot of crude whole brain homogenates prepared from brains of WT and Kv2.1-KO mice either without (control) or with CO2 treatment before killing. Samples were then incubated with AP (+AP), and proteins were analyzed by immunoblotting for Kv2.1 (green, upper band), Kv2.2 (red) and Grp75 (green, bottom band) as a loading control. Bottom grayscale panel depicts enlarged individual Kv2.2 and Kv2.1 signals from WT samples (left six lanes) of the color immunoblot. C, D, Mouse brain sections prepared from control and CO2-treated mice were double immunolabeled for Kv2.1 (green) and Kv2.2 (red) and cells in L5a (C) and L5b (D) imaged at equal exposure. Inset numbers refer to CV measurements for the depicted cell. Scale bar, 10 μm. E, Summary graph of CV measurements of L5a cells from WT and Kv2.1-KO mice that were either nontreated (control, orange symbols) or CO2 treated (blue symbols). Error bars represent the SEM and symbols represent each experiment (n = 4 mice per group). Differences in CV measurements between control and CO2 were evaluated by one-way randomized block ANOVA followed by Tukey's multiple-comparison test. Note that the y-axis origin begins at 0.5. F, Summary graph of CV measurements of L5b cells from WT and Kv2.1-KO mice. Note that L5b cells containing only Kv2.1 have significantly lower CV measurements both without and with CO2 exposure (left most orange and blue symbols). Data are represented same as in E. Note that the y-axis origin begins at 0.5. #p < 0.06; *p < 0.05; **p < 0.01.
We next determined whether acute hypoxia, induced by exposing mice to CO2, would result in dephosphorylation of Kv2.2, as occurs for Kv2.1 (Misonou et al., 2005, 2006; Ito et al., 2010). We prepared mouse whole-brain crude homogenates from mice anesthetized with sodium pentobarbital and then exposed to either air or CO2 for 2 or 3 min. Figure 3B is a representative blot showing that both Kv2.1 and Kv2.2 undergo shifts in Mr in samples prepared from mice subjected to CO2 treatment, although neither shifts to the same extent seen upon AP treatment. The samples from control and CO2-treated mice were then treated with AP to confirm that the Mr shifts resulting from hypoxia were due to differences in phosphorylation state rather than another form of posttranslational modification (e.g., proteolysis). As shown in Figure 3B, AP treatment eliminates the differences seen in the Mr of both Kv2.1 and Kv2.2 in samples from control versus CO2-treated mice. In addition, the shift in Mr of Kv2.2 after CO2 treatment was similar in magnitude between WT and Kv2.1-KO samples, suggesting that the presence or absence of Kv2.1 does not affect the change in Kv2.2 phosphorylation after CO2 exposure. These results indicate that, like Kv2.1, Kv2.2 in brain neurons is at least partially dephosphorylated after exposure of mice to CO2.
We next sought to determine whether Kv2.2 undergoes acute, phosphorylation-dependent changes in localization as is seen for Kv2.1. We first examined the effect of CO2 exposure on the level of clustering of both Kv2 family members. The left panels of Figure 3, C and D, show representative high-magnification images of L5a and L5b, respectively, from mice without (Fig. 3C,D, top row) and with (Fig. 3C,D, bottom row) exposure to CO2 and immunolabeled for Kv2.1 (Fig. 3C,D, green) and Kv2.2 (Fig. 3C,D, red). To quantify levels of clustering, we calculated the coefficient of variation or CV (SD/mean) of pixel intensity measurements of cells in L5a and L5b using ImageJ. The CV describes the dispersion of pixel intensity values from a 2D ROI around the mean pixel intensity such that cells with highly clustered Kv2 channels will have high CV values, whereas cells with more uniformly localized channels will have low CV values. Briefly, we defined ROIs comprising the cell body and the proximal apical dendrite by tracing the edge of each cell and then reducing the ROI by 0.5 μm to eliminate edge effects produced from the maximum projection. All images that were used for quantification were optically sectioned z-stacks taken at equal exposure and projected to include only one face of the cell.
Consistent with previous studies (Misonou et al., 2005, 2006), after short (2 min) CO2 exposure, Kv2.1 exhibited pronounced declustering, as seen in the images (Fig. 3C,D, insets) and in the CV measurements (L5a, p = 0.002; L5b expressing both Kv2s, p = 0.008; Fig. 3E,F) of tissue from CO2-exposed WT mice. However, clustering of Kv2.2 in L5a and L5b neurons in WT mice was largely unaltered upon CO2 exposure (L5a, p = 0.956; L5b expressing both Kv2s, p = 0.999; Fig. 3E,F). Similarly, Kv2.2 expressed in L5a and L5b pyramidal neurons in Kv2.1-KO mice also showed no significant changes in clustering, as seen in the images (Fig. 3C,D) and quantified by the CV measurements (L5a, p = 0.978; L5b p = 0.998; Fig. 3E,F). Kv2.1 present in L5b cells that expressed both Kv2 paralogs was slightly more clustered than L5b cells expressing Kv2.1 alone in both control (p = 0.579; Fig. 3F) and CO2-exposed tissue (p = 0.017; Fig. 3F). These results suggest that, unlike Kv2.1, Kv2.2 does not decluster to the same extent after CO2 exposure and Kv2.2 may prevent declustering of Kv2.1 in cells expressing both subunits.
Recombinant Kv2.2 expressed in heterologous cells exhibits a less robust response to acute stimulation than Kv2.1
Although these results suggest that Kv2.2 is less phosphorylated than Kv2.1 and is more resistant to declustering via CO2 treatment in vivo, it is possible that these differences are primarily due to differences in cell backgrounds, due to their somewhat distinct patterns of cellular expression, and not intrinsic differences in the Kv2 paralogs themselves. To investigate whether these Kv2 subunits exhibit intrinsic differences in phosphorylation-dependent regulation, we expressed recombinant Kv2.1 and Kv2.2 in heterologous HEK293T cells. We first tested the extent to which Inm treatment, which leads to increased [Ca2+]i and calcineurin activation, affects subcellular localization of Kv2.2 vs Kv2.1. As shown in Figure 4, A and B, untreated HEK293T cells expressing Kv2.1 exhibit robust, plasma-membrane-associated clusters that yield high CV values (i.e., a high degree of nonuniformity; Fig. 4E, Kv2.1, green symbols). When treated with Inm, however, a dramatic loss of Kv2.1 clustering is observed, as evidenced by a significant reduction in CV (p < 0.0001; Fig. 4E, Kv2.1, orange symbols), consistent with previous observations (Mohapatra and Trimmer, 2006). Inm treatment leads to a relatively uniform pattern of Kv2.1 expression, similar to that observed for the Kv2.1 S568A point mutant, which is constitutively nonclustered (control vs S586A mutant, p < 0.0001; Fig. 4A,B; Fig. 4E, Kv2.1, blue symbols). As shown in Figure 4A, Kv2.2 expressed in HEK293T cells also exhibits robust plasma membrane associated clusters that yield high CV values (Fig. 4E, Kv2.2, green symbols). However, unlike Kv2.1, Inm treatment does not significantly affect Kv2.2 clustering (p = 0.732; Fig. 4A,B; Fig. 4E, Kv2.2, orange symbols). Importantly, a point mutation in Kv2.2 (S605A) at a site analogous to the Kv2.1 S586A mutation eliminates Kv2.2 clustering, as seen in Figure 4, A and B, and in the significant decrease in CV value versus WT Kv2.2 (p < 0.0001; Fig. 4E, Kv2.2, blue symbols).
Figure 4.
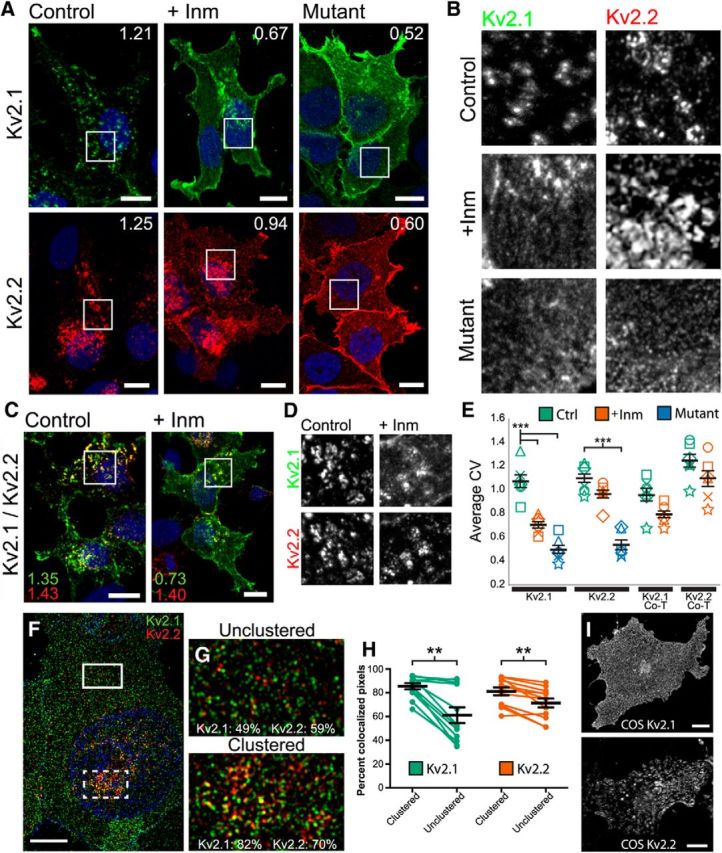
Acute regulation after Inm treatment of recombinant Kv2.2 in heterologous cells is distinct from that of Kv2.1. A, High-magnification images of HEK293T cells expressing Kv2.1 (green, top) or Kv2.2 (red, bottom) and either treated with vehicle (left) or Inm (middle) for 15 min before fixation. Right panels depict cells expressing the respective clustering mutants Kv2.1-S586A (top right) and Kv2.2-S605A (bottom right). Inset numbers refer to CV measurements of the entire cell marked by the squares. Nuclei (blue) were labeled with Hoechst. Scale bars, 10 μm. B, Grayscale insets of immunolabeling from within the squares in A. C, High-magnification images of HEK293T cells coexpressing Kv2.1 (green) and Kv2.2 (red) either treated with vehicle (control, left) or Inm (+Inm, right). Again, inset numbers refer to CV measurements of the entire cell marked by the squares. Scale bars, 10 μm. D, Grayscale insets of labeling from within the squares in C. E, Summary graph of CV measurements of transfected HEK293T cells that were either nontreated (Ctrl, green symbols) or Inm-treated (+Inm, orange symbols). Blue symbols represent CV measurements of cells expressing Kv2.1 and Kv2.2 clustering mutants. Error bars represent the SEM across all experiments and symbols represent measurements from each experiment (n = 6 replicates, 25–40 cells per group). Note that the y-axis origin begins at 0.2. Differences in CV measurements between treatments were evaluated by one-way randomized block ANOVA followed by Tukey's multiple-comparison test. ***p < 0.0001. F, High-magnification image of an HEK293T cell after Inm treatment captured with a Zeiss Elyra SIM microscope and immunolabeled for Kv2.1 (green) and Kv2.2 (red). Scale bar, 5 μm. G, Insets of unclustered region from the top box in F and clustered region from the bottom box in F. Numbers in inset refer to the MCC calculated for the entire inset, which measures the co-occurrence of two signals independent of signal proportionality. H, Summary graph of MCC values measured for Kv2.1 (green) and Kv2.2 (red) in clustered and unclustered regions of the same cell (n = 12 cells). Error bars denote mean and SEM for each group. Differences in MCC values were determined by randomized block ANOVA followed by Tukey's multiple-comparison test. **p < 0.01. I, High-magnification images of COS-1 cells expressing Kv2.1 (top) and Kv2.2 (bottom). Scale bars, 10 μm.
We next coexpressed Kv2.1 and Kv2.2, which has been reported to lead to the formation of heteromeric channels (Kihira et al., 2010), to determine the impact of Inm treatment relative to the distinct responses seen in cells expressing Kv2.1 and Kv2.2 alone. Interestingly, whereas Kv2.2 in coexpressing cells remained largely unresponsive to treatment with Inm (p = 0.543; Fig. 4C–E, Kv2.2-Co, green symbols vs orange symbols), coexpression led to reduced declustering on the part of Kv2.1 such that Kv2.1 CV values with or without treatment were no longer significantly different (p = 0.413; Fig. 4C–E, Kv2.1-Co green symbols vs orange symbols).
The results above suggest that, in coexpressing cells, at least a fraction of the expressed Kv2.1 and Kv2.2 may exist in distinct populations. To examine this possibility, we performed structured illumination superresolution imaging in coexpressing HEK293T cells treated with Inm. Figure 4F is an example of a cell showing robust declustering of Kv2.1 (Fig. 4, green) and relatively minor declustering of Kv2.2 (Fig. 4, red) in response to Inm. We noticed that the bulk of the immunofluorescence signal present in the image appeared either green or red, rather than yellow, which suggests that the two signals are not overlapping as may be expected for heteromeric channels. To determine the extent of colocalization, we used ImageJ to measure the Manders' colocalization coefficient (MCC), which measures the co-occurrence of two signals regardless of their respective intensities (Dunn et al., 2011). MCC was measured for ROIs from outside (upper ROI; Fig. 4G, top) and within (lower ROI; Fig. 4G, bottom) the region of extensive clustering from 12 cells treated with Inm and imaged at superresolution. We found that clustered and unclustered regions contained both green and red signals that were mutually exclusive and that the degree of colocalization was significantly higher in the clustered region than in the unclustered region for both Kv2 channels. On average, 85% of Kv2.1 colocalized with Kv2.2 in the clustered region versus 61% in the unclustered region (p = 0.002), whereas 81% of Kv2.2 co-occurred with Kv2.1 in the clustered region versus 71% in the unclustered region (p = 0.004; Fig. 4H). These measurements, together with the distinct responses to Inm, suggest the presence of distinct populations of Kv2.1 and Kv2.2 channels in coexpressing cells.
Given that Kv2.2 clustering in cortical neurons and HEK293T cells appears to be distinct from that of Kv2.1, we next investigated its subcellular localization in COS-1 cells, which lack clustering of Kv2.1 (Shi et al., 1994; Scannevin et al., 1996), presumably due to a lower level of Kv2.1 phosphorylation in this cell background (Mohapatra and Trimmer, 2006; Park et al., 2007). COS-1 cells showed robust Kv2.2 clustering in the plasma membrane (Fig. 4I, bottom) that was distinct from the diffuse localization of Kv2.1 (Fig. 4I, top). Together, these results suggest that Kv2.1 and Kv2.2 exhibit intrinsic differences in phosphorylation-dependent subcellular localization and its regulation.
Dephosphorylation of Kv2.1 expressed in HEK293 cells, as occurs upon Inm treatment or in vivo dialysis of AP through the patch pipette, leads to changes in its voltage-dependent gating characteristics (Mohapatra and Trimmer, 2006; Bocksteins et al., 2009; Mandikian et al., 2014). Given the lack of a response of Kv2.2 to Inm-induced declustering, we next determined the extent of modulation of Kv2.2 currents. Currents in HEK293 cells expressing either Kv2.1 or Kv2.2 were analyzed by whole-cell patch clamp under control conditions and after treatment with Inm and AP. As shown in Figure 5 and Table 2, although these treatments yielded the expected effect on Kv2.1 (i.e., 10 mV shift toward hyperpolarized potentials in the voltage dependence of activation), they did not result in any significant differences in any of the macroscopic parameters of the voltage-dependent activation of Kv2.2 (Fig. 5A, Table 2). Similar to Kv2.1 (Bocksteins et al., 2009; Mandikian et al., 2014), these treatments also did not affect Kv2.2 inactivation or deactivation kinetics (Fig. 5B,C, Table 2). These results show that, unlike Kv2.1, Kv2.2 does not undergo acute modulation of its voltage-dependent gating characteristics.
Figure 5.
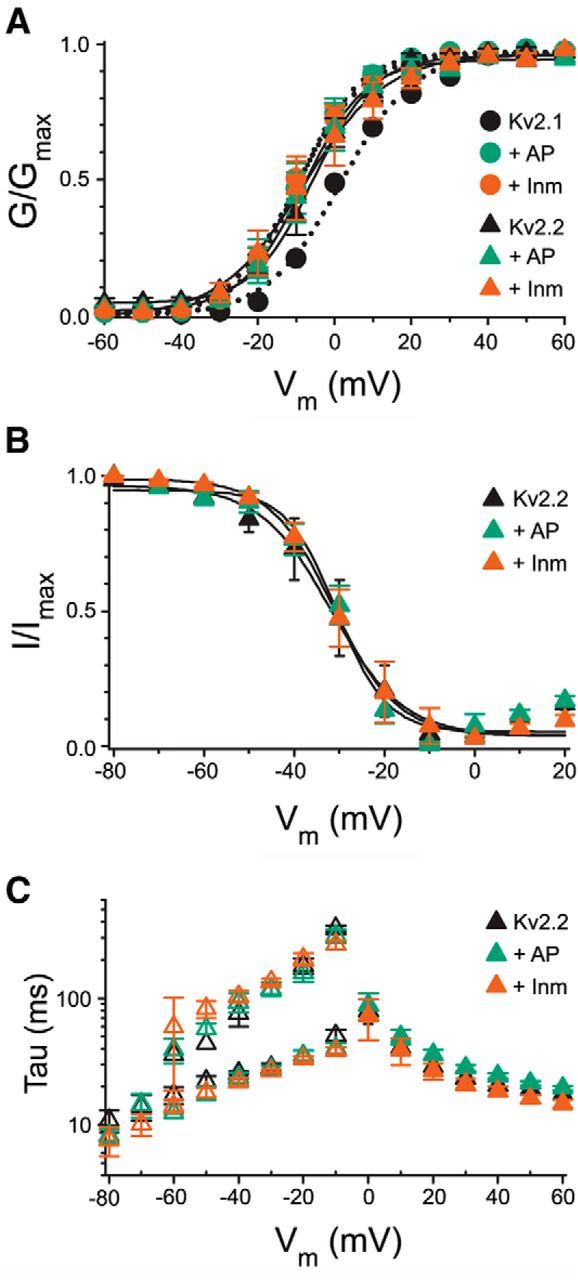
Biophysical properties of Kv2.2 before and after treatment with AP and Inm. A, Voltage dependence of activation of Kv2.2 (triangles) expressed in HEK293 cells in the absence (black) and presence of AP (green) and Inm (orange). The voltage dependence of activation was determined by plotting the normalized tail current amplitude (at −35 mV) as a function of the prepulse potential (ranging from 60 mV to −60 mV in 10 mV steps). For comparison, the voltage dependence of activation of Kv2.1 (circles) expressed in HEK293 cells before (black) and after AP (green) and Inm (orange) are also represented. Solid and dotted lines represent the Boltzmann fits. B, Voltage dependence of Kv2.2 inactivation in the absence (black) and presence of AP (green) and Inm (orange). The voltage dependence of inactivation was determined by plotting the normalized test pulse amplitude (at +60 mV) as a function of the 5 s prepulse potential (ranging from −80 to 20 mV in 10 mV increments). Solid lines represent the Boltzmann fits. C, Activation and deactivation kinetics of Kv2.2 before (black) and after AP (green) and Inm (orange). Activation kinetics (filled symbols) are obtained by a single exponential function fit to the 500 ms current traces ranging from 60 to 0 mV in 10 mV steps. Deactivation kinetics (open symbols) are derived from a double exponential function fit to the 1 s tail currents (ranging from −10 mV to −80 mV in 10 mV steps) obtained after a 250 ms prepulse to 60 mV resulting in a slow (top points) and fast (bottom points) time constant. Note that the biophysical properties of Kv2.2 are not changed upon AP or Inm treatment, whereas these treatments did affect the Kv2.1 voltage dependence of activation significantly, as demonstrated previously.
Table 2.
Biophysical properties of Kv2s with AP and Inm treatment
| Control | +AP | +Inm | |
|---|---|---|---|
| Kv2.1 activation | |||
| V1/2 (mV) | 1.1 ± 0.8 | −9.4 ± 2.8 | −9.6 ± 2.0 |
| k | 9.8 ± 0.9 | 6.6 ± 0.4 | 8.0 ± 0.9 |
| n | 5 | 7 | 6 |
| Kv2.2 activation | |||
| V1/2 (mV) | −6.1 ± 2.4 | −6.9 ± 3.5 | −6.1 ± 3.8 |
| k | 7.4 ± 1.5 | 7.5 ± 0.9 | 8.1 ± 0.5 |
| tau (+ 60 mV) (ms) | 17.4 ± 1.6 | 19.5 ± 0.8 | 14.7 ± 1.0 |
| n | 6 | 7 | 6 |
| Kv2.2 inactivation | |||
| V1/2 (mV) | −30.8 ± 5.2 | −29.7 ± 2.2 | −29.3 ± 3.8 |
| k | 6.0 ± 0.4 | 6.1 ± 1.5 | 5.7 ± 0.3 |
| n | 6 | 5 | 6 |
| Kv2.2 deactivation | |||
| tau1 (−30 mV) (ms) | 28.3 ± 2.2 | 27.3 ± 2.0 | 26.6 ± 0.8 |
| tau2 (−30 mV) (ms) | 117.1 ± 10.2 | 118.6 ± 14.4 | 134.7 ± 7.0 |
| n | 5 | 5 | 6 |
Values in bold are significantly different from control values.
Kv2 paralogs delineate cortical cell-type-specific circuits
If acute regulation of Kv2.2 is distinct from that of Kv2.1, then their differential expression in cortical neurons from distinct laminae could have a profound impact on individual cortical circuits. To address whether differential Kv2 expression delineates specific cortical circuits, we first quantified the number of Ctip2-positive and Satb2-positive cells that were also positive for Kv2.1 and Kv2.2 in L5 of rat and mouse S1. Satb2 is expressed across cortical layers 2–6 in cells that send interhemispheric axons across the midline via either the corpus callosum or the anterior commissure (Nieto et al., 2004; Alcamo et al., 2008). Ctip2 is expressed in deep layers 5b and 6 in cells that send their axons to subcortical targets (Arlotta et al., 2005; Chen et al., 2008). Specifically within L5, Satb2-positive cells are described as intratelencephalic-type (IT) pyramidal neurons associated with colossally projecting axons, whereas Ctip2-positive cells are considered pyramidal tract-type (PT) neurons with axons that remain ipsilateral projecting to pons and spinal cord (Reiner et al., 2003; Shepherd, 2013). Figure 6, A and B, shows representative high-magnification images from rat S1 of L5a and L5b immunolabeled for Kv2.1, Kv2.2, Satb2 (Fig. 6A), and Ctip2 (Fig. 6B). Arrows indicate neurons that were considered positive for Kv2.1 alone and arrowheads indicate cells considered positive for both Kv2s. Figure 6C summarizes quantitative data from these cell populations. We found that most Satb2-positive cells in L5 (i.e., IT neurons) were positive for both Kv2.1 and Kv2.2 (Rat: Satb2+/Kv2.1+, 1068/1186 cells, 89.7%; Satb2+/Kv2.2+, 881/1186, 72.5%. Mouse: Satb2+/Kv2.1+, 1527/1647 cells, 91.9%; Satb2+/Kv2.2+, 1400/1647, 83.9%; 3 animals each), whereas Ctip2-positive cells found in L5b (i.e., PT neurons) were much more heterogeneous in their Kv2 expression. Although almost all Ctip2-positive cells were found to express Kv2.1, Kv2.2 expression was evident in 46% and 40% of cells in rat and mouse, respectively (Rat: Ctip2+/Kv2.1+, 720/870 cells 82.8%; Ctip2+/Kv2.2+, 400/870, 46.0%. Mouse: Ctip2+/Kv2.1+, 1044/1200 cells 87.0%; Ctip2+/Kv2.2+, 481/1200, 40.1%; 3 animals each). Moreover, the Ctip2-positive (PT) neurons that did express Kv2.2 exhibited low levels of expression relative to Satb2-positive (IT) neurons (Fig. 6B, insets).
Figure 6.

Differences in Kv2 expression correspond to different cell types. A, B, Rat sagittal sections of S1 were immunolabeled for Kv2.1 (green), Kv2.2 (red), Satb2 (blue), and Ctip2 (cyan, B only). Boxed regions refer to higher-magnification images (right) of L5a (A) and L5b (B). Cells expressing Kv2.1 and Kv2.2 (arrowheads) or only Kv2.1 (arrows) are indicated. Scale bar, 20 μm. C, Cell counts of Satb2+ and Ctip2+ cells labeled for Kv2.1 and Kv2.2 in both rat and mouse. Error bars represent SEM for counts across three animals. D–E, Immunolabeling for Kv2s in retrogradely labeled striatal projection neurons. SADΔG-EGFP rabies virus was stereotaxically injected into the dorsolateral striatum of WT mice. D, Low-magnification image of a sagittal section counterstained with Hoechst 33258 (white) showing the site of injection (green). Scale bar, 500 μm. E, Low-magnification image of retrogradely labeled L5 cells ipsilateral to the injection site and immunolabeled for Kv2.1 (green) and Kv2.2 (red), with EGFP signal pseudocolored white. For the inset image, EGFP is pseudocolored blue. Scale bar, 20 μm.
Long-range cortical projection targets are often used to classify neurons within L5, and several studies have observed differences in electrophysiological properties between cells projecting to distinct regions (Hattox and Nelson, 2007; Le Bé et al., 2007; Brown and Hestrin, 2009; Dembrow et al., 2010; Sheets et al., 2011; Suter et al., 2013). In particular, IT neurons have been classically identified on the basis of their contralateral projections to striatum (Wilson, 1987; Cowan and Wilson, 1994; Reiner et al., 2010; Shepherd, 2013). To confirm that IT neurons strongly express both Kv2.1 and Kv2.2, we injected retrograde tracers into dorsolateral striatum of adult mice to label corticostriatal projection neurons. Figure 6D shows a low-magnification image that depicts the site of injection and Figure 6E a high-magnification image of labeled cells within L5. The majority of labeled neurons were highly positive for both Kv2.1 and Kv2.2, with 100% of tracer-labeled cells in both hemispheres expressing Kv2.1 and ∼94% expressing detectable levels of Kv2.2 (contralateral = 95.7%, 246/257 cells; ipsilateral = 93.7%, 312/333 cells). Moreover, the vast (>80%) majority of contralateral tracer-labeled cells were strongly positive for Kv2.2, similar to the values obtained for L5 Satb2 positive neurons as detailed above. These results confirm that contralaterally projecting IT neurons express high levels of both Kv2 paralogs, which, taken together with those from experiments using molecular makers, strongly suggests that Kv2.1 and Kv2.2 are differentially expressed in functionally distinct cortical neurons.
Functional differences in Kv2 subunit expression in a subset of L5a and L5b neurons
We next used two GENSAT mouse lines that express EGFP in specific subpopulations of L5 pyramidal neurons across the cortex under the control of either the Etv1 or Glt promoters (Gong et al., 2007; Doyle et al., 2008; Groh et al., 2010; Guan et al., 2015) to estimate the contribution of these Kv2 channel paralogs to neuronal physiology. Etv1 mice have EGFP expression in slender-tufted, type I pyramidal neurons found primarily in L5a, which project across the corpus callosum and to ipsilateral and contralateral striatum, but not to pons or thalamus, identifying them as IT-type projection neurons (Groh et al., 2010). In contrast, Glt mice express EGFP in thick-tufted, type II pyramidal neurons found in L5b that project to ipsilateral pons and thalamus, but not to contralateral striatum, identifying them as a subset of PT-type cells. Etv1-EGFP- and Glt-EGFP-positive cells (i.e., Etv1 and Glt cells) each account for just over half (∼55%) of the cells in L5a and L5b, respectively (Groh et al., 2010).
As shown previously (Groh et al., 2010; Guan et al., 2015), Etv1 cells were found primarily in L5a, whereas Glt cells were localized to L5b (Fig. 7A,B, left). As summarized in the graphs in Figure 7C, we found that 100% of Etv1 cells were positive for both Kv2.1 and Kv2.2. Among Glt cells, 100% were Kv2.1-positive, whereas 38.7% were Kv2.2-positive. L5b cells that were strongly positive for Kv2.2 were almost always negative for Glt (Fig. 7B, arrowheads; 13.8%, or 20/145 strongly Kv2.2-positive cells were positive for Glt; n = 4 mice). Therefore, whereas Kv2.1 is highly expressed in 100% of Etv1 and Glt cells, Kv2.2 shows high expression in all Etv1 cells, but is present in only ∼40% of Glt cells, where it is expressed at relatively low levels.
Figure 7.
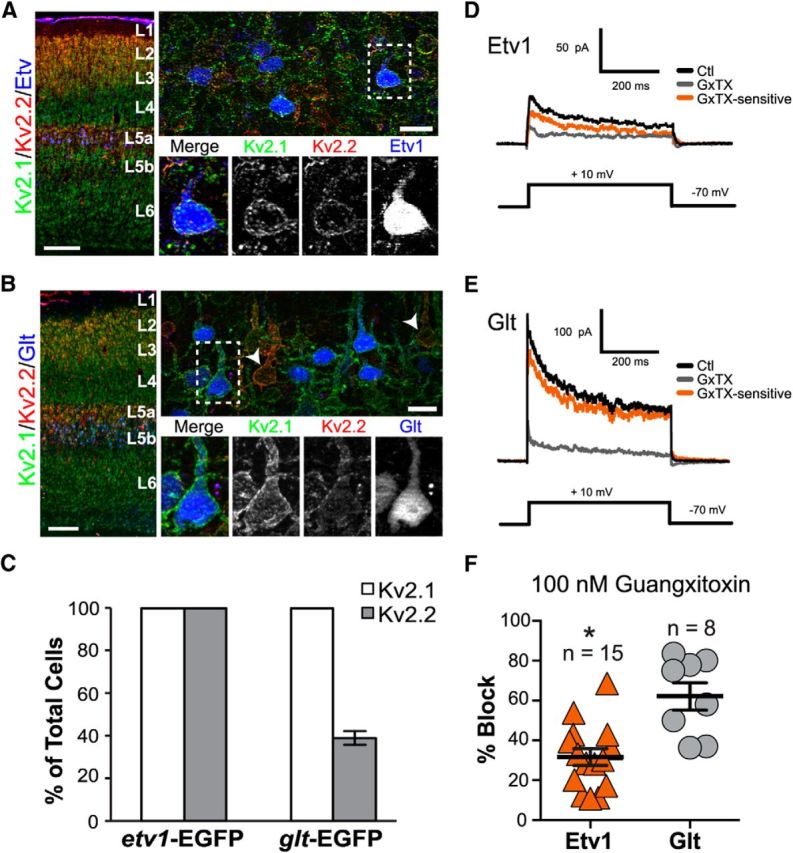
Immunohistochemistry and slice electrophysiology confirm differences in Kv2 subunit expression in a subset of L5a and L5b pyramidal neurons. A, B, Mouse sagittal sections from transgenic mice expressing EGFP either in a subset of L5a (Etv1, blue, A) or L5b (Glt, blue, B) neurons were immunolabeled for Kv2.1 (green) or Kv2.2 (red). Low-magnification images of S1 cortex (A, B, left) confirm the localization of Etv1- and Glt-expressing cells (pseudocolored in blue) as belonging to L5a and 5b, respectively. Scale bar, 200 μm. Right panels depict higher-magnification images (40×) of each cell type, again with EGFP pseudocolored in blue. Scale bar, 20 μm. Note that L5b cells with high expression of Kv2.2 (arrowheads, B) are negative for Glt. C, Cell counts of Etv1 and Glt cells labeled for Kv2.1 (Etv cells, 259/259 cells, 100%; Glt cells, 395/395 cells, 100%) and Kv2.2 (Etv cells, 259/259 cells, 100%; Glt cells, 153/395 cells, 38.7%). Cell counts were performed on sections made from four mice per genotype. Error bars represent SEM. D–F, Kv2-mediated current in Etv1 and Glt pyramidal neurons. Note different scale bars in D and E. D, In Etv1 neurons, the control current (Ctl; black line) in outside-out macropatches averaged 111 ± 22 pA at 200 ms (mean ± SEM; n = 15 patches). The gray trace indicates current after application of 100 nm GxTX and the orange trace is the GxTX-sensitive current obtained by subtraction of current in GxTX from control current. This patch was from an Etv1 neuron from a P15 mouse. The voltage protocol is shown below. E, In Glt neurons, the control current (Ctl; black line) in outside-out macropatches averaged 139 ± 47 pA at 200 ms (mean ± SEM; n = 8 patches). The gray trace indicates current after application of 100 nm GxTX and the orange trace is the GxTX-sensitive current obtained by subtraction of current in GxTX from control current. The voltage protocol is shown below. This patch was from a Glt neuron from a P17 mouse. F, Scatter plots showing percent block by 100 nm GxTX in patches from Etv1 (n = 15) versus Glt (n = 8) cells. Error bars represent SEM. *Significant difference from Glt (p = 0.00047, unpaired t test).
Given our immunohistochemical results that Etv1 and Glt cells express different levels of Kv2.1 and Kv2.2, we next sought to confirm these differences electrophysiologically. To do so, we recorded from Etv1 and Glt cells in acute cortical slices from 2- to 4-week-old mice. To isolate Kv2 currents, we first used the largely Kv2-specific toxin GxTX. Although GxTX is not completely specific for Kv2 channels, because high concentrations can also inhibit Kv4.3, it blocks Kv2.1 and Kv2.2 with an ∼8-fold higher potency than Kv4.3 (Herrington et al., 2006; Herrington, 2007; Liu and Bean, 2014), thus largely isolating Kv2-mediated currents at the lower concentrations (100 nm) used here. Figure 7, D and E, shows records from outside-out macropatches from Etv1 and Glt cells before and after application of 100 nm GxTX. Whereas GxTX blocked current in both cell types, Glt cells exhibited significantly greater GxTX-sensitive current than Etv1 cells, both in terms of absolute current at 200 ms (Glt = 85 ± 31 pA, n = 8; Etv1 = 31 ± 6.8 pA, n = 16) and in terms of percentage blocked (Glt = 62.2 ± 6.9%; n = 8; Etv1 = 29.7 ± 4.4%, n = 15; p < 0.05; Fig. 7F).
Because GxTX inhibits both Kv2.1 and Kv2.2 (Herrington et al., 2006), we next used Kv2.1- and Kv2.2-specific blocking Abs to isolate each respective current in outside-out macropatches from Etv1 and Glt cells by recording currents both before and after exposure to these Abs (Murakoshi and Trimmer, 1999; Guan et al., 2007). Figure 8, A and B, shows representative traces for exposure of Etv1 macropatches to anti-Kv2.1 (Fig. 8A) and anti-Kv2.2 (Fig. 8B) Abs. Figure 8, C and D, shows the time course of Ab block in Etv1 macropatches using the Kv2.1 (Fig. 8C) or the Kv2.2 (Fig. 8D) Ab. After 2–3 min of control recordings, the pipette solution was replaced with a solution containing the Abs. Subsequent current block occurred relatively rapidly, indicating that the effect was not simply a function of run-down. In addition, we recorded with either anti-Kv2.1 or anti-Kv2.2 Abs that were heat inactivated for 3 h at 65°C before perfusion and saw no effect on current amplitude (n = 2 cells per AB; data not shown). In Etv1 cells, anti-Kv2.1 blocked ∼35% of total current (34.9 ± 7.5%, n = 10), whereas anti-Kv2.2 blocked ∼45% of the total current (44.7 ± 5.3%, n = 16). In 5 cells, the anti-Kv2.1 blocked 34.4 ± 11.9% of the current and subsequent application of GxTX blocked an additional 11.3 ± 6.2% current. In 11 cells, anti-Kv2.2 blocked 37.5 ± 6.4% of the current and further application of GxTX blocked an additional 10.0 ± 5.2% current (Fig. 8E,F). Finally, to confirm that Ab block is in fact specific to Kv2s, we also recorded from Etv1 patches in which GxTX was applied first, followed by subsequent application of anti-Kv2.1. Under these conditions, we obtained similar results, with GxTX first blocking ∼28% of total current (27.7 ± 4.5%, n = 5) and the anti-Kv2.1 blocking only an additional 7% (7.0 ± 4.9%; data not shown). Given the similar levels of block with both Abs and after subsequent GxTX application, we interpret these data to mean that, in Etv1 cells, Kv2.1 and Kv2.2 contribute approximately equally to whole-cell Kv2 current.
Figure 8.
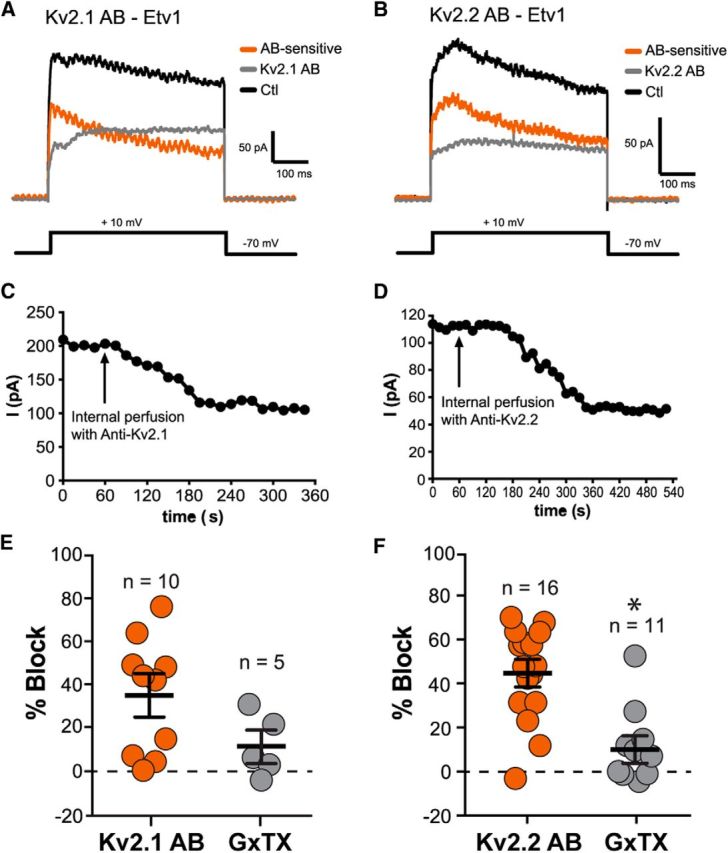
Effects of internal pipette perfusion of antibodies against Kv2.1 or Kv2.2 in patches from Etv1 cells. A, Representative traces for an outside-out patch from an Etv1 neuron (P20 mouse). Black, Control (Ctl) trace during initial baseline period; gray, trace after several minutes perfusion of the pipette and patch contents with Kv2.1 Ab (anti-Kv2.1); orange, anti-Kv2.1 sensitive current (obtained by subtraction). B, Different patch from an Etv1 cell before and after perfusion of anti-Kv2.2 (P13 mouse). The color of the traces are the same as in A. C, Plot of current (I) versus time for patch shown in A, including before and after perfusion with the Kv2.1 Ab. D, Plot of current (I) versus time for patch shown in B before and after perfusion with the Kv2.2 Ab. E, Percentage block by anti-Kv2.1 and additional block by subsequent application of 100 nm GxTX. Error bars indicate SEM. F, Percentage block by anti-Kv2.2 and additional block by subsequent application of 100 nm GxTX. Bars represent mean and ± SEM. *p = 0.0001 for the difference between Kv2.2 AB and GxTX.
In Glt macropatches, we found that the anti-Kv2.1 blocked significantly more current than in Etv1 patches, achieving ∼55% block of total current (55.0 ± 4.3%, n = 12), with subsequent GxTX application blocking an additional ∼10% (10.2 ± 3.4%, n = 7; Fig. 9A,C,D). Interestingly, anti-Kv2.2 yielded little to no block of total current in macropatches from Glt cells (0.2 ± 2.9%, n = 7), whereas subsequent application of GxTX blocked ∼50% of current (49.3 ± 4.2%, n = 7; Fig. 9B,C,D), a significantly greater proportion of total current than was blocked in Etv1 patches (Fig. 8F, 9C,D). In agreement with our immunohistochemical data, these results suggest that Kv2.1 is more prevalent in Glt neurons and that any Kv2.2 that is present in these cells contributes a small fraction of the Kv2 current.
Figure 9.

Effects of internal pipette perfusion of antibodies against Kv2.1 or Kv2.2 in patches from Glt cells. A, Representative traces for an outside-out patch from a Glt neuron (P24 mouse). Black, Control (Ctl) trace during initial baseline period; gray, trace after several minutes perfusion of the pipette and patch contents with Kv2.1 Ab (anti-Kv2.1); orange, anti-Kv2.1 sensitive current (obtained by subtraction). The Kv2.1 Ab blocks nearly all of the current. B, Different patch from a Glt cell before and after perfusion with anti-Kv2.2 (P18 mouse). There was no block by anti-Kv2.2 in this patch. C, Scatter plots showing population data for percentage block by anti-Kv2.1 and additional block by subsequent application of 100 nm GxTX. Also shown is population data for block by anti-Kv2.2 (and subsequent GxTX application). Error bars represent SEM. #Significant difference between percentage block by anti-Kv2.1 and anti-Kv2.2 (and their associated application of GxTX). #p = 0.0000001; ##p = 0.00001. D, Scatter plots of population data for percent block by anti-Kv2.1 and anti-Kv2.2 in patches from Etv1 and Glt cells. Anti-Kv2.1 blocked a significantly higher percentage of current in patches from Glt cells versus Etv1 cells. Anti-Kv2.2 blocked significantly more current in patches from Etv1 cells versus Glt cells. Error bars indicate SEM. *p = 0.035; **p = 0.00002 for the difference between Etv1 and Glt cells for the data indicated by brackets.
Finally, to better characterize the GxTX-sensitive currents in Etv1 and Glt cells, we examined their voltage dependence and kinetics from outside-out macropatches. Figure 10A shows steady-state voltage dependence averaged data from all cells of each type. The half-activation voltage (V1/2) of the GxTX-sensitive current was significantly more negative in Etv1 cells (−23.7 ± 2.7 mV, n = 9) than Glt cells (−13.4 ± 1.3 mV, n = 7; p < 0.01; Fig. 10B), whereas there was no difference in slope between the two cell types (Fig. 10C). Given the high expression levels of Kv2.2 in Etv1 cells and its near absence in Glt cells, as well as the biophysical differences observed between Kv2.1 and Kv2.2 currents expressed in transfected HEK cells, these data suggest that it is the presence of Kv2.2 subunits that underlies the more negative activation range of Kv2 current in Etv1 cells.
Figure 10.

Biophysical properties of GxTX-sensitive current from Etv1 and Glt cells of L5. A, Average normalized steady-state activation curves for somatic outside-out macropatch recordings of GxTX-sensitive current from Etv1 (n = 9) and Glt cells (n = 7). For Etv1, the V1/2 was significantly more negative (−23.7 ± 2.7 mV) than for Glt cells (−13.4 ± 1.3 mV) by unpaired t test. B, Scatter plot of V1/2 for the individual cells contributing to activation curves in A. Horizontal line represents the mean. *Significant difference from Etv1 (p < 0.01). C, Scatter plot for Boltzmann slope for individual cells contributing to activation curves in A. The horizontal line represents the mean. The mean slope did not differ significantly between Etv1 and Glt cells by unpaired t test. D, Scatter plot of activation tau at 0 mV for Etv1 and Glt cells. The activation time constant was marginally significantly different (p < 0.051) between Etv1 cells (4.6 ± 0.7 ms; n = 10) and Glt cells (2.4 ± 0.4 ms; n = 5) by unpaired t test. E, Scatter plot of inactivation tau for Etv1 and Glt cells. Our 500 ms steps were not long enough for precise estimate of the slow inactivation time constants for the GxTX-sensitive current, but the estimated inactivation tau at 0 mV did not differ between Etv1 cells (957 ± 261 ms; n = 11 cells) and Glt cells (822 ± 262 ms; n = 7 cells).
To compare activation and inactivation kinetics between cell types, we fit the rising phase and decay phase of currents, each with a single exponential (see Materials and Methods for details). The activation time constant was marginally significantly different (p < 0.051) between Etv1 cells (4.6 ± 0.7 ms; n = 10) and Glt cells (2.4 ± 0.4 ms; n = 5; Fig. 10D). There was no significant difference in time-to-peak current of the GxTX-sensitive current in Etv1 (18.9 ± 3.1 ms; n = 10) and Glt cells (9.3 ± 3.1 ms; n = 5; p < 0.063). Our 500 ms steps were not long enough for precise estimation of the slow inactivation time constants for the GxTX-sensitive current, but the estimated inactivation tau at 0 mV did not differ between Etv1 cells (957 ± 261 ms; n = 11 cells) and Glt cells (822 ± 262 ms; n = 7 cells; Fig. 10E).
Discussion
Understanding how information is processed within and between layers of the cortex requires a thorough characterization of the abundance, distribution, and function of voltage-gated ion channels. Establishing the role of Kv2 channels is of particular interest given their robust expression and the unusually dynamic nature of their function. To this end, our results reveal previously uncharacterized differences in Kv2.1 and Kv2.2 expression, function, and acute regulation and suggest distinct roles for these highly related Kv channels.
Previous studies demonstrated that, whereas Kv2.1 is present in most mammalian brain neurons (Frech et al., 1989; Trimmer, 1991; Hwang et al., 1993; Du et al., 1998), Kv2.2 is less broadly expressed, with expression primarily in olfactory bulb, basal forebrain, pons, superior colliculus, MNTB, and a subset of cells in the cortex (Hwang et al., 1992; Guan et al., 2007; Johnston et al., 2008; Hermanstyne et al., 2010; Kihira et al., 2010). Consistent with these earlier observations, we found Kv2.1 expression across all cortical layers, whereas Kv2.2 expression was found primarily in L2 and L5a. Furthermore, distinct but specific patterns of laminar expression are seen across diverse mammalian species including mouse, rat, ferret, macaque, and human. These conserved differences in cellular expression suggest distinct roles for Kv2.1 and Kv2.2 in mammalian cortex.
Kv2.1 and Kv2.2 also differ in phosphorylation-dependent regulation, suggesting distinct roles in plasticity. Kv2.1 and Kv2.2 expressed endogenously in cortical neurons and exogenously in HEK293 cells both exhibit a highly clustered subcellular localization. However, whereas Kv2.1 clusters significantly disperse in cortical neurons after CO2 hypoxia and in HEK293 cells after Inm treatment, in both cases, Kv2.2 is more resistant to declustering. Although Kv2.1 and Kv2.2 are highly similar upstream of the motif that directs Kv2.1 clustering (Lim et al., 2000), the so-called PRC domain (81% aa identity over the first 600 aa), they diverge substantially (only 29% identity) downstream from the PRC domain. A previous analysis of chimeric Kv2.1/Kv1.5 subunits suggested the existence of a Kv2.1 domain necessary for acute phosphorylation-dependent regulation of clustering located in the distal C terminus of Kv2.1 beyond the PRC domain (Mohapatra and Trimmer, 2006). The extreme divergence of Kv2.2 from Kv2.1 in this region may explain why Kv2.2 in cortical neurons and HEK293 cells is somewhat refractory to acute phosphorylation-dependent regulation of clustering compared with Kv2.1.
Dephosphorylation of Kv2.1 is associated with loss of clustering, and previous mass-spectrometry-based analyses and the immunoblot data we present here suggest that Kv2.2 has an overall lower level of phosphorylation compared with Kv2.1 (34 phosphosites on brain Kv2.1 vs 11 on Kv2.2; for review, see Cerda and Trimmer, 2011; Trimmer and Misonou, 2015). It is intriguing that Kv2.2 clustering in cortical neurons and HEK293 cells is refractory to acute phosphorylation-dependent regulation and that Kv2.2 expressed in COS-1 cells is clustered, whereas Kv2.1 expressed in COS-1 cells is hypophosphorylated and diffuse. This suggests that, whereas the overall level of phosphorylation of Kv2.2 is lower than that of Kv2.1, the key residues regulating phosphorylation-dependent clustering may be constitutively phosphorylated in Kv2.2. Alternatively, phosphorylation-independent mechanisms distinct from those that regulate the conditional, phosphorylation-dependent clustering of Kv2.1 may underlie the constitutive clustering of Kv2.2. Although the exact role of Kv2 channel clustering and dispersal remains unclear, intriguing data suggest that clustered Kv2.1 channels are nonconducting, which has led to the proposal that Kv2.1 may have functions unrelated to ion conductance (O'Connell et al., 2010; Fox et al., 2013). In agreement are recent data suggesting that Kv2.1 clusters, which preferentially localize to plasma membrane:endoplasmic reticulum (PM:ER) membrane contact sites (Du et al., 1998; Antonucci et al., 2001; Mandikian et al., 2014; Fox et al., 2015), function to stabilize these junctions in both HEK cells and cultured hippocampal neurons, where both store-operated and voltage-gated calcium channels are localized (Fox et al., 2015), as well as intracellular calcium release channels (Antonucci et al., 2001; King et al., 2014; Mandikian et al., 2014). Future studies will be necessary to determine whether Kv2.2 clusters, which are refractory to regulation, are also involved in establishing and/or maintaining more stable PM:ER membrane contact sites.
Our findings reveal layer-specific patterning of Kv2 subunits throughout cortex, which likely reflect molecular-cell-type differences in Kv2 subunit expression. A model for cell-type specificity of Kv2.1 and Kv2.2 expression in L5 pyramidal neurons is shown in Figure 11. Most L5 cells expressing Satb2 and all cells expressing Etv1-EGFP were positive for both Kv2 subunits. Both Satb2- and Etv1-positive cortical cells are associated with IT neurons, which project callosally to contralateral cortex and to ipsilateral (and contralateral) striatum, but not to pons, or spinal cord (Wilson, 1987; Cowan and Wilson, 1994; Alcamo et al., 2008; Groh et al., 2010; Reiner et al., 2010; Shepherd, 2013). Consistent with this, the majority of cells labeled via retrograde tracer to the contralateral striatum expressed high levels of both Kv2 channel subunits. Together, these results suggest that IT-type projection neurons express both Kv2.1 and Kv2.2 (Fig. 11). In contrast, cells of L5b are more heterogeneous in their Kv2 expression profiles. Specifically, whereas most Ctip2-positive neurons and all Glt neurons express Kv2.1, only half of either group is positive for Kv2.2 and the majority of these positive cells are only weakly Kv2.2 positive. Ctip2 is found in L5b-6 (Arlotta et al., 2005; for review, see Greig et al., 2013) and those within L5 are considered to be PT neurons that project to subcortical targets. Similarly, Glt-positive cells, found primarily in L5b, represent a subset of PT neurons that project to ipsilateral thalamus and pons, but not to contralateral striatum (Groh et al., 2010). Therefore, whereas almost all IT-type cells express high levels of both Kv2.1 and Kv2.2, most PT-type neurons express Kv2.1 in the absence of detectable Kv2.2, and less than half express low levels of Kv2.2 (Fig. 11). It will be interesting to determine whether this differential Kv2 expression remains associated with these cell types in experimental models, including mutant mice, where laminar patterning and/or connectivity is altered.
Figure 11.

Model for cellular specificity of Kv2 paralog expression in L5 pyramidal neurons of cerebral cortex. L5a IT pyramidal projection neurons are negative for Ctip2 but positive for Etv1-EGFP and a contralaterally placed tracer in striatum and express high levels of both Kv2.1 and Kv2.2. In contrast, L5b PT pyramidal projection neurons are positive for Ctip2 and Glt-EGFP but negative for a contralaterally placed tracer in striatum and express high levels of Kv2.1 but low levels of, to no, Kv2.2. MSN, Striatal medium spiny neuron. Levels of Kv2.1 and Kv2.2 in the different pyramidal cell classes are a simplified representation meant to convey the overall differences in Kv2.1 and Kv2.2 expression levels across the population of IT and PT neurons studied here and do not account for variations within the population of IT and PT cells.
Kv2s appear to play a major role in regulating neuronal excitability during periods of high-frequency firing (Du et al., 2000; Johnston et al., 2008; Guan et al., 2013; Liu and Bean, 2014). Both Kv2 subunits have been shown to facilitate high-frequency firing in cortical and CA1 pyramidal neurons, as well as neurons of the superior cervical ganglion and MNTB (Johnston et al., 2008; Guan et al., 2013; Liu and Bean, 2014). In addition, Kv2 channel function is dependent upon phosphorylation state. Substantial increases in neuronal activity leading to dephosphorylation of Kv2.1 yield graded changes in its voltage-dependent activation, leading to channels that activate at more hyperpolarized membrane potentials and homeostatically suppress neuronal excitability (Misonou et al., 2004; Misonou et al., 2005; Misonou et al., 2006; Mohapatra et al., 2009). That Kv2.2 has far fewer phosphorylation sites than Kv2.1 is consistent with the patch-clamp data from HEK293 cells presented here, which show that, whereas activation of Kv2.1 exhibits a significant hyperpolarizing shift after stimulation with Inm or AP, Kv2.2 does not. Moreover, the Kv2.2 voltage-dependent activation curve is already hyperpolarized relative to Kv2.1 under control conditions, such that Kv2.2 acts as if it were a constitutively dephosphorylated version of Kv2.1 (Mohapatra et al., 2008; Bocksteins et al., 2009; Mandikian et al., 2014). This could yield higher levels of constitutive Kv2 channel activity in cells expressing more Kv2.2 (e.g., cortical neurons in L2 and L5a) and more conditional, phosphorylation-dependent Kv2 channel activity in cells expressing more Kv2.1 (e.g., L5b). Although it is difficult to predict how these subunits would function as part of heteromeric channels, these results suggest that cells expressing Kv2.2 may have lower intrinsic excitability under control conditions.
In addition to the relatively hyperpolarized activation of Kv2.2 in HEK293 cells, we also found that the GxTX-sensitive Kv2 current in Etv1 cells, which have high expression of Kv2.2, activates at significantly more negative potentials than the GxTX-sensitive Kv2 current in Glt cells, which express little to no Kv2.2. As suggested above, if Kv2.2 behaves like dephosphorylated Kv2.1 (Misonou et al., 2004; Misonou et al., 2005; Misonou et al., 2006), then Kv2.2 currents would activate closer to threshold, thus suppressing excitability in response to small stimuli. In contrast, one would predict that the more depolarized activation range of Kv2 currents in Glt cells would not modulate excitability for smaller inputs, but would be expected to play an important role in permitting high-frequency firing (Du et al., 1998; Johnston et al., 2008; Guan et al., 2013; Liu and Bean, 2014). Consistent with these predictions, Etv1 cells were found to have higher rheobase and to fire at lower rates and with lower gain in response to DC inputs compared with Glt cells (Guan et al., 2013, 2015). These results lay the groundwork for future studies to address how Kv2.1 and Kv2.2 contribute differentially to the function of L5a versus L5b cortical pyramidal neurons.
Footnotes
This work was supported by the NIH (Grant R01 NS042225 to J.S.T., Grant R01 NS044163 to R.C.F. and D.G., and Grant R01 NS062736 to K.Z.); the Research Foundation–Flanders (Postdoctoral Fellowship FWO-1291913N to E.B.); and the Whitehall Foundation (Grant 2014-05-99 to K.Z.). We thank Jon Sack and Colleen Manning for helpful advice and critical discussions and Tracey Hermanstyne and Jeanne Nerbonne for generously providing the Kv2.2-KO mice.
The authors declare no competing financial interests.
References
- Alcamo EA, Chirivella L, Dautzenberg M, Dobreva G, Fariñas I, Grosschedl R, McConnell SK. Satb2 regulates callosal projection neuron identity in the developing cerebral cortex. Neuron. 2008;57:364–377. doi: 10.1016/j.neuron.2007.12.012. [DOI] [PubMed] [Google Scholar]
- Antonucci DE, Lim ST, Vassanelli S, Trimmer JS. Dynamic localization and clustering of dendritic Kv2.1 voltage-dependent potassium channels in developing hippocampal neurons. Neuroscience. 2001;108:69–81. doi: 10.1016/S0306-4522(01)00476-6. [DOI] [PubMed] [Google Scholar]
- Arlotta P, Molyneaux BJ, Chen J, Inoue J, Kominami R, Macklis JD. Neuronal subtype-specific genes that control corticospinal motor neuron development in vivo. Neuron. 2005;45:207–221. doi: 10.1016/j.neuron.2004.12.036. [DOI] [PubMed] [Google Scholar]
- Bocksteins E, Raes AL, Van de Vijver G, Bruyns T, Van Bogaert PP, Snyders DJ. Kv2.1 and silent Kv subunits underlie the delayed rectifier K+ current in cultured small mouse DRG neurons. Am J Physiol Cell Physiol. 2009;296:C1271–C1278. doi: 10.1152/ajpcell.00088.2009. [DOI] [PMC free article] [PubMed] [Google Scholar]
- Brown SP, Hestrin S. Cell-type identity: a key to unlocking the function of neocortical circuits. Curr Opin Neurobiol. 2009;19:415–421. doi: 10.1016/j.conb.2009.07.011. [DOI] [PMC free article] [PubMed] [Google Scholar]
- Cerda O, Trimmer JS. Activity-dependent phosphorylation of neuronal Kv2.1 potassium channels by CDK5. J Biol Chem. 2011;286:28738–28748. doi: 10.1074/jbc.M111.251942. [DOI] [PMC free article] [PubMed] [Google Scholar]
- Chen B, Wang SS, Hattox AM, Rayburn H, Nelson SB, McConnell SK. The Fezf2-Ctip2 genetic pathway regulates the fate choice of subcortical projection neurons in the developing cerebral cortex. Proc Natl Acad Sci U S A. 2008;105:11382–11387. doi: 10.1073/pnas.0804918105. [DOI] [PMC free article] [PubMed] [Google Scholar]
- Cowan RL, Wilson CJ. Spontaneous firing patterns and axonal projections of single corticostriatal neurons in the rat medial agranular cortex. J Neurophysiol. 1994;71:17–32. doi: 10.1152/jn.1994.71.1.17. [DOI] [PubMed] [Google Scholar]
- Dembrow NC, Chitwood RA, Johnston D. Projection-specific neuromodulation of medial prefrontal cortex neurons. J Neurosci. 2010;30:16922–16937. doi: 10.1523/JNEUROSCI.3644-10.2010. [DOI] [PMC free article] [PubMed] [Google Scholar]
- Dodt HU, Zieglgänsberger W. Visualizing unstained neurons in living brain slices by infrared DIC-videomicroscopy. Brain Res. 1990;537:333–336. doi: 10.1016/0006-8993(90)90380-T. [DOI] [PubMed] [Google Scholar]
- Doyle JP, Dougherty JD, Heiman M, Schmidt EF, Stevens TR, Ma G, Bupp S, Shrestha P, Shah RD, Doughty ML, Gong S, Greengard P, Heintz N. Application of a translational profiling approach for the comparative analysis of CNS cell types. Cell. 2008;135:749–762. doi: 10.1016/j.cell.2008.10.029. [DOI] [PMC free article] [PubMed] [Google Scholar]
- Drewe JA, Verma S, Frech G, Joho RH. Distinct spatial and temporal expression patterns of K+ channel mRNAs from different subfamilies. J Neurosci. 1992;12:538–548. doi: 10.1523/JNEUROSCI.12-02-00538.1992. [DOI] [PMC free article] [PubMed] [Google Scholar]
- Du J, Tao-Cheng JH, Zerfas P, McBain CJ. The K+ channel, Kv2.1, is apposed to astrocytic processes and is associated with inhibitory postsynaptic membranes in hippocampal and cortical principal neurons and inhibitory interneurons. Neuroscience. 1998;84:37–48. doi: 10.1016/S0306-4522(97)00519-8. [DOI] [PubMed] [Google Scholar]
- Du J, Haak LL, Phillips-Tansey E, Russell JT, McBain CJ. Frequency-dependent regulation of rat hippocampal somato-dendritic excitability by the K+ channel subunit Kv2.1. J Physiol. 2000;522:19–31. doi: 10.1111/j.1469-7793.2000.t01-2-00019.xm. [DOI] [PMC free article] [PubMed] [Google Scholar]
- Dunn KW, Kamocka MM, McDonald JH. A practical guide to evaluating colocalization in biological microscopy. Am J Physiol Cell Physiol. 2011;300:C723–C742. doi: 10.1152/ajpcell.00462.2010. [DOI] [PMC free article] [PubMed] [Google Scholar]
- Eaholtz G, Scheuer T, Catterall WA. Restoration of inactivation and block of open sodium channels by an inactivation gate peptide. Neuron. 1994;12:1041–1048. doi: 10.1016/0896-6273(94)90312-3. [DOI] [PubMed] [Google Scholar]
- Fox PD, Loftus RJ, Tamkun MM. Regulation of Kv2.1 K(+) conductance by cell surface channel density. J Neurosci. 2013;33:1259–1270. doi: 10.1523/JNEUROSCI.3008-12.2013. [DOI] [PMC free article] [PubMed] [Google Scholar]
- Fox PD, Haberkorn CJ, Akin EJ, Seel PJ, Krapf D, Tamkun MM. Induction of stable ER-plasma-membrane junctions by Kv2.1 potassium channels. J Cell Sci. 2015;128:2096–2105. doi: 10.1242/jcs.166009. [DOI] [PMC free article] [PubMed] [Google Scholar]
- Frech GC, VanDongen AM, Schuster G, Brown AM, Joho RH. A novel potassium channel with delayed rectifier properties isolated from rat brain by expression cloning. Nature. 1989;340:642–645. doi: 10.1038/340642a0. [DOI] [PubMed] [Google Scholar]
- Gärtner U, Janke C, Holzer M, Vanmechelen E, Arendt T. Postmortem changes in the phosphorylation state of tau-protein in the rat brain. Neurobiol Aging. 1998;19:535–543. doi: 10.1016/S0197-4580(98)00094-3. [DOI] [PubMed] [Google Scholar]
- Gong S, Doughty M, Harbaugh CR, Cummins A, Hatten ME, Heintz N, Gerfen CR. Targeting Cre recombinase to specific neuron populations with bacterial artificial chromosome constructs. J Neurosci. 2007;27:9817–9823. doi: 10.1523/JNEUROSCI.2707-07.2007. [DOI] [PMC free article] [PubMed] [Google Scholar]
- Greig LC, Woodworth MB, Galazo MJ, Padmanabhan H, Macklis JD. Molecular logic of neocortical projection neuron specification, development and diversity. Nat Rev Neurosci. 2013;14:755–769. doi: 10.1038/nrn3586. [DOI] [PMC free article] [PubMed] [Google Scholar]
- Groh A, Meyer HS, Schmidt EF, Heintz N, Sakmann B, Krieger P. Cell-type specific properties of pyramidal neurons in neocortex underlying a layout that is modifiable depending on the cortical area. Cereb Cortex. 2010;20:826–836. doi: 10.1093/cercor/bhp152. [DOI] [PubMed] [Google Scholar]
- Guan D, Tkatch T, Surmeier DJ, Armstrong WE, Foehring RC. Kv2 subunits underlie slowly inactivating potassium current in rat neocortical pyramidal neurons. J Physiol. 2007;581:941–960. doi: 10.1113/jphysiol.2007.128454. [DOI] [PMC free article] [PubMed] [Google Scholar]
- Guan D, Armstrong WE, Foehring RC. Kv2 channels regulate firing rate in pyramidal neurons from rat sensorimotor cortex. J Physiol. 2013;591:4807–4825. doi: 10.1113/jphysiol.2013.257253. [DOI] [PMC free article] [PubMed] [Google Scholar]
- Guan D, Armstrong WE, Foehring RC. Electrophysiological properties of genetically identified subtypes of layer 5 neocortical pyramidal neurons: Ca2+ dependence and differential modulation by norepinephrine. J Neurophysiol. 2015;113:2014–2032. doi: 10.1152/jn.00524.2014. [DOI] [PMC free article] [PubMed] [Google Scholar]
- Gündisch S, Grundner-Culemann K, Wolff C, Schott C, Reischauer B, Machatti M, Groelz D, Schaab C, Tebbe A, Becker KF. Delayed times to tissue fixation result in unpredictable global phosphoproteome changes. J Proteome Res. 2013;12:4424–4434. doi: 10.1021/pr400451z. [DOI] [PubMed] [Google Scholar]
- Hattox AM, Nelson SB. Layer V neurons in mouse cortex projecting to different targets have distinct physiological properties. J Neurophysiol. 2007;98:3330–3340. doi: 10.1152/jn.00397.2007. [DOI] [PubMed] [Google Scholar]
- Hermanstyne TO, Kihira Y, Misono K, Deitchler A, Yanagawa Y, Misonou H. Immunolocalization of the voltage-gated potassium channel Kv2.2 in GABAergic neurons in the basal forebrain of rats and mice. J Comp Neurol. 2010;518:4298–4310. doi: 10.1002/cne.22457. [DOI] [PMC free article] [PubMed] [Google Scholar]
- Hermanstyne TO, Subedi K, Le WW, Hoffman GE, Meredith AL, Mong JA, Misonou H. Kv2.2: a novel molecular target to study the role of basal forebrain GABAergic neurons in the sleep-wake cycle. Sleep. 2013;36:1839–1848. doi: 10.5665/sleep.3212. [DOI] [PMC free article] [PubMed] [Google Scholar]
- Herrington J. Gating modifier peptides as probes of pancreatic beta-cell physiology. Toxicon. 2007;49:231–238. doi: 10.1016/j.toxicon.2006.09.012. [DOI] [PubMed] [Google Scholar]
- Herrington J, Zhou YP, Bugianesi RM, Dulski PM, Feng Y, Warren VA, Smith MM, Kohler MG, Garsky VM, Sanchez M, Wagner M, Raphaelli K, Banerjee P, Ahaghotu C, Wunderler D, Priest BT, Mehl JT, Garcia ML, McManus OB, Kaczorowski GJ, et al. Blockers of the delayed-rectifier potassium current in pancreatic beta-cells enhance glucose-dependent insulin secretion. Diabetes. 2006;55:1034–1042. doi: 10.2337/diabetes.55.04.06.db05-0788. [DOI] [PubMed] [Google Scholar]
- Hwang PM, Glatt CE, Bredt DS, Yellen G, Snyder SH. A novel K+ channel with unique localizations in mammalian brain: molecular cloning and characterization. Neuron. 1992;8:473–481. doi: 10.1016/0896-6273(92)90275-I. [DOI] [PubMed] [Google Scholar]
- Hwang PM, Fotuhi M, Bredt DS, Cunningham AM, Snyder SH. Contrasting immunohistochemical localizations in rat brain of two novel K+ channels of the Shab subfamily. J Neurosci. 1993;13:1569–1576. doi: 10.1523/JNEUROSCI.13-04-01569.1993. [DOI] [PMC free article] [PubMed] [Google Scholar]
- Ito T, Nuriya M, Yasui M. Regulation of Kv2.1 phosphorylation in an animal model of anoxia. Neurobiol Dis. 2010;38:85–91. doi: 10.1016/j.nbd.2010.01.002. [DOI] [PubMed] [Google Scholar]
- Jacobson DA, Kuznetsov A, Lopez JP, Kash S, Ammälä CE, Philipson LH. Kv2.1 ablation alters glucose-induced islet electrical activity, enhancing insulin secretion. Cell Metab. 2007;6:229–235. doi: 10.1016/j.cmet.2007.07.010. [DOI] [PMC free article] [PubMed] [Google Scholar]
- Johnston J, Griffin SJ, Baker C, Skrzypiec A, Chernova T, Forsythe ID. Initial segment Kv2.2 channels mediate a slow delayed rectifier and maintain high-frequency action potential firing in medial nucleus of the trapezoid body neurons. J Physiol. 2008;586:3493–3509. doi: 10.1113/jphysiol.2008.153734. [DOI] [PMC free article] [PubMed] [Google Scholar]
- Khazen G, Hill SL, Schürmann F, Markram H. Combinatorial expression rules of ion channel genes in juvenile rat (Rattus norvegicus) neocortical neurons. PLoS One. 2012;7:e34786. doi: 10.1371/journal.pone.0034786. [DOI] [PMC free article] [PubMed] [Google Scholar]
- Kihira Y, Hermanstyne TO, Misonou H. Formation of heteromeric Kv2 channels in mammalian brain neurons. J Biol Chem. 2010;285:15048–15055. doi: 10.1074/jbc.M109.074260. [DOI] [PMC free article] [PubMed] [Google Scholar]
- King AN, Manning CF, Trimmer JS. A unique ion channel clustering domain on the axon initial segment of mammalian neurons. J Comp Neurol. 2014;522:2594–2608. doi: 10.1002/cne.23551. [DOI] [PMC free article] [PubMed] [Google Scholar]
- Le Bé JV, Silberberg G, Wang Y, Markram H. Morphological, electrophysiological, and synaptic properties of corticocallosal pyramidal cells in the neonatal rat neocortex. Cereb Cortex. 2007;17:2204–2213. doi: 10.1093/cercor/bhl127. [DOI] [PubMed] [Google Scholar]
- Leone DP, Heavner WE, Ferenczi EA, Dobreva G, Huguenard JR, Grosschedl R, McConnell SK. Satb2 regulates the differentiation of both callosal and subcerebral projection neurons in the developing cerebral cortex. Cereb Cortex. 2015;25:3406–3419. doi: 10.1093/cercor/bhu156. [DOI] [PMC free article] [PubMed] [Google Scholar]
- Lim ST, Antonucci DE, Scannevin RH, Trimmer JS. A novel targeting signal for proximal clustering of the Kv2.1 K+ channel in hippocampal neurons. Neuron. 2000;25:385–397. doi: 10.1016/S0896-6273(00)80902-2. [DOI] [PubMed] [Google Scholar]
- Liu PW, Bean BP. Kv2 channel regulation of action potential repolarization and firing patterns in superior cervical ganglion neurons and hippocampal CA1 pyramidal neurons. J Neurosci. 2014;34:4991–5002. doi: 10.1523/JNEUROSCI.1925-13.2014. [DOI] [PMC free article] [PubMed] [Google Scholar]
- Maletic-Savatic M, Lenn NJ, Trimmer JS. Differential spatiotemporal expression of K+ channel polypeptides in rat hippocampal neurons developing in situ and in vitro. J Neurosci. 1995;15:3840–3851. doi: 10.1523/JNEUROSCI.15-05-03840.1995. [DOI] [PMC free article] [PubMed] [Google Scholar]
- Malin SA, Nerbonne JM. Delayed rectifier K+ currents, IK, are encoded by Kv2 alpha-subunits and regulate tonic firing in mammalian sympathetic neurons. J Neurosci. 2002;22:10094–10105. doi: 10.1523/JNEUROSCI.22-23-10094.2002. [DOI] [PMC free article] [PubMed] [Google Scholar]
- Mandikian D, Bocksteins E, Parajuli LK, Bishop HI, Cerda O, Shigemoto R, Trimmer JS. Cell type-specific spatial and functional coupling between mammalian brain Kv2.1 K(+) channels and ryanodine receptors. J Comp Neurol. 2014;522:3555–3574. doi: 10.1002/cne.23641. [DOI] [PMC free article] [PubMed] [Google Scholar]
- Manning CF, Bundros AM, Trimmer JS. Benefits and pitfalls of secondary antibodies: why choosing the right secondary is of primary importance. PLoS One. 2012;7:e38313. doi: 10.1371/journal.pone.0038313. [DOI] [PMC free article] [PubMed] [Google Scholar]
- Martin KA. Microcircuits in visual cortex. Curr Opin Neurobiol. 2002;12:418–425. doi: 10.1016/S0959-4388(02)00343-4. [DOI] [PubMed] [Google Scholar]
- Mason A, Larkman A. Correlations between morphology and electrophysiology of pyramidal neurons in slices of rat visual cortex. II. Electrophysiology. J Neurosci. 1990;10:1415–1428. doi: 10.1523/JNEUROSCI.10-05-01415.1990. [DOI] [PMC free article] [PubMed] [Google Scholar]
- Misonou H, Mohapatra DP, Park EW, Leung V, Zhen D, Misonou K, Anderson AE, Trimmer JS. Regulation of ion channel localization and phosphorylation by neuronal activity. Nat Neurosci. 2004;7:711–718. doi: 10.1038/nn1260. [DOI] [PubMed] [Google Scholar]
- Misonou H, Mohapatra DP, Menegola M, Trimmer JS. Calcium- and metabolic state-dependent modulation of the voltage-dependent Kv2.1 channel regulates neuronal excitability in response to ischemia. J Neurosci. 2005;25:11184–11193. doi: 10.1523/JNEUROSCI.3370-05.2005. [DOI] [PMC free article] [PubMed] [Google Scholar]
- Misonou H, Menegola M, Mohapatra DP, Guy LK, Park KS, Trimmer JS. Bidirectional activity-dependent regulation of neuronal ion channel phosphorylation. J Neurosci. 2006;26:13505–13514. doi: 10.1523/JNEUROSCI.3970-06.2006. [DOI] [PMC free article] [PubMed] [Google Scholar]
- Mohapatra DP, Trimmer JS. The Kv2.1 C terminus can autonomously transfer Kv2.1-like phosphorylation-dependent localization, voltage-dependent gating, and muscarinic modulation to diverse Kv channels. J Neurosci. 2006;26:685–695. doi: 10.1523/JNEUROSCI.4620-05.2006. [DOI] [PMC free article] [PubMed] [Google Scholar]
- Mohapatra DP, Siino DF, Trimmer JS. Interdomain cytoplasmic interactions govern the intracellular trafficking, gating, and modulation of the Kv2.1 channel. J Neurosci. 2008;28:4982–4994. doi: 10.1523/JNEUROSCI.0186-08.2008. [DOI] [PMC free article] [PubMed] [Google Scholar]
- Mohapatra DP, Misonou H, Pan SJ, Held JE, Surmeier DJ, Trimmer JS. Regulation of intrinsic excitability in hippocampal neurons by activity-dependent modulation of the KV2.1 potassium channel. Channels (Austin) 2009;3:46–56. doi: 10.4161/chan.3.1.7655. [DOI] [PMC free article] [PubMed] [Google Scholar]
- Murakoshi H, Trimmer JS. Identification of the Kv2.1 K+ channel as a major component of the delayed rectifier K+ current in rat hippocampal neurons. J Neurosci. 1999;19:1728–1735. doi: 10.1523/JNEUROSCI.19-05-01728.1999. [DOI] [PMC free article] [PubMed] [Google Scholar]
- Nieto M, Monuki ES, Tang H, Imitola J, Haubst N, Khoury SJ, Cunningham J, Gotz M, Walsh CA. Expression of Cux-1 and Cux-2 in the subventricular zone and upper layers II-IV of the cerebral cortex. J Comp Neurol. 2004;479:168–180. doi: 10.1002/cne.20322. [DOI] [PubMed] [Google Scholar]
- O'Connell KM, Loftus R, Tamkun MM. Localization-dependent activity of the Kv2.1 delayed-rectifier K+ channel. Proc Natl Acad Sci U S A. 2010;107:12351–12356. doi: 10.1073/pnas.1003028107. [DOI] [PMC free article] [PubMed] [Google Scholar]
- Oka T, Tagawa K, Ito H, Okazawa H. Dynamic changes of the phosphoproteome in postmortem mouse brains. PLoS One. 2011;6:e21405. doi: 10.1371/journal.pone.0021405. [DOI] [PMC free article] [PubMed] [Google Scholar]
- Osakada F, Callaway EM. Design and generation of recombinant rabies virus vectors. Nat Protoc. 2013;8:1583–1601. doi: 10.1038/nprot.2013.094. [DOI] [PMC free article] [PubMed] [Google Scholar]
- Park KS, Mohapatra DP, Trimmer JS. Proteomic analyses of K(v)2.1 channel phosphorylation sites determining cell background specific differences in function. Channels (Austin) 2007;1:59–61. doi: 10.4161/chan.4388. [DOI] [PubMed] [Google Scholar]
- Reiner A, Jiao Y, Del Mar N, Laverghetta AV, Lei WL. Differential morphology of pyramidal tract-type and intratelencephalically projecting-type corticostriatal neurons and their intrastriatal terminals in rats. J Comp Neurol. 2003;457:420–440. doi: 10.1002/cne.10541. [DOI] [PubMed] [Google Scholar]
- Reiner A, Hart NM, Lei W, Deng Y. Corticostriatal projection neurons: dichotomous types and dichotomous functions. Front Neuroanat. 2010;4:142. doi: 10.3389/fnana.2010.00142. [DOI] [PMC free article] [PubMed] [Google Scholar]
- Rhodes KJ, Trimmer JS. Antibodies as valuable neuroscience research tools vs. reagents of mass distraction. J Neurosci. 2006;26:8017–8020. doi: 10.1523/JNEUROSCI.2728-06.2006. [DOI] [PMC free article] [PubMed] [Google Scholar]
- Rhodes KJ, Keilbaugh SA, Barrezueta NX, Lopez KL, Trimmer JS. Association and colocalization of K+ channel alpha- and beta-subunit polypeptides in rat brain. J Neurosci. 1995;15:5360–5371. doi: 10.1523/JNEUROSCI.15-07-05360.1995. [DOI] [PMC free article] [PubMed] [Google Scholar]
- Rhodes KJ, Carroll KI, Sung MA, Doliveira LC, Monaghan MM, Burke SL, Strassle BW, Buchwalder L, Menegola M, Cao J, An WF, Trimmer JS. KChIPs and Kv4 alpha subunits as integral components of A-type potassium channels in mammalian brain. J Neurosci. 2004;24:7903–7915. doi: 10.1523/JNEUROSCI.0776-04.2004. [DOI] [PMC free article] [PubMed] [Google Scholar]
- Scannevin RH, Murakoshi H, Rhodes KJ, Trimmer JS. Identification of a cytoplasmic domain important in the polarized expression and clustering of the Kv2.1 K+ channel. J Cell Biol. 1996;135:1619–1632. doi: 10.1083/jcb.135.6.1619. [DOI] [PMC free article] [PubMed] [Google Scholar]
- Schnell SA, Staines WA, Wessendorf MW. Reduction of lipofuscin-like autofluorescence in fluorescently labeled tissue. J Histochem Cytochem. 1999;47:719–730. doi: 10.1177/002215549904700601. [DOI] [PubMed] [Google Scholar]
- Sheets PL, Suter BA, Kiritani T, Chan CS, Surmeier DJ, Shepherd GM. Corticospinal-specific HCN expression in mouse motor cortex: I(h)-dependent synaptic integration as a candidate microcircuit mechanism involved in motor control. J Neurophysiol. 2011;106:2216–2231. doi: 10.1152/jn.00232.2011. [DOI] [PMC free article] [PubMed] [Google Scholar]
- Shepherd GM. Corticostriatal connectivity and its role in disease. Nat Rev Neurosci. 2013;14:278–291. doi: 10.1038/nrn3469. [DOI] [PMC free article] [PubMed] [Google Scholar]
- Shi G, Kleinklaus AK, Marrion NV, Trimmer JS. Properties of Kv2.1 K+ channels expressed in transfected mammalian cells. J Biol Chem. 1994;269:23204–23211. [PubMed] [Google Scholar]
- Speca DJ, Ogata G, Mandikian D, Bishop HI, Wiler SW, Eum K, Wenzel HJ, Doisy ET, Matt L, Campi KL, Golub MS, Nerbonne JM, Hell JW, Trainor BC, Sack JT, Schwartzkroin PA, Trimmer JS. Deletion of the Kv2.1 delayed rectifier potassium channel leads to neuronal and behavioral hyperexcitability. Genes Brain Behav. 2014;13:394–408. doi: 10.1111/gbb.12120. [DOI] [PMC free article] [PubMed] [Google Scholar]
- Stuart GJ, Dodt HU, Sakmann B. Patch-clamp recordings from the soma and dendrites of neurons in brain slices using infrared video microscopy. Pflugers Arch. 1993;423:511–518. doi: 10.1007/BF00374949. [DOI] [PubMed] [Google Scholar]
- Suter BA, Migliore M, Shepherd GM. Intrinsic electrophysiology of mouse corticospinal neurons: a class-specific triad of spike-related properties. Cereb Cortex. 2013;23:1965–1977. doi: 10.1093/cercor/bhs184. [DOI] [PMC free article] [PubMed] [Google Scholar]
- Tipparaju SM, Bhatnagar A. Pipette internal perfusion: methods and applications. In: Walz W, editor. Patch-clamp analysis. New York: Humana; 2007. pp. 309–324. [Google Scholar]
- Toledo-Rodriguez M, Blumenfeld B, Wu C, Luo J, Attali B, Goodman P, Markram H. Correlation maps allow neuronal electrical properties to be predicted from single-cell gene expression profiles in rat neocortex. Cereb Cortex. 2004;14:1310–1327. doi: 10.1093/cercor/bhh092. [DOI] [PubMed] [Google Scholar]
- Trimmer JS. Immunological identification and characterization of a delayed rectifier K+ channel polypeptide in rat brain. Proc Natl Acad Sci U S A. 1991;88:10764–10768. doi: 10.1073/pnas.88.23.10764. [DOI] [PMC free article] [PubMed] [Google Scholar]
- Trimmer JS. Expression of Kv2.1 delayed rectifier K+ channel isoforms in the developing rat brain. FEBS Lett. 1993;324:205–210. doi: 10.1016/0014-5793(93)81394-F. [DOI] [PubMed] [Google Scholar]
- Trimmer JS. Subcellular localization of K+ channels in mammalian brain neurons: remarkable precision in the midst of extraordinary complexity. Neuron. 2015;85:238–256. doi: 10.1016/j.neuron.2014.12.042. [DOI] [PMC free article] [PubMed] [Google Scholar]
- Trimmer JS, Misonou H. Handbook of ion channels. Boca Raton, FL: CRC; 2015. Phosphorylation of voltage-gated ion channels; pp. 531–544. [Google Scholar]
- Vacher H, Mohapatra DP, Trimmer JS. Localization and targeting of voltage-dependent ion channels in mammalian central neurons. Physiol Rev. 2008;88:1407–1447. doi: 10.1152/physrev.00002.2008. [DOI] [PMC free article] [PubMed] [Google Scholar]
- Wegener AD, Jones LR. Phosphorylation-induced mobility shift in phospholamban in sodium dodecyl sulfate-polyacrylamide gels: evidence for a protein structure consisting of multiple identical phosphorylatable subunits. J Biol Chem. 1984;259:1834–1841. [PubMed] [Google Scholar]
- Wickersham IR, Finke S, Conzelmann KK, Callaway EM. Retrograde neuronal tracing with a deletion-mutant rabies virus. Nat Methods. 2007;4:47–49. doi: 10.1038/nmeth999. [DOI] [PMC free article] [PubMed] [Google Scholar]
- Wilson CJ. Morphology and synaptic connections of crossed corticostriatal neurons in the rat. J Comp Neurol. 1987;263:567–580. doi: 10.1002/cne.902630408. [DOI] [PubMed] [Google Scholar]
- Wimmer VC, Bruno RM, de Kock CP, Kuner T, Sakmann B. Dimensions of a projection column and architecture of VPM and POm axons in rat vibrissal cortex. Cereb Cortex. 2010;20:2265–2276. doi: 10.1093/cercor/bhq068. [DOI] [PMC free article] [PubMed] [Google Scholar]