

Abstract
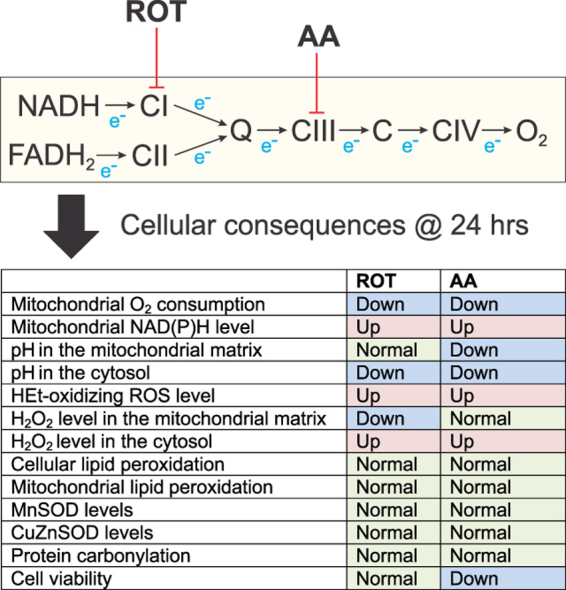
Inhibitor studies with isolated mitochondria demonstrated that complex I (CI) and III (CIII) of the electron transport chain (ETC) can act as relevant sources of mitochondrial reactive oxygen species (ROS). Here we studied ROS generation and oxidative stress induction during chronic (24 h) inhibition of CI and CIII using rotenone (ROT) and antimycin A (AA), respectively, in intact HEK293 cells. Both inhibitors stimulated oxidation of the ROS sensor hydroethidine (HEt) and increased mitochondrial NAD(P)H levels without major effects on cell viability. Integrated analysis of cells stably expressing cytosolic- or mitochondria-targeted variants of the reporter molecules HyPer (H2O2-sensitive and pH-sensitive) and SypHer (H2O2-insensitive and pH-sensitive), revealed that CI- and CIII inhibition increased cytosolic but not mitochondrial H2O2 levels. Total and mitochondria-specific lipid peroxidation was not increased in the inhibited cells as reported by the C11-BODIPY581/591 and MitoPerOx biosensors. Also expression of the superoxide-detoxifying enzymes CuZnSOD (cytosolic) and MnSOD (mitochondrial) was not affected. Oxyblot analysis revealed that protein carbonylation was not stimulated by CI and CIII inhibition. Our findings suggest that chronic inhibition of CI and CIII: (i) increases the levels of HEt-oxidizing ROS and (ii) specifically elevates cytosolic but not mitochondrial H2O2 levels, (iii) does not induce oxidative stress or substantial cell death. We conclude that the increased ROS levels are below the stress-inducing level and might play a role in redox signaling.
Abbreviations: AA, antimycin A; CI, complex I or NADH: Ubiquinone oxidoreductase; CIII, complex III or Ubiquinol-cytochrome c oxidoreductase; Δψ, mitochondrial membrane potential; ETC, electron transport chain; FCCP, carbonyl cyanide-p-trifluoromethoxyphenylhydrazone; HEt, hydroethidine; [H2O2]c, cytosolic hydrogen peroxide concentration; [H2O2]ext, extracellular hydrogen peroxide concentration; [H2O2]m, mitochondrial hydrogen peroxide concentration; IMS, intermembrane space; MIM, mitochondrial inner membrane; MOM, mitochondrial outer membrane; OXPHOS, oxidative phosphorylation; PMF, proton motive force; RET, reverse electron transfer; ROS, reactive oxygen species; ROT, rotenone
Keywords: Hydroethidine, HyPer, SypHer, Oxyblot
Graphical abstract
Highlights
-
•
Chronic inhibition of mitochondrial CI and CIII increases HEt-oxidizing ROS levels.
-
•
CI and CIII inhibition selectively elevates cytosolic hydrogen peroxide levels.
-
•
Oxidative stress or major cell death induction were not detected.
-
•
This suggests that the increased ROS levels might play a role in redox signaling.
1. Introduction
Dysfunction of the mitochondrial electron transport chain (ETC) due to mutations in OXPHOS subunits or induced by chemical inhibitors is generally associated with increased mitochondrial reactive oxygen species (ROS) production [2], [18], [27], [31]. These ROS include the superoxide anion (), hydrogen peroxide (H2O2) and the extremely reactive hydroxyl radical (OH•), with each species displaying specific reactivity, specific range of action and distinct molecular targets [11], [12]. When exceeding the capacity of the cell's antioxidant systems, increased ROS production triggers oxidative stress and cell death. Mitochondria contain both ETC-linked and non ETC-linked pathways for ROS production [46]. For example, isolated mitochondria can generate ROS via ETC complexes I, II and III (CI, CII, CIII), monoamino oxidase, α-ketoglutarate dehydrogenase, glycerophosphate dehydrogenase, dihydro-orotate dehydrogenase, electron transfer flavoprotein dehydrogenase, branched-chain 2-oxoacid dehydrogenase, pyruvate dehydrogenase and p66shc/cytochrome c [7], [49], [56], [58], [66]. Importantly, the relevance of each of these enzymes during increased mitochondrial ROS production is tissue-specific and depends on the metabolic and experimental condition [68].
In case of the ETC, CI and CIII are generally considered the most important contributors to mitochondrial ROS production in intact cells [7], [49]. The chemical CI inhibitor rotenone (ROT) was demonstrated to stimulate production at the NADH oxidizing flavin group and/or at the CoQ-binding site [7]. However, when the PMF (proton motive force) is sufficiently large, CI can also generate large quantities of via reverse electron transfer (RET) from CII to CI that is inhibited by ROT [44], [49]. Moreover, it appears that CI can also directly catalyse H2O2 formation [29]. Evidence was provided that produced by CI is specifically released towards the mitochondrial matrix, whereas inhibition of the Qi site of CIII with antimycin A (AA) in the presence of reduced coenzyme Q10 releases large amounts of from the Qo site into both the mitochondrial matrix and the intermembrane space [7], [70]. However, CI appears to constitute the main source of mitochondrial under physiological conditions [28], [49], [57].
While ROS quantification in isolated mitochondria generally yields consistent results, proper interpretation of live-cell ROS measurements still remains challenging. This relates to the fact that mitochondrial ROS can be produced using different mitochondrial substrates, are removed by (local) antioxidant systems, and/or are difficult to specifically detect at the cellular level [23], [32], [78]. For instance, primary neuronal cell lines and immortalized mouse embryonic fibroblasts from mice with isolated CI deficiency (NDUFS4-/- mice; [41]) do not display increased ROS levels [10], [72], as reported by oxidation of the ROS reporter molecule hydroethidine (HEt). In contrast, primary muscle or skin fibroblasts isolated from these mice exhibited increased HEt oxidation [73]. Similarly, oxidation of HEt and 5-(and-6)-chloromethyl-2’,7’-dichlorodihydro-fluorescein (CM-H2DCF) was increased in primary skin fibroblasts of patients with inherited CI deficiency [34], [38], [67], [75]. Interestingly, increased HEt and CM-H2DCF oxidation was not paralleled by alterations in thiol redox status and cellular lipid peroxidation in these cells [45], [76]. This suggests that the ROS increase is still below the stress-inducing level and might play a signaling role [15], [16], [20], [39], [50], [66], [71], [74], [79].
We recently used HEK293 cells to analyze the bioenergetic consequences of chronic (24 h) CI and CIII inhibition by ROT or AA, respectively [24]. The latter study revealed that these treatments inhibited mitochondrial oxygen (O2) consumption and induced a glycolytic phenotype without off-target effects. Here this experimental model was used to determine whether CI and CIII inhibition increased ROS levels and triggered oxidative stress. Our results demonstrate that CI and CIII inhibition is associated with increased HEt-oxidation and elevated cytosolic but not mitochondrial H2O2 levels. However, no experimental evidence of oxidative stress, massive cell death or protein carbonylation was found. This suggests that the magnitude of the inhibition-induced increase in ROS level does not exceed the capacity of the cell's antioxidant systems.
2. Materials and methods
2.1. Generation of inducible HEK293 cell lines stably expressing cytosolic and mitochondria-targeted variants of HyPer and SypHer
Gateway® Entry vectors were generated by recombining Gateway-adapted PCR products containing the sequence encoding cyto-HyPer and mito-HyPer from pHyPer-cyto and pHyPer-dMito vectors (Evrogen, Moscow, Russia) with pDONR201 (Invitrogen, Breda, The Netherlands). A Gateway-adapted tag-less pcDNA/FRT/TO Destination vector was created by recombining the acGFP1-Destination vector [17] with a BacMamVSV-Destination vector [33]. Recombining the HyPer Entry vectors with this Destination vector using the LR Clonase II Enzyme Mix (Invitrogen) yielded the pcDNA5/FRT/TO/mito-HyPer and pcDNA5/FRT/TO/cyto-HyPer expression vectors. Targeting to the mitochondrial matrix was achieved by the presence of two N-terminally fused cox8 mitochondrial targeting sequences (2MTS). To create constructs encoding the pH sensor SypHer, the mito-HyPer and cyto-HyPer Entry vectors were mutated at a critical cysteine residue by site-directed mutagenesis as described previously [53]. These new Entry vectors were also recombined with the Gateway-adapted pcDNA/FRT/TO Destination vector to obtain mito-SypHer and cyto-SypHer expression vectors. Flp-In T-REx293 cells (Invitrogen) were stably transfected with the expression vectors described above using the Superfect Transfection Reagent (Qiagen, Venlo, The Netherlands) and cultured for selection in the presence of 200 µg/ml hygromycin (Calbiochem, Brunschwig, Amsterdam, The Netherlands) and 50 µg/ml blasticidin (Invitrogen). To induce expression of the biosensor, 1 µg/ml doxycyclin (Sigma-Aldrich, Zwijndrecht, The Netherlands) was added to the culture medium, followed by incubation for 24 h.
2.2. Cell culture and inhibitor treatment
Flp-In T-REx293 cells were cultured in DMEM containing 25 mM glucose, 2 mM L-glutamine, 10% (v/v) fetal calf serum and 1% penicillin/streptomycin in a humidified atmosphere containing 5% CO2 at 37°C. Prior to transfection, parental Flp-In T-REx293 cells were cultured in the presence of 50 µg/ml blasticidin and 100 µg/ml Zeocin (Invitrogen). For fluorescence microscopy, 100,000 cells were seeded on 24-mm coverslips (Thermo Scientific, Etten-Leur, The Netherlands) placed in 35-mm CellStar tissue culture dishes (Sigma-Aldrich) two days prior to imaging to achieve a 70% confluence at the day of imaging. For the determination of superoxide dismutase protein levels, cells were grown to 80% confluence. One day after seeding, cells were treated with ROT or AA for 24 h and compared with vehicle (0.1% ethanol)-treated control (CT) cells.
2.3. Cell viability analysis
Cell viability was assessed using the crystal violet assay. Cells were seeded in 48 well plates and stained with crystal violet solution (0.5% crystal violet, 30% ethanol, 3% formaldehyde). Plates were rinsed with water and crystal violet internalized by the cells was re-solubilized in 1% SDS solution. Absorbance at 550 nm was measured using a microplate spectrophotometer (Benchmark Plus, Biorad, The Netherlands). Results were expressed as percentage of cell viability relative to untreated controls.
2.4. Fluorescence imaging of hydroethidine oxidation
Flp-In. T-REx293 cells were incubated with 10 µM HEt (Invitrogen) in harvested culture medium for 10 min at 37°C and 5% CO2 in the dark. The HEt oxidation reaction was terminated by thoroughly washing the cells with PBS to remove excess HEt. Subsequently, the cells were covered by a colorless HEPES–Tris (HT) buffer (containing 132 mM NaCl, 10 mM Hepes, 4.2 mM KCl, 1 mM MgCl2, 1 mM CaCl2 and 25 mM d-glucose, adjusted to pH 7.4 with Tris salt). To quantify fluorescent HEt oxidation products, coverslips were mounted in an incubation chamber that was placed on the temperature-controlled (37°C) stage of an inverted microscope (Axiovert 200M, Carl Zeiss, Jena, Germany) equipped with a Zeiss ×40 1.3 NA Fluar objective. The cells were excited for 100 ms at 490 nm using a monochromator (Polychrome IV, TILL Photonics, Gräfelfing, Germany). Fluorescence light from the cells was directed onto a CoolSNAP HQ monochrome CCD-camera (Roper Scientific, Vianen, The Netherlands) using a 525DRLP dichroic mirror (Omega Optical Inc., Brattleboro, VT, USA) and a 565ALP emission filter (Omega Optical Inc). The hardware was controlled using Metafluor 6.0 software (Universal Imaging Corporation, Downingtown, PA, USA). Ten random fields of view were routinely analyzed per coverslip using MetaMorph 6.1 software (Universal Imaging Corporation). For time-lapse experiments involving the mitochondrial uncoupler carbonyl cyanide-p-trifluoromethoxyphenylhydrazone (FCCP), images were recorded every 6 s.
2.5. Fluorescence imaging of HyPer and SypHer
For imaging the above described microscopy system was used. Five to 10 min prior to imaging, cells were covered by HT buffer. HyPer and SypHer were alternatingly excited at 420 nm and 470 nm for 200 ms using a 505DRLPXR and 505DRLPXR dichroic mirror (Omega Optical Inc.). Emission signals were directed through a 535AF45 (Omega Optical Inc.) emission filter onto the CCD camera. 10–15 Random fields of view were routinely analyzed per coverslip using MetaMorph 6.1 software (Universal Imaging Corporation).
2.6. Fluorescence imaging of lipid peroxidation
For imaging the above described microscopy system was used. Cellular and mitochondria-specific lipid peroxidation were assessed using the C11-BODIPY581/591 (Invitrogen) and a mitochondria-targeted variant of this molecule (MitoPerOx; [55]) biosensor, respectively. Cells were washed with PBS, covered with HT buffer (see above) and mounted onto an inverted microscope equipped with a ×40 1.3 NA Fluar oil-immersion objective. C11-BODIPY581/591 and MitoPerOx display similar spectral properties and were excited at 488 nm for 200 ms using a 505DRLPXR dichroic mirror (Omega Optical Inc.). Emission signals were detected using 510BW40 (oxidized form) and 565ALP (non-oxidized form) emission filters (Omega Optical Inc). 10–15 Random fields of view were routinely analyzed per coverslip using MetaMorph 6.1 software (Universal Imaging Corporation).
2.7. Fluorescence imaging of NAD(P)H autofluorescence
Cellular NAD(P)H autofluorescence was excited for 1000 ms at 360 nm using a 430DCLP (Omega) dichroic mirror and 510BW40 (Omega) emission filter. A mitochondria-dense region of interest was used to quantify NAD(P)H autofluorescence intensity as described previously [76].
2.8. Superoxide dismutase protein levels
Cells (1–1.5×10⁶) were harvested in ice-cold PBS. The cell suspension was centrifuged for 5 min at 1500 g and snap-frozen in liquid nitrogen. Cells were homogenized in three freeze-thaw cycles at −20°C. Following a boiling step for 5 min at 95°C in sample buffer, the samples were separated on a 10% SDS-PAGE gel. Next, the proteins were electrophoretically transferred to a PVDF membrane (Millipore, Amsterdam, The Netherlands). After blotting, the membranes were blocked for 45 min with one part Odyssey blocking buffer (Li-Cor, Lincoln, NE, USA) and one part 0.1% v/v Tween-20 containing PBS (PBS-T). The blots were rinsed twice with PBS-T and incubated with polyclonal anti-CuZnSOD (1:2000; ITK Diagnostics bv), polyclonal anti-MnSOD (1:2500; ITK diagnostics bv), polyclonal anti-Porin (1:1000; Calbiochem) or monoclonal anti-β-Actin (1:100,000; Sigma). For detection, IRDye 680-Conjugated Goat Anti-Mouse IgG, Highly Cross Adsorbed (Li-Cor) and IRDye 800CW-Conjugated Goat Anti-Rabbit IgG (Li-Cor) secondary antibodies were used. IRDye fluorescence was quantified using an Odyssey Imaging system (Li-Cor).
2.9. Protein carbonylation (Oxyblot)
At 40–60% confluence, cells were treated with 100 nM ROT or 100 nM AA. Cells were harvested after 24 h by centrifugation (5 min, 1000 g) and the cell pellet was washed once with 1 ml PBS containing 1 mM DTT and resuspended in 10 mM Tris–EDTA buffer containing 10 µg/ml DNase. After three freeze/thaw cycles in liquid nitrogen the suspension was stored at −20°C. Protein carbonyl levels were determined by immunoblotting using the Oxyblot assay kit (Merck Millipore, Temecula, CA, USA) with some slight modifications. 10 µl samples (~50 µg protein) were denatured with 10 µl 12% SDS and then derivatized with 20 µl 2,4-dinitrophenylhydrazine (DNPH) to the corresponding 2,4-dinitrophenylhydrazone (DNP). After 15 min at RT the reaction was stopped with 15 µl Neutralization buffer and the samples were diluted 2 times with 2× SDS-sample buffer, further neutralized with TRIS, and 20–40 µl was run on a 10% SDS-PAGE gel. Next, protein was transferred electrophoretically to a PVDF membrane using the iBlot system (Life Technologies). After blotting membranes were blocked with Odyssey Blocking Buffer (Li-Cor) mixed 1:1 with PBS-Tween20 (0.1%, w/v) for 1 h at room temperature. Next, blots were incubated overnight at room temperature with the polyclonal antibody directed against DNP (Millipore) and the monoclonal antibody against β-actin (Sigma Aldrich) in the Odyssey-PBS-Tween buffer. Subsequently, blots were washed (3–5 times) with PBS-Tween and incubated with the secondary goat antibodies against rabbit and mouse IRdye 680 and IRdye 800 (Li-Cor) in the above mentioned buffer for 45 min at room temperature. After washing with PBS-Tween, PBS and water, the PVDF membranes were air dried in the dark. Finally, fluorescence signals were quantified using the Odyssey Imaging system (Li-Cor).
2.10. Data analysis
Fluorescence signals of HEt, HyPer, SypHer, MitoPerOx and C11-BODIPY581/591 were quantified by defining a region of interest (ROI) in the appropriate part of the cell (e.g. mitochondria, nucleus, cytosol) as described previously [24], [36], [55]. Cellular signals were background-corrected using an extracellular ROI close to the cell-of-interest. Curve fitting was performed using Origin Pro 6.1 (OriginLab Corp., Northampton, MA, USA). Unless stated otherwise, data is presented as mean±SE (standard error) and statistical significance (*P<0.05, **P<0.01 and ***P<0.001) was assessed using a Kruskal–Wallis 2-way ANOVA following Dunn's multiple comparison test or a Mann–Whitney t-test using Graphpad Prism 5 software (GraphPad Software Inc., La Jolla, CA, USA).
3. Results
3.1. Inhibition of CI or CIII stimulates the rate of hydroethidine oxidation
Hydroethidine (HEt) is a cell permeable non-fluorescent reporter molecule that, upon oxidation, is converted into cationic fluorescent products [84]. Due to their positive charge, HEt oxidation products become cell impermeable and primarily accumulate in the mitochondrial matrix (“Mit” due to its negative membrane potential; Δψ) and the nucleus (“Nuc” by binding to negatively-charged nucleoli). HEK293 cells were incubated with 100 nM ROT or AA for 24 h [24] and, subsequently, the rate of HEt oxidation was measured [25]. To this end (Fig. 1A; inset), a mitochondria-dense region (“m”) of interest (ROI) in the cytosol and a nuclear (“n”) ROI was defined for each cell as described previously [75]. In the presence of extracellular HEt (10 µM), the fluorescence of the HEt oxidation products linearly increased over time in vehicle- (CT), ROT- and AA-treated cells during at least 10 min (Fig. 1A). This linearity demonstrates that HEt oxidation occurs via a 0th-order reaction mechanism [37] meaning that the rate of fluorescence increase is a measure of the level of HEt-oxidizing ROS. The latter allows assessment of the HEt oxidation rate by an end-point measurement (i.e. by incubating the cells for 10 min with HEt, followed by washing away the extracellular HEt and subsequent measurement of fluorescent HEt oxidation products).
Fig. 1.

Hydroethidine oxidation, cell viability and mitochondrial NAD(P)H levels in CI- and CIII-inhibited HEK293 cells. (A) Increase in fluorescence signal of HEt oxidation products in a mitochondrial (Mit) and nuclear (Nuc) region of interest (inset: n,m) in the presence of 10 µM HEt (arrow). Cells were pre-treated (24 h) with vehicle (CT), the CI-inhibitor ROT (100 nM) or the CIII-inhibitor AA (100 nM). Each trace reflects the average signal of 6–14 individual cells and the straight lines represents a linear fit to the data (R>0.99, p<0.0001). (B) Change in fluorescence signal of mitochondrial and nuclear HEt oxidation products induced by acute application of the protonophore FCCP (average of 6 cells pre-stained with HEt and in the absence of extracellular HEt). An exponential fit (R>0.99) was used to determine the time constant of the fluorescence change (τ). (C) Fluorescence signal of HEt oxidation products in mitochondrial (Mit) and nuclear (Nuc) regions of interest in cells pre-incubated with HEt. Each bar represents the average of >40 cells (from at least 2 independent experiments) treated with vehicle (CT), ROT or AA for 24 h at 100 nM. (D) Effect of ROT and AA (100 nM, 24 h) on cell density. (E) Effect of ROT and AA (100 nM, 24 h) on cell viability. (F) Effect of ROT- and AA-treatment (100 nM, 24 h) on mitochondrial NAD(P)H autofluorescence. Statistics: the data in panel C, E and F was expressed as percentage of the average value of the CT condition measured on the same day. Numerals represent the number of individual wells (panel E) or cells (panel F) analyzed in at least 3 independent experiments. Statistically significant differences with the indicated columns (a,b,c,d) were assessed using a 2-way ANOVA test.
In the continuous presence of extracellular HEt (Fig. 1A) the rate of fluorescence increase (in gray value/min) equalled: 2.63±0.06 (CT, Mit), 1.58±0.04 (CT, Nuc), 4.05±0.03 (ROT, Mit), 2.39±0.03 (ROT, Nuc), 4.52±0.04 (AA, Mit) and 3.09±0.17 (AA, Nuc). This demonstrates that fluorescence signals increased more rapidly in the mitochondrial than in the nuclear compartment for CT and inhibitor-treated cells. ROT treatment stimulated the rate of HEt oxidation signal increase to a similar extent for the mitochondrial (1.54-fold) and nuclear compartment (1.51-fold). In contrast, AA treatment induced a faster increase in the nuclear (1.96-fold) than mitochondrial signal (1.71-fold). Since HEt oxidation products are positively charged, ROT- or AA-induced changes in Δψ could potentially affect the mitochondrial and thereby the nuclear fluorescence intensity. Using the protonophore carbonyl cyanide-p-trifluoromethoxyphenylhydrazone (FCCP) we demonstrated previously in primary human skin fibroblasts that Δψ depolarization induces translocation of HEt oxidation products from the mitochondrial to the nuclear compartment [36]. The same phenomenon was observed in HEK293 cells (following pre-staining and in the absence of extracellular HEt), as reflected by the FCCP-induced loss of fluorescence from the mitochondrial compartment and parallel fluorescence increase in the nuclear compartment with similar kinetics (Fig. 1B). We previously demonstrated that ROT- and AA-treatment (100 nM, 24 h) induced a mild Δψ hyperpolarization and pronounced Δψ depolarization, respectively, in HEK293 cells [24]. However, in ROT-treated cells the rate of fluorescence increase was similarly increased for the mitochondrial and nuclear compartment (1.54- vs. 1.51-fold). This suggests that the ROT-induced Δψ hyperpolarization does not enhance the accumulation of HEt oxidation products in these compartments. In contrast, AA-induced Δψ depolarization was associated with a slower increase in the mitochondrial than in the nuclear compartment (1.71- vs. 1.96-fold). This asymmetric increase is compatible with Δψ depolarization stimulating translocation of HEt-oxidation products from the mitochondrial to nuclear compartment. Irrespective of the effect of Δψ hyperpolarization (ROT) and depolarization (AA), the larger increase in HEt-oxidation in AA-treated relative to ROT-treated cells strongly suggests that the level of HEt-oxidizing ROS is higher in the former cells. When cells were pre-incubated with HEt (10 µM, 10 min), washed and subsequently imaged (end-point measurement), ROT- and AA-treatment both increased the mitochondrial and nuclear fluorescence intensity (Fig. 1C). In summary, these results demonstrate that ROT- and AA-treatment increase the levels of HEt-oxidizing ROS and that this increase is larger for AA than for ROT.
3.2. Inhibition of CI or CIII does not induce substantial cell death and increases mitochondrial NAD(P)H level
We previously demonstrated that 24 h treatment with 100 nM ROT or AA greatly reduced mitochondrial O2 consumption in HEK293 cells [24]. Visual inspection suggested that cell density was unaffected at 100 nM inhibitor concentration (Fig. 1D). Analysis of cell viability confirmed that ROT treatment did not affect this parameter, whereas AA induced a minor reduction (Fig. 1E). Under these conditions, ROT- and AA- treatment increased mitochondrial NAD(P)H autofluorescence (Fig. 1F), compatible with previous results obtained in cells with genetic and inhibitor-induced CI deficiency (e.g. [39], [72], [75]). Taken together, our results suggest that the increased levels of HEt-oxidizing ROS in ROT- or AA-treated HEK293 cells do not induce massive lethal oxidative stress, and are associated with increased mitochondrial NADH levels. Next we studied whether CI and CIII inhibition affected the levels of hydrogen peroxide (H2O2), lipid peroxidation and superoxide dismutases (SODs) in the mitochondrial and cytosolic compartment.
3.3. Characterization of the HyPer and SypHer biosensors in HEK293 cells
SODs convert superoxide () into H2O2, which can passively diffuse across membranes and thereby act as a cytosolic and extracellular signaling molecule [6], [39], [48], [74]. To quantify H2O2 levels ([H2O2]) in the cytosol and mitochondrial matrix we used the protein-based reporter molecule “HyPer” [4]. HyPer consists of a circularly permuted (cpYFP) inserted into the H2O2-sensitive regulatory domain of the E. coli transcription regulator OxyR. This construct is also pH-sensitive and therefore we mutated a critical HyPer cysteine residue (C199S) to obtain the biosensor “SypHer”. The latter is H2O2-insensitive and can be used as a HyPer-control and pH sensor [24], [53]. To allow subcellular analysis of H2O2 levels, we created four HEK293 cell lines that stably expressed HyPer (Fig. 2A) or SypHer (not shown) in the cytosol or mitochondrial matrix. Intracellular changes in [H2O2] are expected to occur within the nM to low µM range [9] and the minimal [H2O2]ext required to evoke a detectable change in the HyPer ratio signal was previously estimated to be ~5 µM [4]. In HEK293 cells the cytosolic HyPer ratio signal half-maximally increased at a concentration of 9.12±3.68 µM of [H2O2]ext (Fig. 2B). Acute application of 200 µM extracellular H2O2 ([H2O2]ext) induced a 2-fold increase in cyto-HyPer and mito-HyPer ratio signal (Fig. 2C), demonstrating that exogenous H2O2 rapidly crosses cellular and mitochondrial membranes. Application of the reducing agent dithiothreitol (DTT, 10 mM) returned the cyto-HyPer signal to levels slightly below basal in the presence of 50 µM [H2O2]ext (Fig. 2D; left panel). This demonstrates that DTT also crosses cellular membranes and lowers the levels of HyPer-oxidizing ROS. The SypHer ratio signal did not respond to a challenge with 50 µM [H2O2]ext but subsequently increased (at higher pH) and decreased (at lower pH) induced by transient extracellular NH4Cl application (Fig. 2D; right panel). Importantly, HyPer and SypHer ratio changes were caused by changes in the emission from 420 and 470 nm excitation in opposite directions, indicative of a cpYFP conformational change (Fig. 2C and D; lower panels). These results demonstrate that HyPer is both H2O2 and pH-sensitive whereas SypHer is H2O2-insensitive and pH-sensitive. In the next set of experiments we applied this information to specifically determine H2O2 levels and relative pH in the cytosol and mitochondrial matrix of inhibitor-treated cells.
Fig. 2.

Properties of targeted HyPer and SypHer variants in HEK 293 cells (A) Typical microscopy images of HEK293 cells stably expressing HyPer in the cytosol (cyto-HyPer) and mitochondrial matrix (mito-HyPer). (B) Effect of various extracellular H2O2 concentrations on the maximal cyto-HyPer ratio. The latter was calculated by dividing the maximal ratio value (Rmax) by the pre-H2O2 ratio (R0) for multiple cells (n=5) measured in two independent experiments. The experimental data was fitted using a sigmoidal (Logistic) fitting equation. (C) Effect of extracellular H2O2 application on the ratio signal (480 nm/420 nm) of cyto-HyPer and mito-HyPer (upper panel) and their individual 420 nm and 480 nm signals (lower panel). (D) Same as panel B but now for the effect of extracellular H2O2, the reducing agent dithiothreitol (DTT) and NH4Cl on the signals of cyto-HyPer (left part) and cyto-SypHer (right part).
3.4. Inhibition of CI or CIII increases cytosolic but not mitochondrial hydrogen peroxide levels
In CT cells, HyPer and SypHer ratios in the cytosol were lower than in the mitochondrial matrix (Fig. 3A; open bars; SypHer data taken from [24]). This is compatible with the mitochondrial matrix being more alkaline than the cytosol [47]. Given this pH-difference and the pH-sensitivity of HyPer the increased mitochondrial HyPer signal (Fig. 3A; filled bars) cannot be taken as direct evidence of a higher [H2O2] in the mitochondrial matrix ([H2O2]m). When correcting the HyPer signal for pH-induced changes (i.e. by dividing the mean HyPer ratio by the mean SypHer ratio) values of 0.69 (cyto-Hyper) and 0.82 were obtained (mito-Hyper). This suggests that the steady-state [H2O2]m is (slightly) higher than the steady state [H2O2] in the cytosol ([H2O2]c). ROT treatment did not affect the cyto-HyPer signal whereas AA slightly increased this parameter (Fig. 3B; left panel). Both inhibitors reduced the mito-HyPer signal (Fig. 3B; right panel). ROT and AA treatment reduced the cyto-SypHer signal, whereas the mito-SypHer signal was only lowered in AA-treated cells (Fig. 3C; data taken from [24]). Correcting the HyPer signals for pH effects by dividing them by the corresponding SypHer signals revealed that ROT and AA significantly increased the cyto-HyPer signal (Fig. 3D; left panel). In agreement with the HEt results, this increase was larger in AA-treated than in ROT-treated cells. In contrast, no increase in mitochondrial HyPer signal was observed (Fig. 3D; right panel). These results suggest that ROT and AA inhibition do not elevate [H2O2]m but significantly increase [H2O2]c albeit to a variable extent.
Fig. 3.

Hydrogen peroxide levels, pH, and lipid peroxidation in CI- and CIII-inhibited HEK293 cells. (A) Cytosolic and mitochondrial ratio signals for HyPer and SypHer in vehicle-treated (CT) cells. (B) Cyto-HyPer and mito-HyPer ratio signals in cells treated with vehicle (CT), 100 nM ROT or 100 nM AA for 24 h. (C) Same as panel B, but now for SypHer. (D) Cyto-HyPer and mito-HyPer ratio signals corrected for the effects on pH reported by SypHer (see Results for details). (E) Typical fluorescence microscopy images of living cells stained with C11- BODIPY581/591 (total cellular lipid peroxidation) or MitoPerOx (mitochondria-specific lipid peroxidation). (F) Effect of H2O2 (50 min) and the MIM-targeted antioxidant MitoQ (24 h) on the MitoPerOx fluorescence ratio. (G) C11- BODIPY581/591and MitoPerOx ratio signals in cells treated with vehicle, ROT or AA. Statistics: Data was expressed as percentage of the average value of the CT condition measured on the same day. Numerals represent the number of analyzed cells from at least 3 independent experiments. Statistically significant differences with the indicated columns (a,b) was assessed using a 2-way ANOVA test.
3.5. Inhibition of CI or CIII does not induce cellular or mitochondrial lipid peroxidation
Increased ROS levels are associated with peroxidation of cellular and mitochondrial lipids during oxidative stress induction [3]. Given the ROS increase detected by the HEt and HyPer sensors we next determined whether total and mitochondria-specific lipid peroxidation was affected by ROT- or AA-treatment in living HEK293 cells. To this end we applied the classical fluorescent lipid peroxidation probe C11-BODIPY581/591 [19]. Moreover, we used a novel C11-BODIPY581/591 (MitoPerOx; Fig. 3E) targeted to the mitochondrial inner membrane (MIM; [55]). Using primary human skin fibroblasts, we previously demonstrated the responsiveness of the C11-BODIPY581/591 sensor towards exogenous H2O2 application (20 µM, 2 min) [23]. In HEK293 cells, treatment with H2O2 (50 µM, 50 min) slightly increased the MitoPerOx fluorescence ratio (Fig. 3F). Conversely, this ratio was slightly decreased upon treatment with the MIM-targeted antioxidant MitoQ10 (10 nM, 24 h; Fig. 3F). ROT and AA treatment did not increase the C11-BODIPY581/591 signal (Fig. 3G; left panel). The MitoPerOx ratio was slightly but significantly increased in AA but not in ROT-treated cells (Fig. 3G; right panel). These results suggest that peroxidation of cellular and MIM lipids is not greatly increased by inhibitor treatment, arguing against induction of oxidative stress.
3.6. Inhibition of CI or CIII does not increase superoxide dismutase protein levels
Under conditions of oxidative stress, high superoxide () levels are linked to increased expression of SODs [21], [22], [51], [52]. These enzymes convert to hydrogen peroxide (H2O2) at very high rates [69]. The SOD family includes copper–zinc–SOD (CuZnSOD or SOD1) in the cytosol and mitochondrial intermembrane space (IMS), and manganese-SOD (MnSOD or SOD2) in the mitochondrial matrix. Western blot analysis revealed that neither ROT nor AA treatment induced a consistent and significant increase in CuZnSOD and MnSOD protein levels (Fig. 4A). These results suggest that ROT and AA treatment do not increase ROS to a level that is sufficiently high for induction of SOD expression, supporting our above conclusion that oxidative stress is virtually absent.
Fig. 4.

CI- and CIII-inhibition do not induce superoxide dismutase protein levels and protein carbonylation in HEK293 cells. (A) Western blot analysis of MnSOD and CuZnSOD protein levels. For each data point the CuZnSOD level (filled symbols) was normalized to β-Actin protein levels. MnSOD levels (open symbols) were normalized to mitochondrial Porin. The mean±SEM in ROT- and AA-treated cells reflects several independent experiments (i.e. individual symbols) and is marked by horizontal lines. (B) Oxyblot signal (DNP-protein) in cells treated with vehicle (CT), 100 nM ROT or AA for 24 h. Actin was used as a loading control. Statistics: Data was expressed as percentage of the average value of the CT condition measured on the same day in at least 3 independent experiments (panel A). Panel B reflects a typical example of 2 independent experiments.
3.7. Inhibition of CI or CIII does not induce protein carbonylation
Both ROS and lipid peroxidation products can induce oxidation of specific amino acids, resulting in formation of stable carbonyl (–CO) groups (aldehydes and ketones) on protein side chains [5], [13], [65]. Protein carbonyls are generated by oxidative modification via direct reaction with ROS (Glu, Thr, Asp, Lys, Arg Pro; [42], [43]), due to reaction (of Cys and Lys) with lipid peroxidation products like 4-hydroxynonenal (4-HNE) and malondialdehyde (MDA; [82]), or by reaction with reducing sugars [83]. Upon carbonylation, protein function can be lost and/or proteins undergo proteasome-dependent degradation [82]. A frequently used method to detect protein carbonylation is the “Oxyblot” strategy [83], in which protein carbonyl groups are allowed to react with 2,4-dinitrophenylhydrazine (DNPH) yielding 2,4-dinitrophenylhydrazone (DNP). The latter are subsequently detected using SDS-PAGE followed by Western blot analysis with a DNP-specific antibody [81]. Neither ROT- nor AA-treatment detectably altered the Oxyblot signal (Fig. 4B), suggesting that ROT- and AA-treatment do not induce protein carbonylation in HEK293 cells.
4. Discussion
Mitochondrial dysfunction has been associated with increased ROS levels, either in the presence or absence of oxidative stress [21], [23], [40], [49], [51], [52]. Here we demonstrate that chronic CI and CIII inhibition differentially stimulate HEt-oxidation and cytosolic H2O2 levels in HEK293 cells and that this ROS increase is not associated with oxidative stress induction.
4.1. CI and CIII inhibition differentially stimulate HEt oxidation
HEt specifically reacts with to form 2-hydroxyethidium (2-OH–Et+) or can act as a hydride acceptor to yield ethidium (Et+). Both 2-OH–Et+ and Et+ display similar spectral properties ([35], [60], [61]). Therefore it is challenging to independently measure their fluorescence signal in single living cells. In this study we measured the combined fluorescence signal of 2-OH–Et+ and Et+ (“HEt-oxidation products”). In the continuous presence of extracellular HEt, its oxidation products progressively accumulated in the mitochondrial and nuclear compartment. In vehicle- and inhibitor-treated cells mitochondrial fluorescence signals increased faster than nuclear signals (Fig. 1A). As a consequence, mitochondrial signals were higher than nuclear signals suggesting that the HEt-oxidation products residing in the nucleus are of mitochondrial origin [36]. In contrast to primary human skin fibroblasts [36], HEK293 cells displayed higher mitochondrial than nuclear signals, compatible with a mechanism in which HEt is oxidized faster in HEK293 mitochondria or that these cells more effectively retain HEt oxidation products in the mitochondrial matrix. The latter might suggest that HEK293 cells possess a more negative Δψ than human skin fibroblasts. The level of HEt-oxidizing ROS were higher in AA- than in ROT-treated cells. This is compatible with previous results in isolated nerve terminals demonstrating that, when fully inhibited, the magnitude of CI-derived ROS is less than that observed for CIII-derived ROS [64]. AA-treatment fully blocked O2 consumption in HEK293 cells, whereas ROT-treatment was associated with a low (<10%) residual (CII-mediated) O2 consumption [24]. In this sense, the higher NAD(P)H level in AA-treated relative to ROT-treated cells might reflect the more complete block of the ETC by AA, associated with enhanced stimulation of glycolysis and ensuing NADH production.
4.2. CI and CIII inhibition differentially increase cytosolic H2O2 levels
To quantify [H2O2] in the cytosol and mitochondrial matrix we used targeted variants of the cpYFP-based sensor HyPer. The pH-corrected HyPer ratio in the mitochondrial matrix was similar in vehicle- and inhibitor-treated cells, demonstrating that H2O2 levels in this compartment are not detectably increased by ROT- or AA-treatment. This result suggests that very little H2O2 is formed or that it is effectively removed from or within this compartment. The latter is in line with the idea that mitochondria can act as cellular sinks of H2O2 [8], [66]. In contrast, CI and CIII inhibition significantly increased cytosolic H2O2 levels. This might be explained by results obtained with isolated mitochondria, which demonstrate that CI releases into the IMS, whereas CIII releases this ROS both into the matrix and mitochondrial intermembrane space at equal rates (see [7] and the references therein). Since cannot freely cross the MIM it will form H2O2 in the compartment in which it has been generated, after which it freely permeates through biological membranes [39]. Compatible with the HEt measurements, cytosolic H2O2 levels increased to a greater extent in CIII- than in CI-inhibited cells. In case of CI, the (minimal) cytosolic H2O2 increase might originate from CI-derived that is formed in the matrix and converted into H2O2 reaching the cytosol. In case of CIII, the cytosolic H2O2 likely derives from that is released by CIII into the IMS and converted in H2O2. Under certain conditions RET from CII to CI can lead to CI-mediated ROS production. However, this RET and ensuing H2O2 production is inhibited by the CI inhibitor ROT [56], [63]. Since we here observed that ROT- and AA-treatment increased HEt-oxidation and cytosolic H2O2 levels it is unlikely that RET mediates the ROS increases.
4.3. ROS generation and the role of Δψ in CI- and CIII-inhibited cells
Using conditions identical to this study, we previously demonstrated that ROT- and AA-treatment induce a mild Δψ hyperpolarization and a relatively large Δψ depolarization, respectively [24]. Experimental evidence suggests that CI-mediated ROS production during ROT inhibition is independent of the mitochondrial proton motive force (PMF) and stimulated by an increase in NADH/NAD+ ratio [49], [63], [77]. This is compatible with the observed Δψ hyperpolarization, increased NAD(P)H autofluorescence and elevated HEt-oxidation in ROT-treated HEK293 cells. Furthermore, this suggests that CI-mediated ROS production might contribute to the increased HEt-oxidation in AA-treated cells. ROS production by CIII increases exponentially with Δψ in the absence of AA [62]. In contrast, CIII-mediated ROS production is virtually Δψ-independent in the presence of AA [30]. Combined experimental and in silico analysis suggested a bell-shaped dependency of the rate of CIII-mediated generation on the fraction of reduced quinone, with maximum generation reached at a fraction of ~0.6 [30]. Taken together, this explains why Δψ hyperpolarization (ROT) and depolarization (AA) are both associated with increased ROS levels in HEK293 cells.
4.4. CI and CIII inhibition does not stimulate SOD expression, lipid peroxidation and protein carbonylation
ROT- and AA-treated cells did not display increased levels of CuZnSOD and MnSOD, cellular/mitochondrial lipid peroxidation or protein carbonylation. Compatible with these results, cellular lipid peroxidation was not increased in fibroblasts of patients with isolated CI deficiency that displayed increased ROS levels [76]. However, as illustrated by our results with exogenous H2O2 and MitoQ, live-cell analysis of C11-BODIPY581/591 and MitoPerOx might be not be sensitive enough to detect small increases in lipid peroxidation [23], [55].
Both ROS and lipid peroxidation products are capable to induce carbonylation of protein side chains [5], [14], [65]. In this sense, protein carbonylation was increased in cybrid cells bearing mtDNA mutations [54] and neuronal cells from NDUFS4-/- mice with isolated CI deficiency (NesKO mice; [59]). Here we observed that ROT- and AA-treatment did not stimulate protein carbonylation. Similarly, short (10 min) AA treatment failed to stimulate protein carbonylation in 143B osteosarcoma-derived cells [26]. Interestingly, high CuZnSOD levels are required to limit levels and cellular protein carbonylation is increased upon CuZnSOD knockdown [1]. The same study revealed that ROT treatment (500 nM, 24 h) induced death in CuZnSOD knockdown cells. Liver mitochondria from heterozygous MnSOD−/+ mice displayed a reduction in MnSOD activity of 50% [80]. This reduction was paralleled by increased carbonylation of mitochondrial but not cytosolic proteins. In this study, inhibitor treatment did not stimulate CuZnSOD/MnSOD protein levels, did not markedly reduce cell attachment/viability, and did not increase lipid peroxidation or protein carbonylation. This suggests that CuZnSOD and MnSOD activities in HEK293 cells are high enough to prevent ROS-induced oxidative stress, and that the additional ROS generated in ROT- and AA-treated cells act not as stressors but might play a signaling role.
Acknowledgments
This research was supported by a Grant from the Netherlands Organization for Scientific Research (NWO, No: 911-02-008), the Energy4All foundation, the NWO Centres for Systems Biology Research initiative (CSBR09/013V), and a grant from the Institute for Genetic and Metabolic Disease (IGMD) of the Radboud University Medical Centre (RUMC) to W.J.H.K. We thank Dr. M.P. Murphy (MRC Mitochondrial Biology Unit, Cambridge, UK) for providing MitoQ10 (“MitoQ”) and the MitoPerOx biosensor.
References
- 1.Aquilano K., Vigilanza P., Rotilio G., Ciriolo M.R. Mitochondrial damage due to SOD1 deficiency in SH-SY5Y neuroblastoma cells: a rationale for the redundancy of SOD1. Faseb J. 2006;20:1683–1685. doi: 10.1096/fj.05-5225fje. [DOI] [PubMed] [Google Scholar]
- 2.Barja G. Updating the mitochondrial free radical theory of aging: an integrated view, key aspects, and confounding concepts. Antioxid. Redox Signal. 2013;19:1420–1445. doi: 10.1089/ars.2012.5148. [DOI] [PMC free article] [PubMed] [Google Scholar]
- 3.Barrientos A., Moraes C.T. Titrating the effects of mitochondrial complex I impairment in the cell physiology. J. Biol. Chem. 1999;274:16188–16197. doi: 10.1074/jbc.274.23.16188. [DOI] [PubMed] [Google Scholar]
- 4.Belousov V.V., Fradkov A.F., Lukyanov K.A., Staroverov D.B., Shakhbazov K.S., Terskikh A.V., Lukyanov S. Genetically encoded fluorescent indicator for intracellular hydrogen peroxide. Nat. Methods. 2006;3:281–286. doi: 10.1038/nmeth866. [DOI] [PubMed] [Google Scholar]
- 5.Bentinger M., Brismar K., Dallner G. The antioxidant role of coenzyme Q. Mitochondrion. 2007;7(Suppl.):S41–50. doi: 10.1016/j.mito.2007.02.006. [DOI] [PubMed] [Google Scholar]
- 6.Bindoli A., Rigobello M.P. Principles in redox signaling: from chemistry to functional significance. Antioxid. Redox Signal. 2013;18:1557–1593. doi: 10.1089/ars.2012.4655. [DOI] [PubMed] [Google Scholar]
- 7.Brand M.D. The sites and topology of mitochondrial superoxide production. Exp. Gerontol. 2010;45:466–472. doi: 10.1016/j.exger.2010.01.003. [DOI] [PMC free article] [PubMed] [Google Scholar]
- 8.Brown G.C., Borutaite V. There is no evidence that mitochondria are the main source of reactive oxygen species in mammalian cells. Mitochondrion. 2012;12:1–4. doi: 10.1016/j.mito.2011.02.001. [DOI] [PubMed] [Google Scholar]
- 9.Chance B., Sies H., Boveris A. Hydroperoxide metabolism in mammalian organs. Physiol. Rev. 1979;59:527–605. doi: 10.1152/physrev.1979.59.3.527. [DOI] [PubMed] [Google Scholar]
- 10.Choi W.S., Kruse S.E., Palmiter R.D., Xia Z. Mitochondrial complex I inhibition is not required for dopaminergic neuron death induced by rotenone, MPP+, or paraquat. Proc. Natl. Acad. Sci. USA. 2008;105:15136–15141. doi: 10.1073/pnas.0807581105. [DOI] [PMC free article] [PubMed] [Google Scholar]
- 11.Collins Y., Chouchani E.T., James A.M., Menger K.E., Cocheme H.M., Murphy M.P. Mitochondrial redox signalling at a glance. J. Cell. Sci. 2012;125:801–806. doi: 10.1242/jcs.098475. [DOI] [PubMed] [Google Scholar]
- 12.D’Autréaux B., Toledano M.B. ROS as signalling molecules: mechanisms that generate specificity in ROS homeostasis. Nat. Rev. Mol. Cell. Biol. 2007;8:813–824. doi: 10.1038/nrm2256. [DOI] [PubMed] [Google Scholar]
- 13.Dalle-Donne I., Rossi R., Giustarini D., Milzani A., Colombo R. Protein carbonyl groups as biomarkers of oxidative stress. Clin. Chim. acta. 2003;329:23–38. doi: 10.1016/s0009-8981(03)00003-2. [DOI] [PubMed] [Google Scholar]
- 14.Dalle-Donne I., Giustarini D., Colombo R., Rossi R., Milzani A. Protein carbonylation in human disease. Trends Mol. Med. 2003;9:169–176. doi: 10.1016/s1471-4914(03)00031-5. [DOI] [PubMed] [Google Scholar]
- 15.Dalle-Donne I., Rossi R., Giustarini D., Colombo R., Milzani A. S-glutathionylation in protein redox regulation. Free Radic. Biol. Med. 2007;43:883–898. doi: 10.1016/j.freeradbiomed.2007.06.014. [DOI] [PubMed] [Google Scholar]
- 16.Dickinson B.C., Chang C.J. Chemistry and biology of reactive oxygen species in signaling or stress responses. Nat. Chem. Biol. 2011;7:504–511. doi: 10.1038/nchembio.607. [DOI] [PMC free article] [PubMed] [Google Scholar]
- 17.Dieteren C.E.J., Koopman W.J., Swarts H.G., Peters J.G., Maczuga P., van Gemst J.J., Masereeuw R., Smeitink J.A., Nijtmans L.G., Willems P.H. Subunit-specific incorporation efficiency and kinetics in mitochondrial complex I homeostasis. J. Biol. Chem. 2012;287:41851–41860. doi: 10.1074/jbc.M112.391151. [DOI] [PMC free article] [PubMed] [Google Scholar]
- 18.Distelmaier F., Koopman W.J., van den Heuvel L.P., Rodenburg R.J., Mayatepek E., Willems P.H., Smeitink J.A. Mitochondrial complex I deficiency: from organelle dysfunction to clinical disease. Brain. 2009;132:833–842. doi: 10.1093/brain/awp058. [DOI] [PubMed] [Google Scholar]
- 19.Drummen G.P.C., van Liebergen L.C., Op den Kamp J.A., Post J.A. C11-BODIPY(581/591), an oxidation-sensitive fluorescent lipid peroxidation probe: (micro)spectroscopic characterization and validation of methodology. Free Radic. Biol. Med. 2002;33:473–490. doi: 10.1016/s0891-5849(02)00848-1. [DOI] [PubMed] [Google Scholar]
- 20.Finkel T. Signal transduction by mitochondrial oxidants. J. Biol. Chem. 2012;287:4434–4440. doi: 10.1074/jbc.R111.271999. [DOI] [PMC free article] [PubMed] [Google Scholar]
- 21.Forbes J.M., Ke B.X., Nguyen T.V., Henstridge D.C., Penfold S.A., Laskowski A., Sourris K.C., Groschner L.N., Cooper M.E., Thorburn D.R., Coughlan M.T. Deficiency in mitochondrial complex I activity due to Ndufs6 gene trap insertion induces renal disease. Antioxid. Redox Signal. 2013;19:331–343. doi: 10.1089/ars.2012.4719. [DOI] [PubMed] [Google Scholar]
- 22.Ford R.J.J., Graham D.A., Denniss S.G., Quadrilatero J., Rush J.W. Glutathione depletion in vivo enhances contraction and attenuates endothelium-dependent relaxation of isolated rat aorta. Free Radic. Biol. Med. 2006;40:670–678. doi: 10.1016/j.freeradbiomed.2005.09.020. [DOI] [PubMed] [Google Scholar]
- 23.Forkink M., Smeitink J.A., Brock R., Willems P.H., Koopman W.J. Detection and manipulation of mitochondrial reactive oxygen species in mammalian cells. Biochim. Biophys. acta. 2010;1797:1034–1044. doi: 10.1016/j.bbabio.2010.01.022. [DOI] [PubMed] [Google Scholar]
- 24.Forkink M., Manjeri G.R., Liemburg-Apers D.C., Nibbeling E., Blanchard M., Wojtala A., Smeitink J.A., Wieckowski M.R., Willems P.H., Koopman W.J. Mitochondrial hyperpolarization during chronic complex I inhibition is sustained by low activity of complex II, III, IV and V. Biochim. Biophys. Acta. 2015;1837:1247–1256. doi: 10.1016/j.bbabio.2014.04.008. [DOI] [PubMed] [Google Scholar]
- 25.Forkink M., Willems P.H., Koopman W.J., Grefte S. Live-cell assessment of mitochondrial reactive oxygen species using dihydroethidine. Methods Mol. Biol. 2015;1264:161–169. doi: 10.1007/978-1-4939-2257-4_15. [DOI] [PubMed] [Google Scholar]
- 26.Fukui., Moraes C.T. Extended polyglutamine repeats trigger a feedback loop involving the mitochondrial complex III, the proteasome and huntingtin aggregates. Hum. Mol. Genet. 2007;16:783–797. doi: 10.1093/hmg/ddm023. [DOI] [PubMed] [Google Scholar]
- 27.Giacco F., Brownlee M. Oxidative stress and diabetic complications. Circ. Res. 2010;107:1058–1070. doi: 10.1161/CIRCRESAHA.110.223545. [DOI] [PMC free article] [PubMed] [Google Scholar]
- 28.Green K., Brand M.D., Murphy M.P. Prevention of mitochondrial oxidative damage as a therapeutic strategy in diabetes. Diabetes. 2004;53(Suppl 1):S110–118. doi: 10.2337/diabetes.53.2007.s110. [DOI] [PubMed] [Google Scholar]
- 29.Grivennikova V.G., Vinogradov A.D. Partitioning of superoxide and hydrogen peroxide production by mitochondrial respiratory complex I. Biochim. Biophys. Acta. 2013;1827:446–454. doi: 10.1016/j.bbabio.2013.01.002. [DOI] [PubMed] [Google Scholar]
- 30.Guillaud., Drose S., Kowald A., Brandt U., Klipp E. Superoxide production by cytochrome bc1 complex: a mathematical model. Biochim. Biophys. Acta. 2014;1837:1643–1652. doi: 10.1016/j.bbabio.2014.05.358. [DOI] [PubMed] [Google Scholar]
- 31.Halliwell B. Oxidative stress and cancer: have we moved forward? Biochem. J. 2007;401:1–11. doi: 10.1042/BJ20061131. [DOI] [PubMed] [Google Scholar]
- 32.Halliwell B., Whiteman M. Measuring reactive species and oxidative damage in vivo and in cell culture: how should you do it and what do the results mean? Br. J. Pharmacol. 2004;142:231–255. doi: 10.1038/sj.bjp.0705776. [DOI] [PMC free article] [PubMed] [Google Scholar]
- 33.Hoefs S.J.G., Dieteren C.E., Distelmaier F., Janssen R.J., Epplen A., Swarts H.G., Forkink M., Rodenburg R.J., Nijtmans L.G., Willems P.H., Smeitink J.A., van den Heuvel L.P. NDUFA2 complex I mutation leads to Leigh disease. Am. J. Hum. Genet. 2008;82:1306–1315. doi: 10.1016/j.ajhg.2008.05.007. [DOI] [PMC free article] [PubMed] [Google Scholar]
- 34.Iuso A., Scacco S., Piccoli C., Bellomo F., Petruzzella V., Trentadue R., Minuto M., Ripoli M., Capitanio N., Zeviani M., Papa S. Dysfunctions of cellular oxidative metabolism in patients with mutations in the NDUFS1 and NDUFS4 genes of complex I. J. Biol. Chem. 2006;281:10374–10380. doi: 10.1074/jbc.M513387200. [DOI] [PubMed] [Google Scholar]
- 35.Kalyanaraman. Dranka, Hardy B.P., Michalski M., Zielonka R., HPLC-based J. monitoring of products formed from hydroethidine-based fluorogenic probes--the ultimate approach for intra- and extracellular superoxide detection. Biochim. Biophys. Acta. 2014;1840:739–744. doi: 10.1016/j.bbagen.2013.05.008. [DOI] [PMC free article] [PubMed] [Google Scholar]
- 36.Koopman W.J., Verkaart S., Visch H.J., van der Westhuizen F.H., Murphy M.P., van den Heuvel L.W., Smeitink J.A., Willems P.H. Inhibition of complex I of the electron transport chain causes O2-. -mediated mitochondrial outgrowth. Am. J. Physiol. Cell. Physiol. 2005;288:C1440–1450. doi: 10.1152/ajpcell.00607.2004. [DOI] [PubMed] [Google Scholar]
- 37.Koopman W.J., Visch H.J., Smeitink J.A., Willems P.H. Simultaneous quantitative measurement and automated analysis of mitochondrial morphology, mass, potential, and motility in living human skin fibroblasts. Cytom. A. 2006;69:1–12. doi: 10.1002/cyto.a.20198. [DOI] [PubMed] [Google Scholar]
- 38.Koopman W.J., Verkaart S., Visch H.J., van Emst-de Vries S., Nijtmans L.G., Smeitink J.A., Willems P.H. Human NADH:ubiquinone oxidoreductase deficiency: radical changes in mitochondrial morphology? Am. J. Physiol. Cell. Physiol. 2007;293:C22–29. doi: 10.1152/ajpcell.00194.2006. [DOI] [PubMed] [Google Scholar]
- 39.Koopman W.J., Nijtmans L.G., Dieteren C.E., Roestenberg P., Valsecchi F., Smeitink J.A., Willems P.H. Mammalian mitochondrial complex I: biogenesis, regulation, and reactive oxygen species generation. Antioxid. Redox Signal. 2010;12:1431–1470. doi: 10.1089/ars.2009.2743. [DOI] [PubMed] [Google Scholar]
- 40.Koopman W.J., Willems P.H., Smeitink J.A. Monogenic mitochondrial disorders. N. Engl. J. Med. 2012;366:1132–1141. doi: 10.1056/NEJMra1012478. [DOI] [PubMed] [Google Scholar]
- 41.Kruse S.E., Watt W.C., Marcinek D.J., Kapur R.P., Schenkman K.A., Palmiter R.D. Mice with mitochondrial complex I deficiency develop a fatal encephalomyopathy. Cell. Metab. 2008;7:312–320. doi: 10.1016/j.cmet.2008.02.004. [DOI] [PMC free article] [PubMed] [Google Scholar]
- 42.Levine., Williams J.A., Stadtman E.R., Shacter E. Carbonyl assays for determination of oxidatively modified proteins. Methods Enzym. 1994;233:346–357. doi: 10.1016/s0076-6879(94)33040-9. [DOI] [PubMed] [Google Scholar]
- 43.Levine R.L. Carbonyl modified proteins in cellular regulation, aging, and disease. Free Radic. Biol. Med. 2002;32:790–796. doi: 10.1016/s0891-5849(02)00765-7. [DOI] [PubMed] [Google Scholar]
- 44.Liu Y., Fiskum G., Schubert D. Generation of reactive oxygen species by the mitochondrial electron transport chain. J. Neurochem. 2002;80:780–787. doi: 10.1046/j.0022-3042.2002.00744.x. [DOI] [PubMed] [Google Scholar]
- 45.Luo X., Pitkanen S., Kassovska-Bratinova S., Robinson B.H., Lehotay D.C. Excessive formation of hydroxyl radicals and aldehydic lipid peroxidation products in cultured skin fibroblasts from patients with complex I deficiency. J. Clin. Invest. 1997;99:2877–2882. doi: 10.1172/JCI119481. [DOI] [PMC free article] [PubMed] [Google Scholar]
- 46.Mailloux R.J., McBride S.L., Harper M.E. Unearthing the secrets of mitochondrial ROS and glutathione in bioenergetics. Trends Biochem. Sci. 2013;38:592–602. doi: 10.1016/j.tibs.2013.09.001. [DOI] [PubMed] [Google Scholar]
- 47.Matsuyama S., Llopis J., Deveraux Q.L., Tsien R.Y., Reed J.C. Changes in intramitochondrial and cytosolic pH: early events that modulate caspase activation during apoptosis. Nat. Cell. Biol. 2000;2:318–325. doi: 10.1038/35014006. [DOI] [PubMed] [Google Scholar]
- 48.Mishina N.M., Tyurin-Kuzmin P.A., Markvicheva K.N., Vorotnikov A.V., Tkachuk V.A., Laketa V., Schultz C., Lukyanov S., Belousov V.V. Does cellular hydrogen peroxide diffuse or act locally? Antioxid. Redox Signal. 2011;14:1–7. doi: 10.1089/ars.2010.3539. [DOI] [PubMed] [Google Scholar]
- 49.Murphy M.P. How mitochondria produce reactive oxygen species. Biochem. J. 2009;417:1–13. doi: 10.1042/BJ20081386. [DOI] [PMC free article] [PubMed] [Google Scholar]
- 50.Murphy M.P., Holmgren A., Larsson N.G., Halliwell B., Chang C.J., Kalyanaraman B., Rhee S.G., Thornalley P.J., Partridge L., Gems D., Nystrom T., Belousov V., Schumacker P.T., Winterbourn C.C. Unraveling the biological roles of reactive oxygen species. Cell. Metab. 2011;13:361–366. doi: 10.1016/j.cmet.2011.03.010. [DOI] [PMC free article] [PubMed] [Google Scholar]
- 51.Pitkanen S., Robinson B.H. Mitochondrial complex I deficiency leads to increased production of superoxide radicals and induction of superoxide dismutase. J. Clin. Invest. 1996;98:345–351. doi: 10.1172/JCI118798. [DOI] [PMC free article] [PubMed] [Google Scholar]
- 52.Pitkanen S., Merante F., McLeod D.R., Applegarth D., Tong T., Robinson B.H. Familial cardiomyopathy with cataracts and lactic acidosis: a defect in complex I (NADH-dehydrogenase) of the mitochondria respiratory chain. Pediatr. Res. 1996;39:513–521. doi: 10.1203/00006450-199603000-00021. [DOI] [PubMed] [Google Scholar]
- 53.Poburko D., Santo-Domingo J., Demaurex N. Dynamic regulation of the mitochondrial proton gradient during cytosolic calcium elevations. J. Biol. Chem. 2011;286:11672–11684. doi: 10.1074/jbc.M110.159962. [DOI] [PMC free article] [PubMed] [Google Scholar]
- 54.Prigone., Cortopassi G. Mitochondrial DNA deletions and chloramphenicol treatment stimulate the autophagic transcript ATG12. Autophagy. 2007;3:377–380. doi: 10.4161/auto.4239. [DOI] [PubMed] [Google Scholar]
- 55.Prime T.A., Forkink M., Logan A., Finichiu P.G., McLachlan J., Li Pun P.B., Koopman W.J., Larsen L., Latter M.J., Smith R.A., Murphy M.P. A ratiometric fluorescent probe for assessing mitochondrial phospholipid peroxidation within living cells. Free Radic. Biol. Med. 2012;53:544–553. doi: 10.1016/j.freeradbiomed.2012.05.033. [DOI] [PubMed] [Google Scholar]
- 56.Quinlan C.L., Orr A.L., Perevoshchikova I.V., Treberg J.R., Ackrell B.A., Brand M.D. Mitochondrial complex II can generate reactive oxygen species at high rates in both the forward and reverse reactions. J. Biol. Chem. 2012;287:27255–27264. doi: 10.1074/jbc.M112.374629. [DOI] [PMC free article] [PubMed] [Google Scholar]
- 57.Quinlan C.L., Perevoshchikova I.V., Hey-Mogensen M., Orr A.L., Brand M.D. Sites of reactive oxygen species generation by mitochondria oxidizing different substrates. Redox Biol. 2013;1:304–312. doi: 10.1016/j.redox.2013.04.005. [DOI] [PMC free article] [PubMed] [Google Scholar]
- 58.Quinlan C.L., Goncalves R.L., Hey-Mogensen M., Yadava N., Bunik V.I., Brand M.D. The 2-oxoacid dehydrogenase complexes in mitochondria can produce superoxide/hydrogen peroxide at much higher rates than complex I. J. Biol. Chem. 2014;289:8312–8325. doi: 10.1074/jbc.M113.545301. [DOI] [PMC free article] [PubMed] [Google Scholar]
- 59.Quintana A., Kruse S.E., Kapur R.P., Sanz E., Palmiter R.D. Complex I deficiency due to loss of Ndufs4 in the brain results in progressive encephalopathy resembling Leigh syndrome. Proc. Natl. Acad. Sci. USA. 2010;107:10996–11001. doi: 10.1073/pnas.1006214107. [DOI] [PMC free article] [PubMed] [Google Scholar]
- 60.Robinson K.M., Janes M.S., Pehar M., Monette J.S., Ross M.F., Hagen T.M., Murphy M.P., Beckman J.S. Selective fluorescent imaging of superoxide in vivo using ethidium-based probes. Proc. Natl. Acad. Sci. USA. 2006;103:15038–15043. doi: 10.1073/pnas.0601945103. [DOI] [PMC free article] [PubMed] [Google Scholar]
- 61.Robinson K.M., Janes M.S., Beckman J.S. The selective detection of mitochondrial superoxide by live cell imaging. Nat. Protoc. 2008;3:941–947. doi: 10.1038/nprot.2008.56. [DOI] [PubMed] [Google Scholar]
- 62.Rottenberg H., C.R., Trumpower B.L. Membrane potential greatly enhances superoxide generation by the cytochrome bc1 complex reconstituted into phospholipid vesicles. J. Biol. Chem. 2009;17:19203–19210. doi: 10.1074/jbc.M109.017376. [DOI] [PMC free article] [PubMed] [Google Scholar]
- 63.Shabalina I.G., Nedergaard J. Mitochondrial ('mild') uncoupling and ROS production: physiologically relevant or not? Biochem. Soc. Trans. 2011;39:1305–1309. doi: 10.1042/BST0391305. [DOI] [PubMed] [Google Scholar]
- 64.Sipos I., Tretter L., Adam-Vizi V. Quantitative relationship between inhibition of respiratory complexes and formation of reactive oxygen species in isolated nerve terminals. J. Neurochem. 2003;84:112–118. doi: 10.1046/j.1471-4159.2003.01513.x. [DOI] [PubMed] [Google Scholar]
- 65.Stadtman E.R. Oxidation of free amino acids and amino acid residues in proteins by radiolysis and by metal-catalyzed reactions. Annu. Rev. Biochem. 1993;62:797–821. doi: 10.1146/annurev.bi.62.070193.004053. [DOI] [PubMed] [Google Scholar]
- 66.Starkov A.A. The role of mitochondria in reactive oxygen species metabolism and signaling. Ann. N. Y. Acad. Sci. 2008;1147:37–52. doi: 10.1196/annals.1427.015. [DOI] [PMC free article] [PubMed] [Google Scholar]
- 67.Taddei M.L., Giannoni E., Raugei G., Scacco S., Sardanelli A.M., Papa S., Chiarugi P. Mitochondrial Oxidative Stress due to Complex I Dysfunction Promotes Fibroblast Activation and Melanoma Cell Invasiveness. J. Signal Transduct. 2012;684592:1–10. doi: 10.1155/2012/684592. [DOI] [PMC free article] [PubMed] [Google Scholar]
- 68.Tahara E.B., Navarete F.D., Kowaltowski A.J. Tissue-, substrate-, and site-specific characteristics of mitochondrial reactive oxygen species generation. Free. Radic. Biol. Med. 2009;46:1283–1297. doi: 10.1016/j.freeradbiomed.2009.02.008. [DOI] [PubMed] [Google Scholar]
- 69.Turrens J.F. Mitochondrial formation of reactive oxygen species. J. Physiol. 2003;552:335–344. doi: 10.1113/jphysiol.2003.049478. [DOI] [PMC free article] [PubMed] [Google Scholar]
- 70.Turrens J.F., Alexandre A., Lehninger A.L. Ubisemiquinone is the electron donor for superoxide formation by complex III of heart mitochondria. Arch. Biochem. Biophys. 1985;237:408–414. doi: 10.1016/0003-9861(85)90293-0. [DOI] [PubMed] [Google Scholar]
- 71.Valko M., Leibfritz D., Moncol J., Cronin M.T., Mazur M., Telser J. Free radicals and antioxidants in normal physiological functions and human disease. Int. J. Biochem. Cell. Biol. 2007;39:44–84. doi: 10.1016/j.biocel.2006.07.001. [DOI] [PubMed] [Google Scholar]
- 72.Valsecchi F., Monge C., Forkink M., de Groof A.J., Benard G., Rossignol R., Swarts H.G., van Emst-de Vries S.E., Rodenburg R.J., Calvaruso M.A., Nijtmans L.G., Heeman B., Roestenberg P., Wieringa B., Smeitink J.A., Koopman W.J., Willems P.H. Metabolic consequences of NDUFS4 gene deletion in immortalized mouse embryonic fibroblasts. Biochim. Biophys. Acta. 2012;1817:1925–1936. doi: 10.1016/j.bbabio.2012.03.006. [DOI] [PubMed] [Google Scholar]
- 73.Valsecchi F., Grefte S., Roestenberg P., Joosten-Wagenaars J., Smeitink J.A., Willems P.H., Koopman W.J. Primary fibroblasts of NDUFS4(-/-) mice display increased ROS levels and aberrant mitochondrial morphology. Mitochondrion. 2013;13:436–443. doi: 10.1016/j.mito.2012.12.001. [DOI] [PubMed] [Google Scholar]
- 74.Veal E., Day A. Hydrogen peroxide as a signaling molecule. Antioxid. Redox Signal. 2011;15:147–151. doi: 10.1089/ars.2011.3968. [DOI] [PubMed] [Google Scholar]
- 75.Verkaart S., Koopman W.J., van Emst-de Vries S.E., Nijtmans L.G., van den Heuvel L.W., Smeitink J.A., Willems P.H. Superoxide production is inversely related to complex I activity in inherited complex I deficiency. Biochim. Biophys. Acta. 2007;1772:373–381. doi: 10.1016/j.bbadis.2006.12.009. [DOI] [PubMed] [Google Scholar]
- 76.Verkaart S., Koopman W.J., Cheek J., van Emst-de Vries S.E., van den Heuvel L.W., Smeitink J.A., Willems P.H. Mitochondrial and cytosolic thiol redox state are not detectably altered in isolated human NADH:ubiquinone oxidoreductase deficiency. Biochim. Biophys. Acta. 2007;1772:1041–1051. doi: 10.1016/j.bbadis.2007.05.004. [DOI] [PubMed] [Google Scholar]
- 77.Votyakova T.V., Reynolds I.J. DeltaPsi(m)-Dependent and -independent production of reactive oxygen species by rat brain mitochondria. J. Neurochem. 2001;79:266–277. doi: 10.1046/j.1471-4159.2001.00548.x. [DOI] [PubMed] [Google Scholar]
- 78.Wardman P. Fluorescent and luminescent probes for measurement of oxidative and nitrosative species in cells and tissues: progress, pitfalls, and prospects. Free. Radic. Biol. Med. 2007;43:995–1022. doi: 10.1016/j.freeradbiomed.2007.06.026. [DOI] [PubMed] [Google Scholar]
- 79.Willems P.H.G.M., Rossignol R., Dieteren C.E.J., Murphy M.P., Koopman W.J.H. Redox homeostasis and mitochondrial dynamics. Cell. Metab. 2015 doi: 10.1016/j.cmet.2015.06.006. [DOI] [PubMed] [Google Scholar]
- 80.Williams M.D., Van Remmen H., Conrad C.C., Huang T.T., Epstein C.J., Richardson A. Increased oxidative damage is correlated to altered mitochondrial function in heterozygous manganese superoxide dismutase knockout mice. J. Biol. Chem. 1998;273:28510–28515. doi: 10.1074/jbc.273.43.28510. [DOI] [PubMed] [Google Scholar]
- 81.Wehr N.B., Levine R.L. Quantification of protein carbonylation. Methods Mol. Biol. 2013;965:265–281. doi: 10.1007/978-1-62703-239-1_18. [DOI] [PubMed] [Google Scholar]
- 82.Wong C.M., Marcocci L., Liu L., Suzuki Y.J. Cell signalling by protein carbonylation and decarbonylation. Antioxid. Redox Signal. 2010;12:393–404. doi: 10.1089/ars.2009.2805. [DOI] [PMC free article] [PubMed] [Google Scholar]
- 83.Yan L.J., Forster M.J. Chemical probes for analysis of carbonylated proteins: a review. J. Chromatogr. B Anal. Technol. Biomed. Life Sci. 2010;879:386–394. doi: 10.1016/j.jchromb.2010.08.004. [DOI] [PMC free article] [PubMed] [Google Scholar]
- 84.Zhao H., Joseph J., Fales H.M., Sokoloski E.A., Levine R.L., Vasquez-Vivar J., Kalyanaraman B. Detection and characterization of the product of hydroethidine and intracellular superoxide by HPLC and limitations of fluorescence. Proc. Natl. Acad. Sci. USA. 2005;102:5727–5732. doi: 10.1073/pnas.0501719102. [DOI] [PMC free article] [PubMed] [Google Scholar]