

Abstract
Background
This work aimed to identify altered pathways in congenital heart defects (CHD) in Down syndrome (DS) by systematically tracking the dysregulated modules of reweighted protein-protein interaction (PPI) networks.
Material/Methods
We performed systematic identification and comparison of modules across normal and disease conditions by integrating PPI and gene-expression data. Based on Pearson correlation coefficient (PCC), normal and disease PPI networks were inferred and reweighted. Then, modules in the PPI network were explored by clique-merging algorithm; altered modules were identified via maximum weight bipartite matching and ranked in non-increasing order. Finally, pathways enrichment analysis of genes in altered modules was carried out based on Database for Annotation, Visualization, and Integrated Discovery (DAVID) to study the biological pathways in CHD in DS.
Results
Our analyses revealed that 348 altered modules were identified by comparing modules in normal and disease PPI networks. Pathway functional enrichment analysis of disrupted module genes showed that the 4 most significantly altered pathways were: ECM-receptor interaction, purine metabolism, focal adhesion, and dilated cardiomyopathy.
Conclusions
We successfully identified 4 altered pathways and we predicted that these pathways would be good indicators for CHD in DS.
MeSH Keywords: Afferent Pathways; Down Syndrome; Heart Defects, Congenital
Background
Down syndrome (DS), caused by a trisomy of chromosome 21(HSA21), is the most common genetic developmental disorder, with an incidence of 1 in 800 live births [1]. Some of its phenotypes (e.g., cognitive impairment) are consistently present in all DS individuals, while others show incomplete penetrance [2]. A short interval near the distal tip of chromosome 21 contributes to congenital heart defects (CHD), and indirect genetic evidence suggests that multiple candidate genes in this region may contribute to this phenotype [3,4]. The relatively higher infant mortality rate in the DS population has been largely attributed to their having a higher incidence of CHD [5].
Extensive efforts to gain a better understanding of the genetic basis of CHD in DS using rare cases of partial trisomy 21 have led to identification of genomic regions on chromosome 21 that, when triplicated, are consistently associated with CHD. A study of rare partial trisomy 21 cases suggested that the CHD candidate region on 21q22.3 was mapped to a larger telomeric genomic segment of 15.4 Mb between markers D21S3 and PFKL region [6]. Recent studies also suggest the contribution of VEGFA [7], ciliome and hedgehog [8], and folate [9] pathways to the pathogenicity of CHD in DS. Also, engineered duplication of a 5.43-Mb region of Mmu16 from Tiam1 to Kcnj6 in the mouse model, Dp(16)2Yey, was recently reported to cause CHD [10]. It was indicated that the genetic architecture of the CHD risk of DS was complex and included trisomy 21 [11]. The complete underlying genomic or gene expression variation that contributes to the presence of a CHD in DS is still unknown.
Protein complexes are key molecular entities that integrate multiple gene products to perform cellular functions [12]. For the past few years, high-throughput experimental technologies and large amounts of protein-protein interaction (PPI) data have made it possible to study proteins systematically [13]. A PPI network can be simulated for an undirected graph with proteins as nodes and protein interactions as undirected edges, so as to the prioritize disease-related genes or pathways and to understand the mechanism of disease [14]. However, protein interaction data produced by high-throughput experiments are often associated with high false-positive and false-negative rates, which makes it difficult to predict complexes accurately [15]. Many computational approaches have been proposed to assess the reliability of protein interaction data. An iterative scoring method proposed by Liu et al. [16] was used to assign weight to protein pairs, and the weight of a protein pair indicated the reliability of the interaction between the 2 proteins. A crucial distinguishing factor of disease genes was that they belonged to core mechanisms responsible for genome stability and cell proliferation (e.g., DNA damage repair and cell cycle) and functioned as highly synergetic or coordinated groups. Therefore, a systematic method is required to track gene and module behavior across specific conditions in a controlled manner (e.g., between normal and disease type) [17].
Furthermore, it is important to effectively integrate ‘multiomics’ data into such an analysis. Chu and Chen [18] combined PPI and gene expression data to construct a cancer-perturbed PPI network in cervical carcinoma to study gain- and loss-of-function genes as potential drug targets. Masica and Karchin [19] correlated somatic mutations and gene expression to identify novel genes in glioblastoma multiforma. Zhao et al. [14] proposed an iterative model to combine mutation and expression data and used it to identify mutated driver pathways in multiple cancer types. Magger et al. [20] combined PPI and gene expression data to construct tissue-specific PPI networks for 60 tissues and used them to prioritize disease genes. Zhang et al., [21] integrated DNA methylation, gene expression, and microRNA expression data in 385 ovarian cancer samples from TCGA, and performed ‘multi-dimensional’ analysis to identify disrupted pathways.
In the present study, in order to further reveal the mechanism of CHD in DS, we systematically tracked the disrupted modules of reweighted PPI networks to identify disturbed pathways between normal controls and CHD in DS patients. To achieve this, normal and disease PPI networks were inferred based on Pearson correlation coefficient (PCC); then, a clique-merging algorithm was formed to explore modules in the re-weighted PPI network, and these modules were compared with each other to identify altered modules. Finally, Kyoto Encyclopedia of Genes and Genomes (KEGG) pathways enrichment analysis of genes in disrupted modules was carried out based on Database for Annotation, Visualization, and Integrated Discovery (DAVID).
Material and Methods
Data recruitment and preprocessing
The gene expression profile of E-GEOD-1789 from ArrayExpress database (http://www.ebi.ac.uk/arrayexpress/) was selected for CHD in DS-related analysis. E-GEOD-1789 was existed in the Affymetrix GeneChip Human Genome U133A Platform, and the data were gained from cardiac tissue from fetuses at 18–22 weeks of gestation after therapeutic abortion, consisting of 10 samples from fetuses trisomic for Hsa21 and 5 from euploid control fetuses [22]. The microarray data and annotation files of healthy human beings and CHD in DS were downloaded for further analysis.
The Micro Array Suite 5.0 (MAS 5.0) algorithm was used to revise perfect match and mismatch values [23]. Robust multichip average (RMA) method [24] and quantile based algorithm [25] were carried out background correction and normalization to eliminate the influence of nonspecific hybridization. A gene-filter package was used to discard probes that did not match any genes. The expression value averaged over probes was used as the gene expression value if the gene had multiple probes. Finally, we gained 12 493 genes.
PPI network construction
The database Search Tool for the Retrieval of Interacting Genes/Proteins (STRING, http://string-db.org/) provides a comprehensive, yet quality-controlled, collection of protein–protein associations for a large number of organisms [26]. It integrates and ranks 3 types associations derived from: 1) high-throughput experimental data, 2) mining of databases and the literature, and 3) predictions based on genomic context analysis. Thus, the interactions in STRING provided an integrated scoring scheme with higher confidence.
The data, comprising 1 048 576 interactions with combine-scores, were obtained from STRING database to build the PPI network. After removing self-loops and proteins without expression value, a PPI network including 9273 nodes and 58 617 highly correlated interactions (with combine-score ≥0.75) was constructed. Taking the intersection of the 12493 genes in E-GEOD-1789 and the nodes of the PPI network, we established a sub-network with 7390 nodes and 45 286 interactions.
PPI network re-weighting
The weights of interactions reflect their reliabilities, and interactions with low scores are likely to be false-positives [16]. PCC is a measure of the correlation between 2 variables, whose values ranged from −1 to +1 [27]. In this experiment, PCC was calculated to evaluate how strongly 2 interacting proteins were co-expressed. The PCC of a pair of genes (a and b), which encoded the corresponding paired proteins (u and v) interacting in the PPI network, was defined as:
where n was the number of samples in the gene expression data; g (a, k) or g (b, k) was the expression level of gene a or b in the sample k under a specific condition; ḡ (a) or ḡ (b) represented the mean expression level of gene a or b; and ρ (a) or ρ (b) represented the standard deviation of expression level of gene a or b.
In this study, the PCC of a pair of proteins (u and v) was defined as equal to the PCC of their corresponding paired genes (a and b), that was PCC (u, v)=PCC(a, b). Furthermore, the PCC of each gene-gene interaction was defined as weight value of the interaction. The interactions with |PCC(a,b)1 − PCC(a,b)2|>1 under 2 conditions were regarded as a significant difference. Enrichment analysis was conducted on the nodes of the interactions.
Identifying modules from the PPI networks
The module-identification algorithm was based on clique-merging, similar to that proposed for identifying complexes from PPI networks [16]. The algorithm worked in 2 steps: firstly, all maximal cliques from the PPI networks of normal and disease were selected out, respectively; and secondly, the cliques were ranked according to their weighted density and merged or removed highly overlapped cliques. The score of a clique C was defined as its weighted density:
Where w (u, v) was the weight of the interaction between u and v calculated using fast depth-first method.
There might be thousands of maximal cliques in a PPI network and many of them overlapped with one another. To reduce the result size, the highly overlapped cliques should be removed. Merging highly overlapped cliques to form bigger, yet still dense, subgraphs was also desirable since complexes were not necessarily fully connected and PPI data might be incomplete. The inter-connectivity between 2 cliques was used to determine whether 2 overlapped cliques should be merged together. The weighted inter-connectivity between the non-overlapping proteins of C1 and C2 was calculated as follows:
Given a set of cliques ranked in descending order of their score, denoted as {C1, C2,..., Ck}, the clustering based on maximal cliques (CMC) algorithm removed and merged highly overlapped cliques as follows. For every clique Ci, if there existed a clique Cj such that Cj had a lower score than Ci and |Ci ∩ Cj |/|Cj | ≥ overlap-threshold (to), where overlap-threshold was a predefined threshold for overlapping. Then, we calculated the weighted inter-connecting score of different nodes in the 2 cliques. If such Cj existed, then the interconnectivity score between Ci and Cj was used to decide whether to remove Cj or merge Cj with Ci. If inter-score (Ci, Cj) ≥ merge-threshold (tm), then Cj was merged with Ci to form a module; otherwise, Cj was removed. In this study, the overlap-threshold was set to 0.5 and merge-threshold was set to 0.25.
Identification of disrupted modules
Let S={S1, S2,…, Sn} and T={T1, T2, …, Tm} be the sets of modules identified from the networks normal and disease, respectively. For each Si ∈ S, the module correlation density was calculated as follows:
The correlation densities for disease modules T were calculated similarly.
We built a similarity graph M=(VM, EM), where VM={S ∪ T}, and EM=∪{(Si, Tj): J(Si, Tj) ≥ tJ, ΔCC(Si, Tj) ≥ δ}, whereby J(Si, Tj)=|Si, Tj|/|Si ∪ Tj| was the Jaccard similarity and ΔCC(Si, Tj) = |dcc(Si) − dcc(Tj)| was the differential correlation density between Si and Tj [28]. Next, the disrupted module pairs T(Si, Tj) were identified by finding the maximum weight matching in M, and we ranked them in descending order according to their differential density ΔCC. The module pairs (disrupted module pairs) of whose tJ ≥2/3 and ΔCC ≥0.05 were considered to be distinct modules.
Pathway enrichment analysis of genes in altered modules
KEGG is an effort to link genomic information with higher-order functional information by computerizing current knowledge on cellular processes and by standardizing gene annotations [29]. In this study, the DAVID for KEGG pathway enrichment analysis was carried out to further investigate the biological functions of genes in altered modules from normal controls and CHD in DS patients [30]. The threshold values of P-value <0.001 and gene count >5 were used in this study.
Results
Disruptions in CHD in DS PPI network
A total of 12 493 genes of normal and CHD in DS were obtained after data preprocessing, then intersections between these genes and STRING PPI network were investigated, and re-weighted PPI networks of normal and disease were identified. It was clear that the numbers of interactions, as well as average scores (weights), were roughly equal in normal and disease PPI networks, both of them with 45 286 interactions and with average score of 0.776. Figure 1 showed significant differences in the PCC distribution of the 2 networks. When the interaction correlation arranged −1.0~−0.8, −0.5~0.5 and 0.9~1.0, the number of interactions in normal was higher than that in CHD; however, in other conditions the number of interactions in normal was lower. Examining these interactions more carefully, we found that scores of 23 951 interactions in the disease network were lower than in the normal network, but 21 335 interactions were higher than these of normal. We extracted those with score changes >1.0 in 2 conditions, which included 886 interactions.
Figure 1.
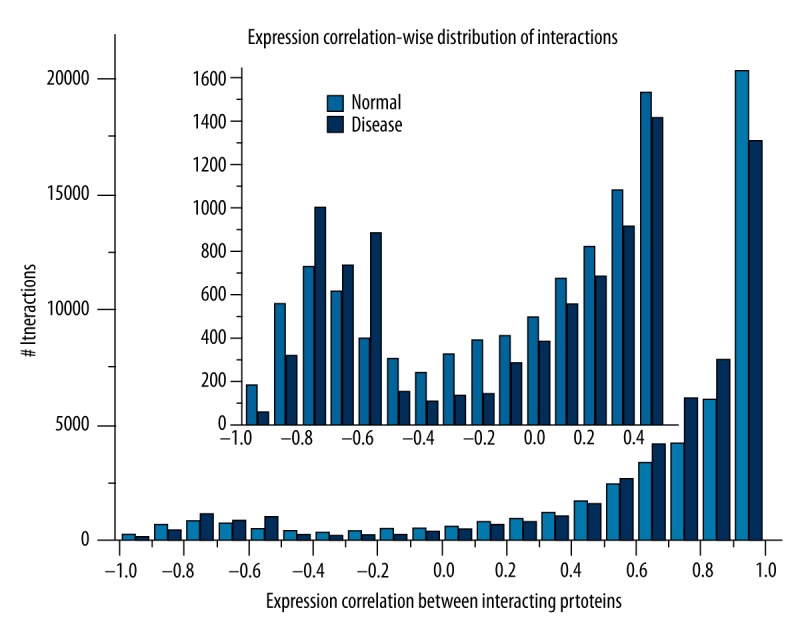
The expression correlational distribution of interactions in normal and disease conditions.
Based on DAVID, KEGG pathway enrichment analysis of genes involved in these 886 interactions was performed. When the threshold of P-value <0.001 was used, they mainly were enriched in 14 biological process terms. The pathways of oxidative phosphorylation (P=1.09E-14), Alzheimer’s disease (P=8.94E-12), Huntington’s disease (P=3.85E-11), Parkinson’s disease (P=5.34E-11), and focal adhesion (P=3.02E-10) showed the most significant enrichment.
Disruptions in CHD in DS modules
We used a clique-merging algorithm to identify disrupted or altered modules from normal and disease PPI networks. With the threshold of nodes >5, a total of 8102 maximal cliques were identified for module analysis. As we performed comparative analysis on normal and disease modules to understand disruptions of the module level (Table 1), we found that the total number of modules was the same under the 2 conditions, which both contained 674 modules. The average module sizes and module correlation density across the 2 conditions were roughly the same. Figure 2 shows the relationship between numbers of modules and weighted density of modules. It was obvious that there was no significant difference between the distribution of modules in normal and disease groups.
Table 1.
Properties of normal and disease modules.
| Module set | No. of modules | Average module size | Correlation | ||
|---|---|---|---|---|---|
| Max | Avg | Min | |||
| Normal | 674 | 49.53 | 0.84 | 0.31 | −0.11 |
| Disease | 674 | 49.54 | 0.92 | 0.31 | −0.13 |
Figure 2.

The correlational distribution of modules in normal and disease conditions.
Next, when the threshold was tJ=2/3 and ΔCC=0.05, we obtained 348 disrupted module pairs. In comparison of the module correlation density of the module pairs, we found that there were 188 modules showing higher correlation in normal than in disease groups, and 160 modules showing lower correlation in normal than in disease groups. There were 1227 genes contained in these disrupted module pairs.
There was a close correlation between the character of modules and combine-scores of the nodes. The intersection of the interactions contained in the disrupted modules with nodes whose difference values were significantly changed (>1) was selected out. Pathway analysis based on these genes was conducted. These genes were enriched in 33 terms (P<0.001), of which focal adhesion (P=1.10E-12), cell cycle (P=2.02E-09), pathways in cancer (P=1.16E-08), small cell lung cancer (P=3.91E-08), and renal cell carcinoma (P=8.77E-08) were the 5 most significant disrupted pathways.
In-depth analyses of disrupted modules
To further clarify the specific differences between disrupted modules, gene compositions of the modules were analyzed and compared. Statistical analysis was conducted on these genes that appeared in the difference modules. There were 1227 genes contained in the 348 disrupted module pairs. It was not difficult to find that in disease modules, there were 315 genes missed and 267 genes added compared with normal modules; a total of 137 genes were the intersection of the missed and added genes. Pathway analysis based on these genes was conducted separately. As missed genes, they mainly enriched in 22 terms (P<0.001), in which ECM-receptor interaction (P=3.27E-27), focal adhesion (P=3.86E-24), purine metabolism (P=3.98E-15), cell cycle (P=1.58E-14), oocyte meiosis (P=5.21E-11), and dilated cardiomyopathy (P=2.79E-10) were the most significant pathways. Added genes were mainly enriched in 16 terms (P<0.001), in which focal adhesion (P=1.06E-18), ECM-receptor interaction (P=5.30E-18), and purine metabolism (P=2.85E-08) were the most significant pathways. For the intersection of the missed and added genes, they mainly enriched in 14 terms (P<0.001), in which ECM-receptor interaction (P=1.10E-21), focal adhesion (P=2.38E-19), dilated cardiomyopathy (P=4.62E-11), and purine metabolism (P=2.68E-10) were the most significant pathways. In comprehensive analyses conducted on the results of the 3 KEGG pathway analyses, we found that ECM-receptor interaction, purine metabolism, focal adhesion, and dilated cardiomyopathy were the most significant pathways. A Venn diagram of 3 sets of pathway terms showed there were 10 common terms in the 3 conditions (Figure 3). Details of these 10 significant pathways are shown in Table 2.
Figure 3.
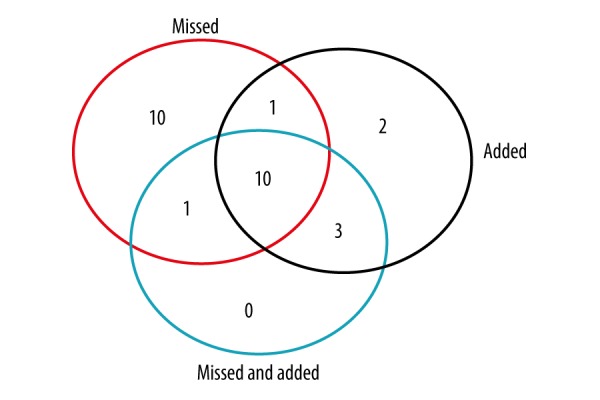
Venn diagram of 3 sets of pathway terms of “Missed genes”, “Added genes”, and “The intersection of the missed and added genes”.
Table 2.
The common KEGG pathways in the three conditions in disrupted modules.
| ID | Term | P-value | ||
|---|---|---|---|---|
| Missed | Added | Missed and added | ||
| hsa04512 | ECM-receptor interaction | 3.27E-27 | 5.30E-18 | 1.10E-21 |
| hsa04510 | Focal adhesion | 3.86E-24 | 1.06E-18 | 2.38E-19 |
| hsa05414 | Dilated cardiomyopathy | 2.79E-10 | 1.72E-07 | 4.62E-11 |
| hsa00230 | Purine metabolism | 3.98E-15 | 2.85E-08 | 2.68E-10 |
| hsa05412 | Arrhythmogenic right ventricular cardiomyopathy (ARVC) | 9.37E-08 | 3.15E-06 | 4.54E-08 |
| hsa05222 | Small cell lung cancer | 7.86E-08 | 2.97E-07 | 1.43E-07 |
| hsa05410 | Hypertrophic cardiomyopathy (HCM) | 2.68E-06 | 2.57E-04 | 1.36E-06 |
| hsa05200 | Pathways in cancer | 7.88E-06 | 2.12E-05 | 4.76E-05 |
| hsa04114 | Oocyte meiosis | 5.21E-11 | 1.81E-04 | 9.77E-05 |
| hsa04810 | Regulation of actin cytoskeleton | 3.10E-04 | 8.85E-04 | 5.61E-04 |
Furthermore, we performed analysis on the missed and added frequency of these genes in disrupted disease modules (Table 3). We found that the missed and added frequency of several genes was more than 20 in both missed and added conditions, including NEM5, NEM7, POLR2C, GUCY1B3, NPR2, GUCY1A2, CTPS2, NPR1, CTPS1, NEM6, and POLR2D. Pathway analysis showed that NEM5, NEM7, POLR2C, GUCY1B3, NPR2, GUCY1A2, NPR1, and POLR2D were all enriched in pathway of purine metabolism. The most frequent gene that appeared in the added disease modules was ADCY8, was enriched in the pathway of dilated cardiomyopathy.
Table 3.
The frequency of genes appeared in the intersection of the missed and added genes.
| Gene | Missed | Added | Gene | Missed | Added |
|---|---|---|---|---|---|
| ADCY8 | 7 | 46 | NME6 | 23 | 25 |
| NME5 | 25 | 29 | ADCY6 | 10 | 21 |
| NME7 | 25 | 28 | ADCY1 | 11 | 20 |
| ADCY2 | 16 | 26 | POLR2D | 21 | 20 |
| ADCY9 | 7 | 25 | ITGA6 | 6 | 19 |
| POLR2C | 23 | 25 | ITGA10 | 9 | 18 |
| GUCY1B3 | 23 | 25 | ITGA4 | 5 | 18 |
| NPR2 | 23 | 25 | ITGB4 | 7 | 16 |
| GUCY1A2 | 23 | 25 | LAMA1 | 8 | 15 |
| CTPS2 | 23 | 25 | ITGB7 | 5 | 12 |
| ADCY10 | 9 | 25 | GUCY1A3 | 23 | 11 |
| NPR1 | 23 | 25 | NME1 | 12 | 10 |
| CTPS1 | 23 | 25 | ENTPD2 | 31 | 5 |
Discussion
In the present study, by integrating PPI and gene-expression data, we performed a systematic identification and comparison of modules across normal and disease conditions, and identified 348 altered modules. There were 1227 genes contained in the 348 disrupted module pairs. It was not difficult to find that in disease modules, 315 genes were missed and 267 genes were added compared with normal modules and the intersection of the missed and added were 137 genes. In pathway analysis conducted based on these genes separately, we found that ECM-receptor interaction, purine metabolism, focal adhesion, and dilated cardiomyopathy were the most significant pathways.
In cell biology, focal adhesions are large macromolecular assemblies through which mechanical force and regulatory signals are transmitted between the extracellular matrix (ECM) and an interacting cell. More precisely, focal adhesions are the sub-cellular structures that mediate the regulatory effects (i.e., signaling events) of a cell in response to ECM adhesion [31]. The cytoplasmic side of focal adhesions consists of large molecular complexes that link transmembrane receptors, such as integrins, to the actin cytoskeleton and mediate signals modulating cell attachment, migration, proliferation, differentiation, and gene expression [32]. At the molecular level, focal adhesions are formed around a transmembrane core of an α−β integrin heterodimer, which binds to a component of the extracellular matrix (ECM) on its extracellular region, constitutes the site of anchorage of the actin cytoskeletons to the cytoplasmic side of the membrane, and mediates various intracellular signaling pathways [33]. It had been proposed that DSCAM has a contributory role of CHD in DS [4]. Gene function enrichment analysis indicated that DSCAM was enriched in ECM-Receptor interaction and focal adhesion [34].
Purines are a class of small organic molecules that are essential for all cells. They play critical roles in neuronal differentiation and function [35]. Their importance is highlighted by several inherited disorders of purine metabolism. Purine metabolism refers to the metabolic pathways that synthesize and break down purines, that are present in many organisms [40]. Interestingly, individuals with DS have elevated purine levels in bodily fluids, hypothesized to be due to trisomy of GART and resultant increased synthesis of purines [37]. Uric acid, hypoxanthine, and xanthine are the main purine metabolism products. It was reported that the levels of hypoxanthine and xanthine in DS children were significantly lower than in healthy children, which increased conversion of hypoxanthine and xanthine to uric acid with subsequent free radical-dependent oxidation of uric acid to allantoin, and potentiated the mechanisms by the oxidative stress in DS [38].
As we performed analysis on the frequency of genes appearing in the intersection of the missed and added genes, we found that the higher frequency of genes mainly enriched in the pathway of purine metabolism, and the most frequent gene that appeared in the added disease modules was ADCY8, which is enriched in the pathway of dilated cardiomyopathy. Cardiomyopathy comprises a diverse group of heart-muscle disorders, which are further subdivided on the basis of their anatomic and hemodynamic findings. More than 80% of cardiomyopathies are classified as dilated or congestive [39]. It was reported that gene MCIP1, a direct association with the catalytic domain of calcineurin, was encoded by DSCR [40], which resides within the “DS critical region” of human chromosome 21 [41]. Forced expression of a constitutively active form of calcineurin in hearts of transgenic mice promotes cardiac hypertrophy that progresses to dilated cardiomyopathy, heart failure, and death, in a manner that recapitulates features of human disease [42].
In recent years, a wide variety of methods to reverse-engineer transcriptional regulatory networks from microarray data have been developed [43]. Module-based methods, such as Weighted Correlation Network Analysis [44], the Context Likelihood of Relatedness algorithm [45] and the Learning Module Networks algorithm [46], assume a modular structure of the transcriptional regulatory network, with genes subject to the same regulatory input being organized in co-expression modules. However, none of the methods mentioned above can systematically track the disrupted modules. Several drawbacks of our work must be taken into account. For example, the sample size was not large enough to affect the conclusions to some degree. Also, the results obtained by bioinformatics method were not verified via experiments. Although disadvantages exist, we believe that this method and the predicted significant pathways offer investigators valuable resources for not only better understanding the mechanisms of CHD in DS, but also detecting the novel underlying pathway biomarkers as well as drug targets for CHD in DS therapy.
Conclusions
Our analyses revealed that 348 altered modules were identified by comparing modules in normal and disease PPI network. Based on pathway functional enrichment analysis of disrupted module genes, we successfully identified the 4 most significantly altered pathways: ECM-receptor interaction, purine metabolism, focal adhesion, and dilated cardiomyopathy. Therefore, we predicted that these pathways might be good indicators for CHD in DS.
Acknowledgments
We thank members of the research group of Jining No. 1 People’s Hospital. This research was supported by the fund of “The relationship between pediatric headache, abnormal EEG and Nasosinusitis and clinical research of Chinese and Western medicine treatment”, China [K2009-3-53(3)-2]. We are grateful to Ji’nan Evidence-Based Medicine Science-Technology Center for technical support in data processing and analysis.
Footnotes
Source of support: This research was supported by the fund of “The relationship between pediatric headache, abnormal EEG and Nasosinusitis and clinical research of Chinese and Western medicine treatment”, China [K2009-3-53(3)-2
Competing interests
We declare that we have no conflict of interest.
References
- 1.Hibaoui Y, Grad I, Letourneau A, et al. Modelling and rescuing neurodevelopmental defect of Down syndrome using induced pluripotent stem cells from monozygotic twins discordant for trisomy 21. EMBO Mol Med. 2014;6:259–77. doi: 10.1002/emmm.201302848. [DOI] [PMC free article] [PubMed] [Google Scholar]
- 2.Antonarakis SE, Epstein CJ. The challenge of Down syndrome. Trends Mol Med. 2006;12:473–79. doi: 10.1016/j.molmed.2006.08.005. [DOI] [PubMed] [Google Scholar]
- 3.Li Z, Yu T, Morishima M, et al. Duplication of the entire 22.9 Mb human chromosome 21 syntenic region on mouse chromosome 16 causes cardiovascular and gastrointestinal abnormalities. Hum Mol Genet. 2007;16:1359–66. doi: 10.1093/hmg/ddm086. [DOI] [PubMed] [Google Scholar]
- 4.Korbel JO, Tirosh-Wagner T, Urban AE, et al. The genetic architecture of Down syndrome phenotypes revealed by high-resolution analysis of human segmental trisomies. Proc Natl Acad Sci USA. 2009;106:12031–36. doi: 10.1073/pnas.0813248106. [DOI] [PMC free article] [PubMed] [Google Scholar]
- 5.Weijerman ME, van Furth AM, Vonk Noordegraaf A, et al. Prevalence, neonatal characteristics, and first-year mortality of Down syndrome: a national study. J Pediatr. 2008;152:15–19. doi: 10.1016/j.jpeds.2007.09.045. [DOI] [PubMed] [Google Scholar]
- 6.Lyle R, Béna F, Gagos S, et al. Genotype-phenotype correlations in Down syndrome identified by array CGH in 30 cases of partial trisomy and partial monosomy chromosome 21. Eur J Hum Genet. 2009;17:454–66. doi: 10.1038/ejhg.2008.214. [DOI] [PMC free article] [PubMed] [Google Scholar]
- 7.Ackerman C, Locke AE, Feingold E, et al. An excess of deleterious variants in VEGF-A pathway genes in Down-syndrome-associated atrioventricular septal defects. Am J Hum Genet. 2012;91:646–59. doi: 10.1016/j.ajhg.2012.08.017. [DOI] [PMC free article] [PubMed] [Google Scholar]
- 8.Ripoll C, Rivals I, Ait Yahya-Graison E, et al. Molecular signatures of cardiac defects in Down syndrome lymphoblastoid cell lines suggest altered ciliome and Hedgehog pathways. PloS One. 2012;7:e41616. doi: 10.1371/journal.pone.0041616. [DOI] [PMC free article] [PubMed] [Google Scholar]
- 9.Locke AE, Dooley KJ, Tinker SW, et al. Variation in folate pathway genes contributes to risk of congenital heart defects among individuals with Down syndrome. Genet Epidemiol. 2010;34:613–23. doi: 10.1002/gepi.20518. [DOI] [PMC free article] [PubMed] [Google Scholar]
- 10.Liu C, Morishima M, Yu T, et al. Genetic analysis of Down syndrome-associated heart defects in mice. Hum Genet. 2011;130:623–32. doi: 10.1007/s00439-011-0980-2. [DOI] [PMC free article] [PubMed] [Google Scholar]
- 11.Sailani MR, Makrythanasis P, Valsesia A, et al. The complex SNP and CNV genetic architecture of the increased risk of congenital heart defects in Down syndrome. Genome Res. 2013;23:1410–21. doi: 10.1101/gr.147991.112. [DOI] [PMC free article] [PubMed] [Google Scholar]
- 12.Gavin AC, Aloy P, Grandi P, et al. Proteome survey reveals modularity of the yeast cell machinery. Nature. 2006;440:631–36. doi: 10.1038/nature04532. [DOI] [PubMed] [Google Scholar]
- 13.Jordán F, Nguyen TP, Liu WC. Studying protein – protein interaction networks: a systems view on diseases. Briefings Funct Genomics. 2012;11:497–504. doi: 10.1093/bfgp/els035. [DOI] [PubMed] [Google Scholar]
- 14.Zhao J, Zhang S, Wu LY, Zhang XS. Efficient methods for identifying mutated driver pathways in cancer. Bioinformatics. 2012;28:2940–47. doi: 10.1093/bioinformatics/bts564. [DOI] [PubMed] [Google Scholar]
- 15.Wu C, Zhu J, Zhang X. Integrating gene expression and protein-protein interaction network to prioritize cancer-associated genes. BMC Bioinformatics. 2012;13:182. doi: 10.1186/1471-2105-13-182. [DOI] [PMC free article] [PubMed] [Google Scholar]
- 16.Liu G, Wong L, Chua HN. Complex discovery from weighted PPI networks. Bioinformatics. 2009;25:1891–97. doi: 10.1093/bioinformatics/btp311. [DOI] [PubMed] [Google Scholar]
- 17.Srihari S, Ragan MA. Systematic tracking of dysregulated modules identifies novel genes in cancer. Bioinformatics. 2013;29:1553–61. doi: 10.1093/bioinformatics/btt191. [DOI] [PubMed] [Google Scholar]
- 18.Chu LH, Chen BS. Construction of a cancer-perturbed protein-protein interaction network for discovery of apoptosis drug targets. BMC Syst Biol. 2008;2:56. doi: 10.1186/1752-0509-2-56. [DOI] [PMC free article] [PubMed] [Google Scholar]
- 19.Masica DL, Karchin R. Correlation of somatic mutation and expression identifies genes important in human glioblastoma progression and survival. Cancer Res. 2011;71:4550–61. doi: 10.1158/0008-5472.CAN-11-0180. [DOI] [PMC free article] [PubMed] [Google Scholar]
- 20.Magger O, Waldman YY, Ruppin E, Sharan R. Enhancing the prioritization of disease-causing genes through tissue specific protein interaction networks. PLoS Comput Biol. 2012;8:e1002690. doi: 10.1371/journal.pcbi.1002690. [DOI] [PMC free article] [PubMed] [Google Scholar]
- 21.Zhang J, Lu K, Xiang Y, et al. Weighted frequent gene co-expression network mining to identify genes involved in genome stability. PLoS Comput Biol. 2012;8:e1002656. doi: 10.1371/journal.pcbi.1002656. [DOI] [PMC free article] [PubMed] [Google Scholar]
- 22.Conti A, Fabbrini F, D’Agostino P, et al. Altered expression of mitochondrial and extracellular matrix genes in the heart of human fetuses with chromosome 21 trisomy. Bmc Genomics. 2007;8:268. doi: 10.1186/1471-2164-8-268. [DOI] [PMC free article] [PubMed] [Google Scholar]
- 23.Pepper SD, Saunders EK, Edwards LE, et al. The utility of MAS5 expression summary and detection call algorithms. BMC Bioinformatics. 2007;8:273. doi: 10.1186/1471-2105-8-273. [DOI] [PMC free article] [PubMed] [Google Scholar]
- 24.Ma L, Robinson LN, Towle HC. ChREBP*Mlx is the principal mediator of glucose-induced gene expression in the liver. J Biol Chem. 2006;281:28721–30. doi: 10.1074/jbc.M601576200. [DOI] [PubMed] [Google Scholar]
- 25.Rifai N, Ridker PM. Proposed cardiovascular risk assessment algorithm using high-sensitivity C-reactive protein and lipid screening. Clin Chem. 2001;47:28–30. [PubMed] [Google Scholar]
- 26.von Mering C, Jensen LJ, Snel B, et al. STRING: known and predicted protein – protein associations, integrated and transferred across organisms. Nucleic Acids Res. 2005;33:D433–37. doi: 10.1093/nar/gki005. [DOI] [PMC free article] [PubMed] [Google Scholar]
- 27.Li M, Zhang H, Wang JX, Pan Y. A new essential protein discovery method based on the integration of protein-protein interaction and gene expression data. BMC Syst Biol. 2012;6:15. doi: 10.1186/1752-0509-6-15. [DOI] [PMC free article] [PubMed] [Google Scholar]
- 28.Srihari S, Ragan MA. Systematic tracking of dysregulated modules identifies novel genes in cancer. Bioinformatics. 2013;29:1553–61. doi: 10.1093/bioinformatics/btt191. [DOI] [PubMed] [Google Scholar]
- 29.Kanehisa M, Goto S. KEGG: kyoto encyclopedia of genes and genomes. Nucleic Acid Res. 2000;28:27–30. doi: 10.1093/nar/28.1.27. [DOI] [PMC free article] [PubMed] [Google Scholar]
- 30.Huang da W, Sherman BT, Lempicki RA. Systematic and integrative analysis of large gene lists using DAVID bioinformatics resources. Nat Protoc. 2008;4:44–57. doi: 10.1038/nprot.2008.211. [DOI] [PubMed] [Google Scholar]
- 31.Chen CS, Alonso JL, Ostuni E, et al. Cell shape provides global control of focal adhesion assembly. Biochem Biophys Res Commun. 2003;307:355–61. doi: 10.1016/s0006-291x(03)01165-3. [DOI] [PubMed] [Google Scholar]
- 32.Lo SH. Focal adhesions: what’s new inside. Dev Biol. 2006;294:280–91. doi: 10.1016/j.ydbio.2006.03.029. [DOI] [PubMed] [Google Scholar]
- 33.Hynes RO. Integrins: bidirectional, allosteric signaling machines. Cell. 2002;110:673–87. doi: 10.1016/s0092-8674(02)00971-6. [DOI] [PubMed] [Google Scholar]
- 34.Grossman TR, Gamliel A, Wessells RJ, et al. Over-expression of DSCAM and COL6A2 cooperatively generates congenital heart defects. PLoS Genet. 2011;7:e1002344. doi: 10.1371/journal.pgen.1002344. [DOI] [PMC free article] [PubMed] [Google Scholar]
- 35.Peronato G. Purine metabolism and hyperuricemic states. ‘The point of view of the rheumatologist’. Contrib Nephrol. 2005;147:1–21. doi: 10.1159/000082538. [DOI] [PubMed] [Google Scholar]
- 36.Göttle M, Burhenne H, Sutcliffe D, Jinnah HA. Purine metabolism during neuronal differentiation: the relevance of purine synthesis and recycling. J Neurochem. 2013;127:805–18. doi: 10.1111/jnc.12366. [DOI] [PMC free article] [PubMed] [Google Scholar]
- 37.Brodsky G, Barnes T, Bleskan J, et al. The human GARS-AIRS-GART gene encodes two proteins which are differentially expressed during human brain development and temporally overexpressed in cerebellum of individuals with Down syndrome. Hum Mol Genet. 1997;6:2043–50. doi: 10.1093/hmg/6.12.2043. [DOI] [PubMed] [Google Scholar]
- 38.Zitnanová I, Korytár P, Aruoma OI, et al. Uric acid and allantoin levels in Down syndrome: antioxidant and oxidative stress mechanisms? Clin Chim Acta. 2004;341:139–46. doi: 10.1016/j.cccn.2003.11.020. [DOI] [PubMed] [Google Scholar]
- 39.Seidman JG, Seidman C. The genetic basis for cardiomyopathy: from mutation identification to mechanistic paradigms. Cell. 2001;104:557–67. doi: 10.1016/s0092-8674(01)00242-2. [DOI] [PubMed] [Google Scholar]
- 40.Rothermel B, Vega RB, Yang J, et al. A protein encoded within the Down syndrome critical region is enriched in striated muscles and inhibits calcineurin signaling. J Biol Chem. 2000;275:8719–25. doi: 10.1074/jbc.275.12.8719. [DOI] [PubMed] [Google Scholar]
- 41.Fuentes JJ, Pritchard MA, Estivill X. Genomic organization, alternative splicing, and expression patterns of the DSCR1 (Down syndrome candidate region 1) gene. Genomics. 1997;44:358–61. doi: 10.1006/geno.1997.4866. [DOI] [PubMed] [Google Scholar]
- 42.Mende U, Kagen A, Cohen A. Transient cardiac expression of constitutively active Galphaq leads to hypertrophy and dilated cardiomyopathy by calcineurin-dependent and independent pathways. Proc Natl Acad Sci USA. 1998;95:13893–98. doi: 10.1073/pnas.95.23.13893. [DOI] [PMC free article] [PubMed] [Google Scholar]
- 43.Michoel T, De Smet R, Joshi A, et al. Comparative analysis of module-based versus direct methods for reverse-engineering transcriptional regulatory networks. BMC Syst Biol. 2009;3:49. doi: 10.1186/1752-0509-3-49. [DOI] [PMC free article] [PubMed] [Google Scholar]
- 44.Langfelder P, Horvath S. WGCNA: an R package for weighted correlation network analysis. BMC Bioinformatics. 2008;9:559. doi: 10.1186/1471-2105-9-559. [DOI] [PMC free article] [PubMed] [Google Scholar]
- 45.Faith JJ, Hayete B, Thaden JT, et al. Large-scale mapping and validation of Escherichia coli transcriptional regulation from a compendium of expression profiles. PLoS Biol. 2007;5:e8. doi: 10.1371/journal.pbio.0050008. [DOI] [PMC free article] [PubMed] [Google Scholar]
- 46.Joshi A, De Smet R, Marchal K, et al. Module networks revisited: computational assessment and prioritization of model predictions. Bioinformatics. 2009;25:490–96. doi: 10.1093/bioinformatics/btn658. [DOI] [PubMed] [Google Scholar]