

Abstract
We demonstrate a computational network model that integrates 18 in vitro, high-throughput screening assays measuring estrogen receptor (ER) binding, dimerization, chromatin binding, transcriptional activation, and ER-dependent cell proliferation. The network model uses activity patterns across the in vitro assays to predict whether a chemical is an ER agonist or antagonist, or is otherwise influencing the assays through a manner dependent on the physics and chemistry of the technology platform (“assay interference”). The method is applied to a library of 1812 commercial and environmental chemicals, including 45 ER positive and negative reference chemicals. Among the reference chemicals, the network model correctly identified the agonists and antagonists with the exception of very weak compounds whose activity was outside the concentration range tested. The model agonist score also correlated with the expected potency class of the active reference chemicals. Of the 1812 chemicals evaluated, 111 (6.1%) were predicted to be strongly ER active in agonist or antagonist mode. This dataset and model were also used to begin a systematic investigation of assay interference. The most prominent cause of false-positive activity (activity in an assay that is likely not due to interaction of the chemical with ER) is cytotoxicity. The model provides the ability to prioritize a large set of important environmental chemicals with human exposure potential for additional in vivo endocrine testing. Finally, this model is generalizable to any molecular pathway for which there are multiple upstream and downstream assays available.
Keywords: estrogen receptor, EDSP, high-throughput screening, In vitro, prioritization, biological modeling
Signaling pathways and networks are key components of complex biological systems. Endocrine signaling commences when hormones interact with their cognate receptors and initiate postreceptor functional responses. These important biological processes can be perturbed when xenobiotics either mimic the action of the natural ligands or block the action of those ligands through antagonist action. These perturbations may be purposely efficacious (eg, pharmaceuticals dosed within their therapeutic window) or deleterious (eg, environmental toxicants or off-target high-dose interactions for pharmaceuticals).
In order to measure the effect of xenobiotics on signaling pathways and networks, a variety of in vitro assays have been widely used in drug development and toxicity testing programs. These range from biochemical assays using purified protein to more complex cellular assays that can respond to chemical perturbations in various ways. Each of these assays is subject to false positive and false negative results, some of which are the result of “assay interference.” Conceptually, assay interference (Auld et al., 2008; Baell and Holloway, 2010; Bruns and Watson, 2012; Thorne et al., 2010) is a phenomenon whereby assays designed to measure binding to a protein or perturbation of a given pathway may produce false signals when the target protein itself, or other pathways in the system, are altered non-specifically. The standard approach to deal with assay interference issues is to deploy “orthogonal” assays (Miller et al., 2010; Thorne et al., 2010) that help distinguish activity towards the intended target or pathway from non-specific activities. In addition to assay interference issues, every assay has inherent limitations such as dynamic range or levels of background noise. Using a suite of assays to detect pathway perturbations may minimize potential non-specific effects or limitations of any single assay.
In this study, we evaluated ER pathway activity and assay interference using data from a collection of 18 in vitro assays that probe the estrogen receptor (ER) pathway in mammalian systems. These 18 in vitro assays are a subset of a larger collection of assays (821 individual assay endpoints) used in the EPA ToxCast program (Dix et al., 2007; Judson et al., 2010; Kavlock et al., 2012). The 18 assays include biochemical and cell-based in vitro assays that probe perturbations of ER pathway responses at sites within the cell: receptor binding, receptor dimerization, chromatin binding of the mature transcription factor, gene transcription, and changes in ER-induced cell growth kinetics (Fig. 1). The battery of 18 in vitro assays was used to screen a library of 1812 chemicals. Included in the chemical library were reference chemicals, ie, known ER agonists and antagonists, as well as a large number of commercial chemicals with reported estrogen-like activity, some of which are potentially selective estrogen receptor modulators (SERMs) (Dutertre and Smith, 2000; Diel et al., 2001; Katzenellenbogen et al., 2000a,b; Katzenellenbogen and Katzenellenbogen, 2000).
FIG. 1.
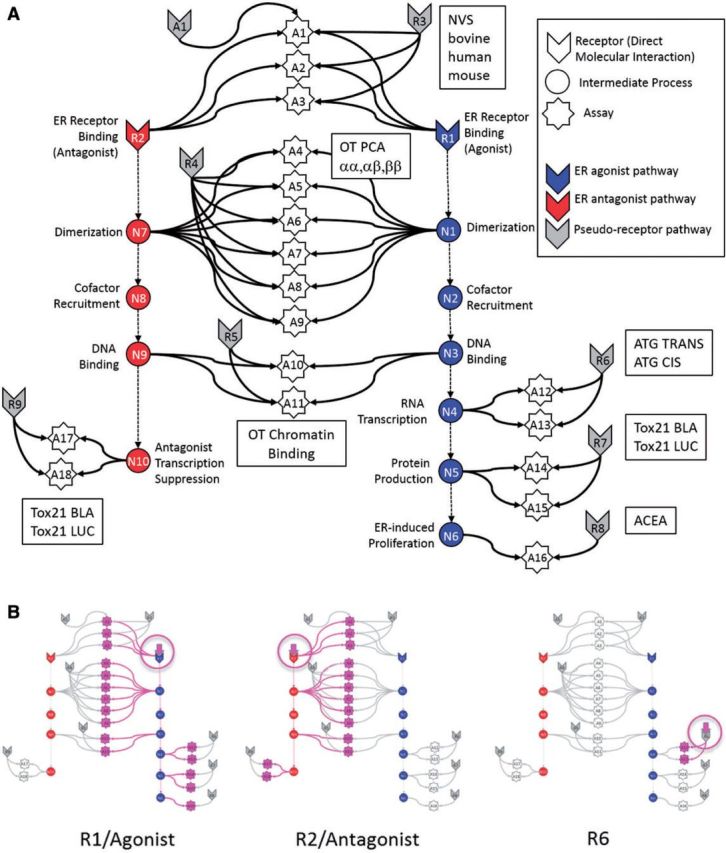
(A) Graphical representation of the computational network used in the in vitro analysis of the ER pathway across assays and technology platforms. Colored arrow nodes represent “receptors” with which a chemical can directly interact. Colored circles represent intermediate biological processes that are not directly observable. White stars represent the in vitro assays that measure activity at the biological nodes. Arrows represent transfer of information. Gray arrow nodes are the pseudoreceptors. Each in vitro assay (with the exception of A16) has an assay-specific pseudoreceptor, but only a single example is explicitly shown, for assay A1. (B) Patterns of assays that would be activated when specific receptors are activated by the chemical, in particular R1, R2 and R6. The activating chemical in its receptor are circled in pink, and the activated assays and the pathways to them are also highlighted in pink.
The goal of this article is to test the following hypothesis about the ER pathway and interference in the assays used to probe it. We expect that there will be sets of chemicals that are true ER agonists or antagonists, but that there will also be chemicals exhibiting a variety of types of assay interference (Hsieh et al., 2015; Inglese et al., 2007; Thorne et al., 2010). We hypothesize that assay interference will largely be technology-specific. For instance, a chemical could cause protein denaturation, which could give rise to a false positive signal in cell-free, radioligand competitive-binding assays. Such a chemical would show activity in all assays of that technology, but not the cell-based assays. Another example would be fluorescent compounds, which would show false activity in all fluorescence-based assays. Therefore, given a very diverse set of chemicals and the diversity of cell types and technologies included in the battery of 18 in vitro assays, one could expect to see many patterns of activity (ie, vectors of activities for a chemical across 18 assays). To navigate this complexity, we developed a mathematical/statistical model to infer whether chemicals that activate specific patterns of the in vitro assays were more likely to be ER agonists, ER antagonists, or were more likely to be causing assay activity through specific types of assay interference. Previous modeling approaches have been developed using a subset of the data presented here (Reif et al. 2010; Rotroff et al., 2014), but the current approach provides a more generic model framework applicable to other signaling pathways beyond ER. Supplementary Appendix 4 provides an overview of the differences between the Rotroff et al. model and the current one, and provides a quantitative comparison of the results.
Understanding the results of this analysis will have 3 broad implications. First, the commercial chemicals identified as ER-pathway actives can be prioritized for further testing as endocrine disruptors. Because such testing is expensive and time-consuming, there is value in reducing false positives without significantly increasing false negatives using these in vitro screens. Second, chemicals or chemical classes that show broad assay interference may potentially cause similar interference in other in vitro assays utilizing the same cell types or technology platforms. These chemicals can be flagged for extra scrutiny when analyzing results for other targets. Finally, methods developed for this test case can be applied to the analysis of results for other assays and pathways beyond the ER responses.
MATERIALS AND METHODS
Assays and chemicals
The input data for the model includes chemical structures and concentration-response data for 18 ER-related in vitro assays, plus data for many non-ER in vitro assay endpoints (ranging from 186 to 821 assays, depending on the chemical). The data used were generated by the EPA ToxCast program (Dix et al., 2007; Judson et al., 2010). The dataset comprises concentration-response data on 1812 chemicals with full data on ER pathway in vitro assays. These include 3 cell-free biochemical radioligand ER binding assays [Novascreen/NVS: (Knudsen et al., 2011; Sipes et al., 2013)]; a set of 3 protein complementation assays that measure formation of ER homodimers or heterodimers and test for activity against both ER-alpha and ER-beta, (each measured at 2 separate times for a total of 6 assay readouts) [Odyssey Thera/OT:(Stossi et al., 2014)]; 2 assays measuring interaction of green fluorescent protein (GFP)-tagged ER α or β with nuclear DNA [Odyssey Thera/OT: (Stossi et al., 2014)]; 2 transactivation assays measuring reporter RNA transcript levels [Attagene/ATG: (Martin et al., 2010)]; 2 transactivation assays measuring reporter protein level readouts in agonist mode and 2 transactivation assays in antagonist mode [Tox21: (Huang et al., 2014)]; and an ER-sensitive cell proliferation assay [ACEA: (Rotroff et al., 2013)]. The transactivation assays are a mix of formats including differences in reporter gene technology (Tox21_ERa_LUC_BG1:luciferase, Tox21_ERa_BLA:β-lactamase, ATG_ERE_CIS/ATG_ERa_TRANS:mRNA) and differences in receptor form (Tox21_ERa_LUC_BG1 and ATG_ERE_CIS are full length ER; Tox21_ERa_BLA and ATG_ERa_TRANS are the GAL4/UAS mammalian 1 hybrid system utilizing partial receptor constructs containing the receptor ligand-binding domain.) Use of these different formats allows 1 assay format to compensate for weaknesses inherent in another assay technology. The assay sources refer to the company or laboratory where the assays were performed. The 18 in vitro assays used are summarized in Table 1 and more detail is given in Supplementary Appendix 1. The assay IDs correspond to Figure 1. The chemicals are listed in Supplementary File S2 along with summary results from subsequent analyses. The chemicals were run in concentration-response format in all in vitro assays except for the cell-free binding assays (NVS). The NVS assays were initially run at a single concentration (25 μM), and if significant activity [3 median absolute deviations (MAD) above the median or 30% activity] was seen, the chemical was then run in concentration-response mode.
TABLE 1.
Summary of the In Vitro Assays Used With Their ID Mapping to the Model in Figure 1.
| Assay ID | Assay Name | Source | GeneTarget | Normalized Data Type | Assay Design Type | Biological Process Target | Detection Technology | Detection Technology Subtype | Measurement Timepoint (hr) | Organism | Tissue | Cell Format | Cell Line Name | Assay Footprint |
|---|---|---|---|---|---|---|---|---|---|---|---|---|---|---|
| A1 | NVS_NR_bER | NVS | ESR1 | Percent activity | Radioligand binding | Receptor binding | Lysate-based radiodetection | Scintillation counting | 18 | Bovine | Uterus | Tissue-based cell-free | NA | Microplate: 96-well plate |
| A2 | NVS_NR_hER | NVS | ESR1 | Percent activity | Radioligand binding | Receptor binding | Lysate-based radiodetection | Scintillation counting | 18 | Human | NA | Cell-free | NA | Microplate: 96-well plate |
| A3 | NVS_NR_mERa | NVS | Esr1 | Percent activity | Radioligand binding | Receptor binding | Filter-based radiodetection | Scintillation counting | 18 | Mouse | NA | Cell-free | NA | Microplate: 96-well plate |
| A4 | OT_ER_ERaERa_0480 | OT | ESR1 | Percent activity | Protein fragment complementation assay | Protein stabilization | Protein-fragment complementation | Fluorescence intensity | 8 | Human | Kidney | Cell line | HEK293T | Microplate: 384-well plate |
| A5 | OT_ER_ERaERa_1440 | OT | ESR1 | Percent activity | Protein fragment complementation assay | Protein stabilization | Protein-fragment complementation | Fluorescence intensity | 24 | Human | Kidney | Cell line | HEK293T | Microplate: 384-well plate |
| A6 | OT_ER_ERaERb_0480 | OT | ESR1 | Percent activity | Protein fragment complementation assay | Protein stabilization | Protein-fragment complementation | Fluorescence intensity | 8 | Human | Kidney | Cell line | HEK293T | Microplate: 384-well plate |
| A7 | OT_ER_ERaERb_1440 | OT | ESR1 ESR2 | Percent activity | Protein fragment complementation assay | Protein stabilization | Protein-fragment complementation | Fluorescence intensity | 24 | Human | Kidney | Cell line | HEK293T | Microplate: 384-well plate |
| A8 | OT_ER_ERbERb_0480 | OT | ESR2 | Percent activity | Protein fragment complementation assay | Protein stabilization | Protein-fragment complementation | Fluorescence intensity | 8 | Human | Kidney | Cell line | HEK293T | Microplate: 384-well plate |
| A9 | OT_ER_ERbERb_1440 | OT | ESR2 | Percent activity | Protein fragment complementation assay | Protein stabilization | Protein-fragment complementation | Fluorescence intensity | 24 | Human | Kidney | Cell line | HEK293T | Microplate: 384-well plate |
| A10 | OT_ERa_EREGFP_0120 | OT | ESR1 | Percent activity | Fluorescent protein induction | Regulation of gene expression | Microscopy | Optical microscopy: Fluorescence microscopy | 2 | Human | Cervix | Cell line | HeLa | Microplate: 384-well plate |
| A11 | OT_ERa_EREGFP_0480 | OT | ESR1 | Percent activity | Fluorescent protein induction | Regulation of gene expression | Microscopy | Optical microscopy: Fluorescence microscopy | 8 | Human | Cervix | Cell line | HeLa | Microplate: 384-well plate |
| A12 | ATG_ERa_TRANS_up | ATG | ESR1 | log2 fold induction | mRNA induction | Regulation of transcription factor activity | RT-PCR and Capillary electrophoresis | Fluorescence intensity | 24 | Human | Liver | Cell line | HepG2 | Microplate: 24-well plate |
| A13 | ATG_ERE_CIS_up | ATG | ESR1 | log2 fold induction | mRNA induction | Regulation of transcription factor activity | RT-PCR and Capillary electrophoresis | Fluorescence intensity | 24 | Human | Liver | Cell line | HepG2 | Microplate: 24-well plate |
| A14 | Tox21_ERa_BLA_Agonist_ratio | Tox21 | ESR1 | Percent activity | Beta lactamase induction | Regulation of gene expression | GAL4 b-lactamase reporter gene | Fluorescence intensity | 18 | Human | Kidney | Cell line | HEK293T | Microplate: 1536-well plate |
| A15 | Tox21_ERa_LUC_BG1_Agonist | Tox21 | ESR1 | Percent activity | Luciferase induction | Regulation of gene expression | Luciferase-coupled ATP quantitation | Bioluminescence | 22-24 | Human | Ovary | Cell line | BG1 | Microplate: 1536-well plate |
| A16 | ACEA_T47D_80hr_Positive | ACEA | ESR1 | Percent activity | Real-time cell-growth kinetics | Cell proliferation | RT-CES | Electrical sensor: impedance | 80 | Human | Breast | Cell line | T47D | Microplate: 96-well plate |
| A17 | Tox21_ERa_BLA_Antagonist_ratio | Tox21 | ESR1 | Percent activity | Beta lactamase induction | Regulation of gene expression | GAL4 b-lactamase reporter gene | Fluorescence intensity | 18 | Human | Kidney | Cell line | HEK293T | Microplate: 1536-well plate |
| A18 | Tox21_ERa_LUC_BG1_Antagonist | Tox21 | ESR1 | Percent activity | Luciferase induction | Regulation of gene expression | Luciferase-coupled ATP quantitation | Bioluminescence | 22 | Human | Ovary | Cell line | BG1 | Microplate: 1536-well plate |
Further details are provided in Supplemental Appendix 1. NVS = Novascreen; OT = Odyssey Thera; ATG = Attagene; Tox21 = assays run by the National Institutes of Health’s National Center for Advancing Translational Sciences (NCATS) as part of the Federal Tox21 program.
Reference chemicals
A set of 45 positive and negative reference chemicals were used to evaluate the performance of the model (described below). These include 28 agonist positives, 12 agonist negatives, 4 antagonist positives, and 14 antagonist negatives. Note that some chemicals are references for both agonist and antagonist mode, so these numbers sum to greater than 45. These chemicals have been used to validate ER in vitro assays and were taken from the OECD (Organisation for Economic Cooperation and Development) TG457 BG1 guidance document (OECD, 2012). The reference chemicals and their expected potencies are listed in Supplementary Appendix 3.
Data processing and synthetic concentration-response data
All of the concentration-response data were analyzed using a standardized data analysis pipeline, which automates the processes of baseline correction, normalization, curve-fitting, hit-calling, and detection of a variety of potential confounders. This pipeline, along with all of the raw and processed data, and annotations is publicly available [http://epa.gov/ncct/toxcast/data.html and http://actor.epa.gov/edsp21]. All in vitro assays except those run by Attagene were normalized to the range 0–100%, using the response of 17α-Ethinylestradiol. Attagene data were normalized as a fold-change over the solvent control (0.5–1% DMSO, which has been determined to have no effect on assay performance) and then multiplied by a factor of 25 to yield a range of approximately 0–100. The data from each chemical-assay pair was fit to 3 models: a constant model, a Hill model, and a Gain-Loss model. The latter allows the curve to rise from zero to a plateau, and then fall off again. This curve shape allowed us to account for non-specific assay interference, such as cytotoxicity occurring at high concentrations. Activity (“hit”) calls were determined based on a chemical-assay pair reaching a set of significance thresholds:
Median of normalized response values at a single concentration above the established response cutoff
Modeled top (T) of the curve above the established response cutoff
Hill or Gain-Loss model was the selected model over the constant model
In order to establish the response cutoff, the baseline median absolute deviation (BMAD) was calculated per assay using the distribution of the lowest 2 concentration’s normalized response values for all chemicals run in the in vitro assay. The response cutoff was then selected per assay as being the maximum of 3-BMAD, 20% above baseline, or an assay-specific cutoff, eg, 6-BMAD or 10-BMAD. The Akaike Information Criterion (Akaike, 1998) (AIC) was then calculated for each model, and the model with the lowest AIC was selected. For each model, the output included parameters as well as a number of diagnostics. The diagnostics were assigned to specific chemical sample-assay pairs and indicate the presence of potential confounding factors such as curves that are marginally active and hence could be the result of non-normally distributed background noise instead of true activity. An AC50 (activity concentration at half-maximal response), Hill-slope, and maximum activity (T or Top value) were extracted. To allow computational synthesis across different in vitro assays with different experimental designs (ie, different numbers of concentrations tested), a set of synthetic concentration-response activities was generated through interpolation for each chemical-assay pair at standardized concentrations. This procedure used the experimentally derived AC50, Hill-slope and Top parameters and a Hill equation. All AC50 values were in µM, and the synthetic concentrations were a 1.5-fold dilutions series of 45 concentrations from 1 pM to 100 µM.
Accounting for cytotoxicity-related assay interference
For many chemicals, we observed a large number of hits (positive assay responses) for ER and non-ER assays in the concentration range where cytotoxicity was observed. Cytotoxicity was measured using a collection of 35 assays in the ToxCast battery that detect cytotoxicity or other forms of cell loss across several cell lines and primary cell types. Many non-selective cellular responses are activated as the concentration tested reaches a critical point associated with cell stress or cytotoxicity. It appears that this is non-selective activity (assay interference) rather than being due to activity against the receptors that the assays are designed to test. The following scheme was used to filter out these non-selective, cell-stress/cytotoxicity-related assay hits. For chemicals with 2 or more positive responses in cytotoxicity assays, we calculated the median logAC50(cytotox) and the MAD of the logAC50(cytotox) hits. Next, we calculated the median of the MAD of the logAC50(cytotox) distributions across all chemicals to define the global cytotoxicity MAD. A new value (the Z-score) was then assigned to each in vitro assay hit:
| (1) |
If fewer than 2 cytotoxicity assays are hit, the median cytotoxicity concentration is arbitrarily set to 1000 µM, which simply sets all Z-values for assay hits to a value >3. A hit with a large value of Z occurs at concentrations significantly below where cytotoxicity is occurring. This hit is more likely due to target-selective mechanism biological activity. . The global cytotoxicity MAD is 0.26 log units.
Structure of the network model
Figure 1 is a graphical representation of the network model used to evaluate the integrated in vitro assay responses. The model was based on the series of molecular events that typically occur in a nuclear receptor-mediated response (Gronemeyer et al., 2004; Mangelsdorf et al., 1995). The process starts with the interaction of a chemical with an ER (Receptor node R1). For example, an ER agonist will cause the receptors to dimerize (node N1), translocate to the nucleus and recruit co-factors to form the complete active transcription factor complex (TF) (node N2). This TF binds to the chromatin DNA (node N3), initiates transcription of mRNA (node N4) and subsequent translation to protein (node N5). For ER agonist activity, 1 downstream consequence can be cell proliferation (node N6). Note that the temporal order of these processes is not necessarily as depicted here. Each of these processes (with the exception of cofactor recruitment) was measured in the current collection of 18 in vitro assays (represented in the figure as white stars). Table 1 provides the assay ID (A1–A18) to match the associated in vitro assay on Figure 1 and a brief assay description. More detail is provided in Supplementary Appendix 1. The ER pathway is shown in 2 modes: agonist (blue) and antagonist (red). The model assumes that a chemical interacting with the ER will bind in one or both of the agonist or antagonist conformations and in turn, trigger activity in the appropriate pathway. Note that the model allows for the prediction of mixed agonist/antagonist activity.
In addition to ER-mediated effects, each individual in vitro assay is subject to processes that can lead to non-specific activity, independent of the ER pathway node that it is supposed to measure. The assay interference pathways were modeled as alternate “pseudoreceptors” (gray arrow nodes). The details of the process connecting the theoretical pseudoreceptors to the assays were simplified to a single connection because, in general, we do not know the intermediate details of these processes or even the identity of the pseudoreceptors. Note that the pseudoreceptors are conceptualized here as surrogates for generic processes such as cytotoxicity that can lead to non-ER mediated assay activity. It is possible to describe many potential alternative assay interference pathways, but in general, the current data are not sufficient to distinguish between alternate models. Pseudoreceptors are then assigned to each group of assays (technology group) and to each assay individually. Only a single example of an assay-specific pseudoreceptor is shown in Figure 1, but all assays (with the exception of A16/R8 where the assay and the receptor are identical) have a corresponding pseudoreceptor. The bottom panel of Figure 1 shows the pattern of activity one would expect if specific receptors are activated, in this case R1, R2, and R6.
Mathematical representation of the network model
The computational model assumes that the value (the efficacy, A) returned by an assay at a given concentration is a linear sum of the contributions from the receptors that it measures, ie, it is a simple linear additive model:
| (2) |
where the elements of the F matrix are 1 if there is a connection between a receptor j and an assay i and 0 otherwise. The index i goes over all assays and the index j goes over all receptors. This holds for direct connections, where a receptor is directly linked to an assay in Figure 1, and for indirect connections, where a receptor is linked through one or more internal nodes, designated by the circles in Figure 1. Therefore, the model assumes lossless transmission of signals from the receptor through the internal nodes to the assays. The goal is then to find a set of values that minimize the difference between the predicted assay values () and the measured ones () for each chemical and concentration. is calculated using the forward model (equation 2). For each chemical-concentration pair, a constrained least-squares minimization approach is used where the function being minimized is:
| (3) |
where must satisfy the constraints:
| (4) |
It is possible to assign weights to the assays in the sum of equation 3, but in practice, this did not change the results in any qualitative way, and introduced a number of additional free parameters into the model. The term penalty(R) penalizes solutions that predict that many receptors are being simultaneously activated by the chemical. It is given by
| (5) |
This penalty term helps stabilize the solutions and enforces a reasonable physical assumption about chemical promiscuity, eg, it is unlikely that many or most chemicals will selectively interact with a number of dissimilar molecular targets through non-covalent binding. Note that this problem is underdetermined because there are more receptors than assays, and so does not have a unique solution. We investigated 2 other commonly used penalty terms, RIDGE(Hoerl and Kennard, 1970) and LASSO (Tibshirani, 1996) as described in Supplementary Appendix 2. The penalty term in equation 5 (called THRESHOLD) was selected because it best enforced the physical constraint, and because results were less sensitive to the exact value of α. For most results, we use an intermediate value of α = 1, but the final data files additionally give selected values for α = 0.01 and α = 100. The penalized least-squares solution to equation 3 is carried out using the R-language function optim in package stats (Ihaka and Gentleman, 1996), with method= L-BFGS-B and the constraints in equation 4. When solving the equations, we start from the low concentration end where the expected activity is zero and use this as the initial condition for all receptors in the model. For subsequent concentrations, we then use the output values for the previous concentration as the initial values for the current one. The model results in a response value (between 0 and 1) for each receptor at each concentration. The activity for each receptor is summarized as an area under the curve (AUC), which is the quadrature integral across the concentration range:
| (6) |
The factor sign(slope) is included to handle cases where one of the assays or sets of assays is active at significantly lower concentrations than the remaining assays. The corresponding receptor curve will then rise and subsequently fall, and this AUC needs to be discounted. Finally, AUC values are scaled so that AUC(agonist) = 1 for 17α-Ethinylestradiol, which is the positive reference compound for all agonist assays. AUC(R1/agonist) and AUC(R2/antagonist) (or subsequently AUC(agonist)/AUC(antagonist)) is the terminology used to describe the activity in the agonist and antagonist modes, respectively. AUC(Ri;I > 2) describes activity in one of the other pseudoreceptors 3–9. AUC(Ai) describes the AUC value for one of the single-assay pseudoreceptors.
One challenge with this modeling approach is how to interpret the AUC values. For a pure ER agonist (no activity in any of the pseudoreceptors), the AUC(agonist) versus concentration curve closely resembles the concentration-response profile for any of the assays, with activity going from 0 to 1 with an AC50-like value close to that observed in the assays. For mixed cases, the concentration-response curves may be more complex than a Hill curve and will have a maximum efficacy of less than 1. Qualitatively, we interpret these AUC values as concentration-specific probabilities that the chemical is interacting with the corresponding (pseudo) receptor. One final set of quantities calculated are the “median-AC50” values. These are the median values of the log-AC50 for assays active for that chemical.
Results
Observed Correlation Among In Vitro Assays From the Same Technology
Two-dimensional hierarchical clustering was performed on the potencies (log AC50 values) of the 18 ER-related in vitro assays (Fig. 2). Strong clustering by technology/pseudoreceptor was observed. The hypothesis we tested in this article is that assay interference exists, and is at least somewhat driven by specific chemical technology activity that is independent of ER-ligand binding. In a clustering analysis like this, if the clusters largely line up with technologies, then that is at least supportive of our hypothesis. Note that the one exception to this clustering is R7 (the Tox21 agonist assays), which were grouped because they were run in the same lab rather than because they were the same technology (they have different readouts, cell lines). This plot suggests that some fraction of positive assay responses are caused by technology-specific assay interference rather than ER receptor-mediated activity. Other chemicals showed activity across a broad range of ER-related in vitro assays.
FIG. 2.
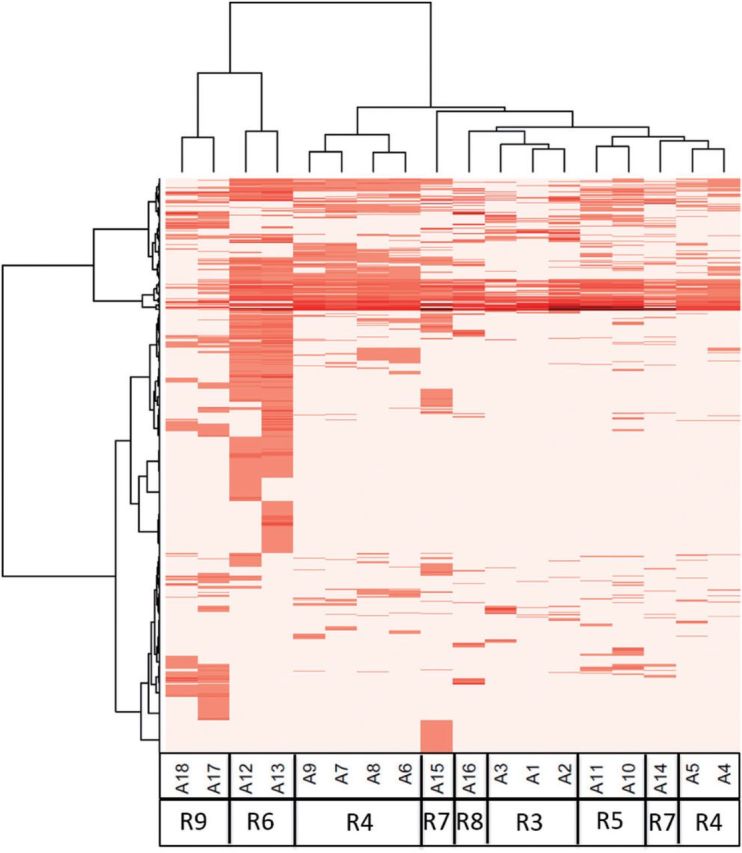
Two-way hierarchical clustering of chemical activity across the 18 in vitro assays used to test for ER activity. Assays and technologies are aligned across the x-axis, where the “A” and “R” values refer to the assay and receptors/pseudoreceptors from Figure 1 and Table 1.Chemicals are aligned along the y-axis. The heatmap shows –log10(AC50) values for all assays and all chemicals with at least one assay hit. Darker red indicates more potent activity (lower AC50), while white represents inactive chemical-assay pairs. Note that the assays cluster by technology/pseudoreceptor.
Network Modeling of In Vitro Assay Activity
Figure 3 illustrates common types of assay activity and model behavior represented by prototype chemicals. For example, bisphenol A (BPA) shows a clear concentration-response in agonist activity (right-hand panel, blue curve). However, there is also activity in the R6 pseudoreceptor (corresponding to the transactivation assays) that rises at low concentrations and then drops. The corresponding in vitro assays show activity at lower concentrations than the others, but at high concentrations, substantial evidence points toward agonist activity. Note that BPA also has activity in one of the antagonist assays (upper left panel, A17, gold line), consistent with known SERM activity at high concentrations (Nagel et al., 2001). 4-hydroxytamoxifen, a reference antagonist, shows clear antagonist activity. Alpha-cyclodextrin shows strong activity only in the 3 cell-free binding assays, resulting in a strong assay interference signal in the R3 pseudoreceptor. This is likely because this chemical interferes with the radioligand assay by binding to the radioligand. This molecule is known to bind hydrophobic molecules such as fatty acids and cholesterol (Christian et al., 1997). The most frequent case (not shown here, 762 out of 1812, 42%) is one in which there is no activity in any assay. Notice that 58% of chemicals have at least some activity in at least 1 assay. A priori, one would not expect this high a fraction of true positives in a diverse chemical library, so significant assay interference/false-positive activity is likely to exist. The data for the complete set of chemicals are given in Supplementary Files S2 (tabular) and S3 (plots corresponding to Fig. 3). Data are also available through the EDSP21 dashboard: http://actor.epa.gov/edsp21 and the ToxCast data web site: http://epa.gov/ncct/toxcast/data.html. Table 3 provides a longer list of positive chemicals across potencies and structural classes.
FIG. 3.
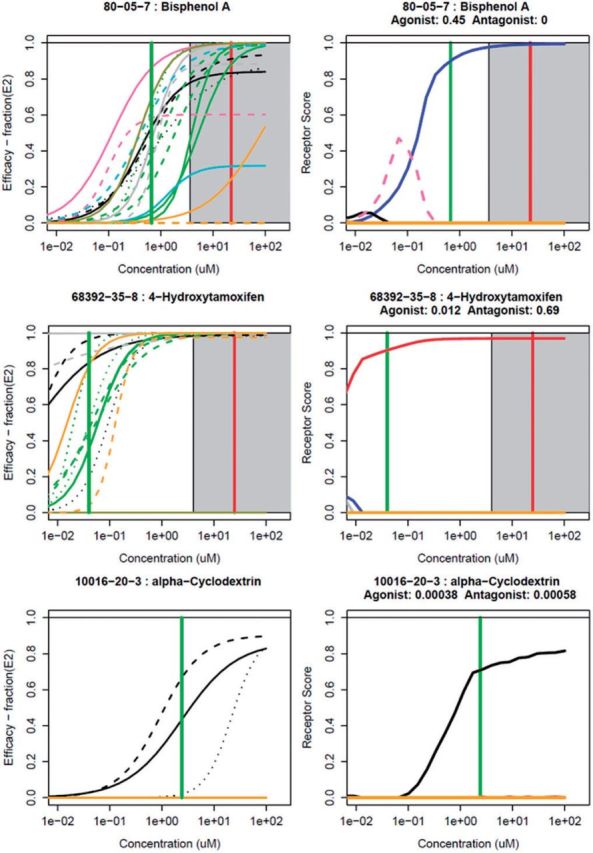

Results of the model for 3 prototype chemicals. For each chemical, the left-hand panel shows the synthetic concentration-response data for the 18 assays, colored by assay groups defined in the legend. The right-hand panel shows the corresponding magnitude of the modeled receptor responses. The agonist receptor (R1) is designated by blue, the antagonist receptor (R2) by red and the other pseudoreceptors are colored as indicated in the legend. AUC values for the agonist (R1) and antagonist (R2) receptors are provided below the chemical name. For chemicals with cell-stress/cytotoxicity activity (2 or more cytotoxicity hits, see Methods), the cell-stress/cytotoxicity center is indicated by a vertical red line, and the cell-stress/cytotoxicity region (starting 3 cell-stress/cytotoxicity MAD below the cell-stress/cytotoxicity center) is indicated by the gray shaded region. A green horizontal bar indicates the median-AC50 of the active assays. Similar plots for all chemicals are given in Supplemental File S3.
TABLE 3.
The Most Potent 72 Agonist and Antagonist Chemicals Out of the 1812 Tested
| CASRN | Name | Example Use | Structure Category | AUC (Agonist) | AUC (Antagonist) | Median AC50 (µM) | Median T | Median Z |
|---|---|---|---|---|---|---|---|---|
| 57-91-0 | 17alpha-Estradiol | Pharmaceutical | Steroid E | 1.06 | 0 | 0.003 | 110 | 12.8 |
| 57-63-6 | 17alpha-Ethinylestradiol | Pharmaceutical | Steroid E | 1 | 0 | 0.001 | 100 | 14.4 |
| 84-16-2 | meso-Hexestrol | Pharmaceutical | Phenol–phenol [CC] | 0.99 | 0 | 0.004 | 103 | 14.4 |
| 56-53-1 | Diethylstilbestrol | Pharmaceutical | Phenol–phenol [CC] | 0.94 | 0.01 | 0.001 | 100 | 14.7 |
| 50-28-2 | 17beta-Estradiol | Pharmaceutical | Steroid E | 0.94 | 0.02 | 0.002 | 100 | 12.2 |
| 474-86-2 | Equilin | Pharmaceutical | Steroid E | 0.82 | 0 | 0.01 | 118 | 18.9 |
| 53-16-7 | Estrone | Pharmaceutical | Steroid E | 0.81 | 0.002 | 0.004 | 105 | 13.8 |
| 50-27-1 | Estriol | Pharmaceutical | Steroid E | 0.79 | 0.01 | 0.03 | 108 | 17.0 |
| 72-33-3 | Mestranol | Pharmaceutical | Steroid E | 0.74 | 0 | 0.07 | 107 | 15.9 |
| 17924-92-4 | Zearalenone | Mycotoxin | Carboxylic acid ketone | 0.71 | 0 | 0.15 | 98 | 14.0 |
| 2971-36-0 | HPTE | Pesticide degradate | Phenol-phenol [C] halide | 0.57 | 0.04 | 0.10 | 100 | 8.3 |
| 1478-61-1 | Bisphenol AF | Plastics | Phenol-phenol [C] halide | 0.55 | 0 | 0.10 | 107 | 9.1 |
| 446-72-0 | Genistein | Natural product | Genistein-like | 0.54 | 0 | 0.34 | 103 | 4.7 |
| 77-40-7 | Bisphenol B | Plastics | Phenol–phenol [C] | 0.49 | 0.002 | 0.21 | 101 | 7.8 |
| 80-05-7 | Bisphenol A | Plastics | Phenol–phenol [C] | 0.45 | 0 | 0.67 | 110 | 5.6 |
| 486-66-8 | Daidzein | Flavone | Genistein-like | 0.44 | 0 | 1.3 | 107 | 4.5 |
| 84852-15-3 | 4-Nonylphenol, branched | Detergent ingredient | Phenol alkyl | 0.44 | 0 | 1.6 | 94 | 3.9 |
| 105624-86-0 | 5HPP-33 | Pharmaceutical | Thalidomide-like | 0.42 | 0 | 0.98 | 89 | 4.8 |
| 104-43-8 | 4-Dodecylphenol | Industrial intermediate | Phenol alkyl | 0.41 | 0 | 1.1 | 84 | 4.6 |
| 521-18-6 | 5alpha-Dihydrotestosterone | Pharmaceutical | Steroid A | 0.4 | 0 | 2.8 | 86 | 3.5 |
| 131-55-5 | 2,2',4,4'-Tetrahydroxybenzophenone | UV-absorber | Phenol–phenol [CO] | 0.40 | 0 | 1.8 | 104 | 4.2 |
| 797-63-7 | Norgestrel | Pharmaceutical | Steroid P | 0.39 | 0 | 0.44 | 95 | 7.5 |
| 140-66-9 | 4-(1,1,3,3-Tetramethylbutyl)phenol | Chemical intermediate | Phenol alkyl | 0.39 | 0 | 2.5 | 94 | 3.7 |
| 27193-86-8 | Dodecylphenol | Chemical reactant/solvent | Phenol alkyl | 0.39 | 0 | 1.5 | 88 | 4.6 |
| 57-85-2 | Testosterone propionate | Pharmaceutical | Steroid A | 0.39 | 0 | 3.4 | 100 | 3.7 |
| 789-02-6 | o,p'-DDT | Insecticide | Phenyl–phenyl [C] chloro | 0.39 | 0 | 2.4 | 89 | 4.0 |
| 58-72-0 | Triphenylethylene | Chemical reactant | Triphenyl [C] | 0.38 | 0 | 1.6 | 95 | 10.6 |
| 599-64-4 | 4-Cumylphenol | Industrial intermediate | Phenol–phenyl [C] | 0.38 | 0 | 2.3 | 99 | 4.1 |
| 5153-25-3 | 2-Ethylhexylparaben | Microbicide | Paraben | 0.37 | 0 | 2.3 | 102 | 4.0 |
| 53-43-0 | Dehydroepiandrosterone | Pharmaceutical | Steroid A | 0.37 | 0 | 2.4 | 104 | 10.0 |
| 491-80-5 | Biochanin A | Flavone | Genistein-like | 0.36 | 0 | 4.0 | 98 | 8.7 |
| 68-96-2 | 17alpha-Hydroxyprogesterone | Pharmaceutical | Steroid P | 0.34 | 0 | 0.36 | 105 | 13.0 |
| 27955-94-8 | 4,4',4-Ethane-1,1,1-triyltriphenol | Plastics | Triphenol [C] | 0.32 | 0 | 3.0 | 103 | 3.2 |
| 520-36-5 | Apigenin | Flavone | Genistein-like | 0.31 | 0 | 2.1 | 95 | 9.8 |
| 80-46-6 | 4-(2-Methylbutan-2-yl)phenol | Chemical reactant | Phenol alkyl | 0.28 | 0 | 6.2 | 112 | 4.9 |
| 17696-62-7 | Phenylparaben | Microbicide | Paraben | 0.28 | 0 | 5.7 | 122 | 7.4 |
| 1219-38-1 | Octylparaben | Microbicide | Paraben | 0.27 | 0 | 5.7 | 81 | 3.2 |
| 131-56-6 | 2,4-Dihydroxybenzophenone | UV-absorber | Phenol–phenyl [CO] | 0.27 | 0 | 7.4 | 111 | 8.` |
| 80-09-1 | 4,4'-Sulfonyldiphenol | Chemical reactant | Phenol–phenol [SO2] | 0.26 | 0 | 22.5 | 98 | 6.3 |
| 520-18-3 | Kaempferol | Flavone | Genistein-like | 0.25 | 0 | 4.0 | 76 | 9.0 |
| 6088-51-3 | 6-Hydroxy-2-naphthyl disulfide | Unknown | Phenolnaphthalene-phenolnaphthalene [SS] alcohol | 0.25 | 0 | 5.4 | 84 | 3.7 |
| 5349-51-9 | 4-(2-Methylbutan-2-yl)cyclohexanol | Fragrance agent | Alcohol sec alkane cyclo | 0.25 | 0 | 16.2 | 90 | 3.5 |
| 53-19-0 | o,p'-DDD | Pesticide degradate | Phenyl–phenyl [C] chloro | 0.24 | 0 | 7.4 | 66 | 3.1 |
| 92-69-3 | 4-Phenylphenol | Chemical reactant | Phenol–phenylphenol-2 | 0.22 | 0 | 13.9 | 124 | 7.1 |
| 94-13-3 | Propylparaben | Microbicide | Paraben | 0.21 | 0 | 20.6 | 136 | 6.4 |
| 63-05-8 | 4-Androstene-3,17-dione | Pharmaceutical | Steroid A | 0.18 | 0 | 0.03 | 86 | 10.4 |
| 126-00-1 | Diphenolic acid | Plasticizer | Phenol–phenol [C] carboxylic acid | 0.17 | 0 | 41.9 | 100 | 5.2 |
| 99-71-8 | 4-(Butan-2-yl)phenol | Chemical intermediate | Phenol alkyl | 0.16 | 0 | 20.4 | 101 | 6.4 |
| 98-54-4 | 4-tert-Butylphenol | Plasticizer | Phenol alkyl | 0.16 | 0 | 21.5 | 89 | 6.3 |
| 14816-18-3 | Phoxim | Insecticide | Phenyl thiophosphate nitrile | 0.16 | 0 | 25.8 | 64 | 6.0 |
| 2919-66-6 | Melengestrol acetate | Pharmaceutical | Steroid P | 0.16 | 0 | 0.03 | 97 | 17.4 |
| 124-22-1 | 1-Dodecanamine | Surfactant | Amine pri | 0.15 | 0 | 5.4 | 70 | 4.8 |
| 6683-19-8 | Irganox 1010 | Antioxidant | Phenol carboxylate chelator 4 | 0.15 | 0 | 14.2 | 83 | 7.0 |
| 51-52-5 | 6-Propyl-2-thiouracil | Pharmaceutical | Uracil | 0.14 | 0 | 7.7 | 66 | 8.0 |
| 612-82-8 | 3,3'-Dimethylbenzidine dihydrochloride | Chemical reactant (dyes) | Aniline-aniline | 0.14 | 0 | 0.04 | 89 | 8.1 |
| 4712-55-4 | Diphenyl phosphite | Stabilizer (PVC) | Phenyl phosphate | 0.14 | 0 | 34.8 | 64 | 5.5 |
| 141-79-7 | 4-Methylpent-3-en-2-one | Solvent | Ketone ene | 0.14 | 0 | 17.2 | 83 | 6.70 |
| 2/3/6893 | 3,5,3'-Triiodothyronine | Pharmaceutical | Phenol–phenyl [O] iodo carboxylic acid | 0.14 | 0 | 10.4 | 69 | 7.53 |
| 6055-19-2 | Cyclophosphamide monohydrate | Pharmaceutical | Phosphamide | 0.14 | 0 | 13.2 | 74 | 7.1 |
| 480-40-0 | Chrysin | Flavone | Phenol benzopyran | 0.13 | 0 | 10.7 | 79 | 7.3 |
| 3319-31-1 | Tris(2-ethylhexyl) trimellitate | Plastics | Phthalate | 0.12 | 0 | 44.6 | 76 | 5.1 |
| 1638-22-8 | 4-Butylphenol | unknown | Phenol alkyl | 0.11 | 0 | 17.4 | 91 | 6.7 |
| 140-10-3 | Cinnamic acid | Flavor agent/Fragrance agent | Phenyl carboxylic acid | 0.10 | 0 | 25.8 | 68 | 5.8 |
| 960-71-4 | Triphenylborane | Chemical intermediate | Triphenyl [B] | 0.10 | 0 | 47.0 | 71 | 5.0 |
| 50-41-9 | Clomiphene citrate | Pharmaceutical | Tamoxifen-like | 0.03 | 0.59 | 0.04 | 124 | 8.3 |
| 54965-24-1 | Tamoxifen citrate | Pharmaceutical | Tamoxifen-like | 0.03 | 0.55 | 0.16 | 136 | 6.5 |
| 82640-04-8 | Raloxifene hydrochloride | Pharmaceutical | Phenol-phenol | 0.02 | 0.67 | 0.01 | 131 | 12.3 |
| 10540-29-1 | Tamoxifen | Pharmaceutical | Tamoxifen-like | 0.02 | 0.45 | 0.28 | 131 | 6.1 |
| 68392-35-8 | 4-Hydroxytamoxifen | Pharmaceutical | Tamoxifen-like | 0.01 | 0.69 | 0.04 | 115 | 10.6 |
| 90357-06-5 | Bicalutamide | Pharmaceutical | Flutamide-like | 0.003 | 0.11 | 9.7 | 57 | 7.3 |
| 84371-65-3 | Mifepristone | Pharmaceutical | Steroid P | 0.003 | 0.31 | 2.0 | 110 | 4.1 |
| 129453-61-8 | Fulvestrant | Pharmaceutical | Steroid E | 0 | 0.64 | 0.04 | 113 | 7.1 |
To be included in the list, either AUC (agonist) or AUC (antagonist) had to exceed 0.1, the median T had to be >50%, and the median Z had to be greater than 3. AUC < 0.001 are set to zero. Chemicals are ordered by decreasing value of AUC (R1).
Reference Chemicals
The AUC values for the ER reference chemicals are plotted in Figure 4. For the positive agonist chemicals, all but diethylhexyl phthalate (DEHP) and dicofol have non-zero AUC(agonist) values. DEHP is inactive in all assays, but dicofol is active in 3 of the 6 dimerization assays near the top of the tested concentration range, which results in a small but non-zero AUC(R4) value of 0.02. These 2 chemicals are in the “Very Weak” class, so they are potentially active only at concentrations above where the current assays have been tested for most or all assays (100 µM). The AUC(agonist) values for the other positive chemicals are ordered approximately with the expected potency class. All of the negative agonist reference chemicals showed AUC(agonist) values of zero.
FIG. 4.
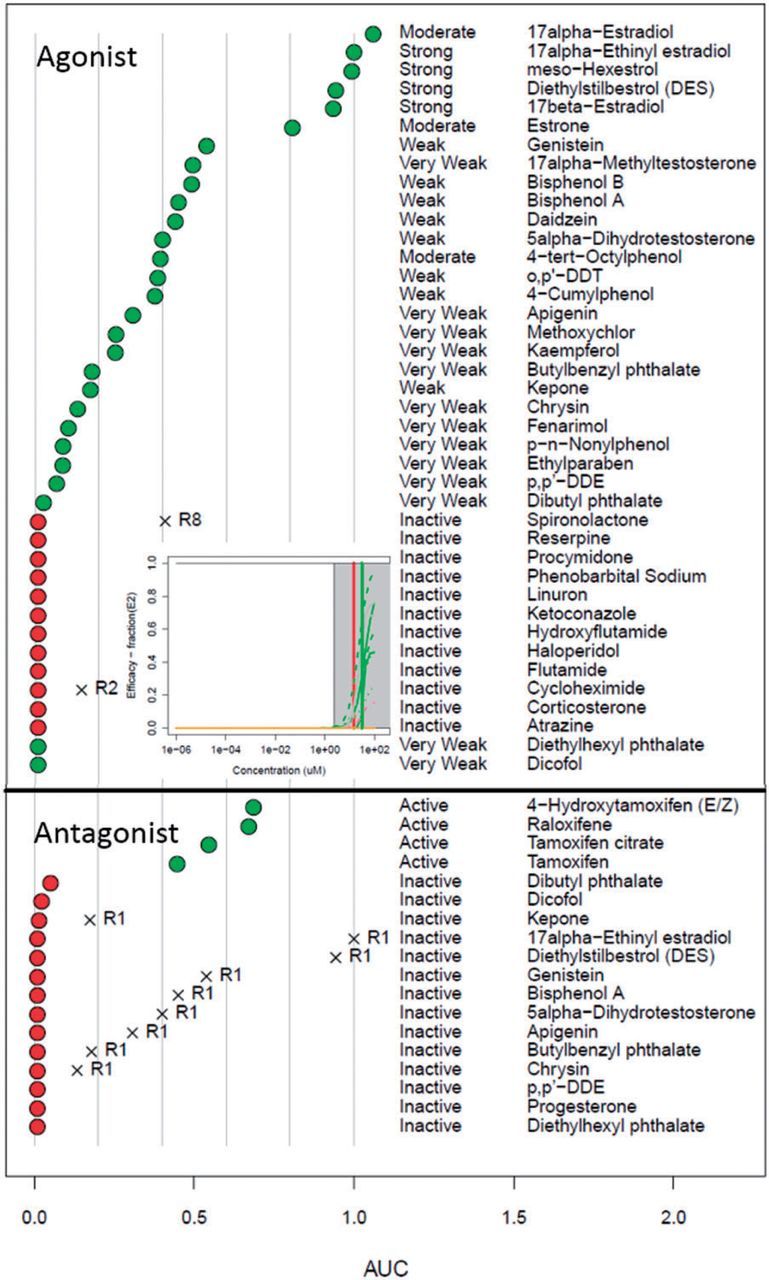
Plots showing activity of the agonist (top) and antagonist (bottom) reference chemicals. Chemicals that are intended to be positive are indicated by green circles, while those intended to be inactive are indicated by red circles. For the agonists, the expected potency range is also indicated (middle column). For chemicals with one or more pseudoreceptor AUC values greater than zero, the value is indicated by an X, and the pseudoreceptor name is indicated. The inset shows the assay curves for dibutyl phthalate, as described in the text (colored based on Fig. 3).
All 4 of the positive antagonist reference chemicals are positive with large AUC(antagonist) values. Three negative antagonist reference chemicals yield non-zero AUC(antagonist), but all are <0.05. Most of the negative antagonist reference chemicals are positive references for the agonist mode, and they appropriately yield a high AUC(agonist) value. A specific example is dibutyl phthalate, which is defined in the OECD reference list as a very weak positive agonist and a negative antagonist. Our data shows very weak activity in both modes, but all activity occurs in the cytotoxicity region (see the inset in the figure). Therefore, the activity in the antagonist assays leading to the non-zero AUC(antagonist) may be driven by false-positive loss of signal due to cytotoxicity. In general, we see that the positive reference chemicals, with the exception of some that are very weak, are classified as having the appropriate activity class (ie, agonist or antagonist). Negative reference chemicals either have no activity in any assay or are classed as being active in only one of the pseudoreceptor channels with scores higher than for the agonist or antagonist receptors. Supplementary File S4 provide the agonist and antagonist mode AUC values for the reference chemicals and plots of the assay and receptor concentration-response profiles, respectively.
Activity Classifications of the Commercial and Environmental Chemicals
Figure 5 summarizes the results of the modeling effort over the 1812 chemicals. In the idealized case where all assays are activated (either for the agonist or antagonist mode) at the same concentration, and reach 100% efficacy, the relation between the median-AC50 (which would be the common AC50 for all assays) and AUC would be linear. However, in the more common case where the assay AC50s are spread out, the agonist/antagonist curve tends to rise sooner than the median of the assays (See Fig. 3 for BPA comparing the blue agonist curve with the assays AC50 median, the green vertical line). The dashed line is the best fit from a linear regression between AUC and log(minimum-AC50) for chemicals with AUC > 0.1. The horizontal line at AUC = 0.1 provides a qualitative break between chemicals following the linear AC50 vs. AUC trend and those showing low potency in one or a few assays.
FIG. 5.

Plot of the maximum AUC vs. minimum-AC50 values. Each point is a single chemical that was active in at least 1 assay. The AUC value given is the maximum of the AUC (agonist) and AUC (antagonist) values for the chemical. The dashed line is the best-fit for AUC(agonist) values >0.1. Chemicals are labeled in order: black circle, at least 1 AUC > 0.1; green up-triangle, positive agonist reference chemical; green down-triangle, positive antagonist reference chemical; red diamond, negative reference chemical; cyan circle, example chemicals with AUC significantly below the fitted line but above 0.1. The vertical line at 100 µM indicates the highest concentration tested, while the horizontal line at AUC = 0.1 indicates an approximate threshold between chemicals with clear agonist/antagonist activity and those that are potentially active through interference processes. The inset shows graphs of assay activity for 4-androstene-3,17-dione (colored based on Fig. 3).
Chemicals fall into one of several general groups. The first are those lying along the dashed line, which is the expected behavior for true actives. We have labeled the most potent non-reference chemicals, those with AUC > 0.4 (chemicals 1–10). Fulvestrant, equilin, estriol, clomiphene citrate, and mestranol are all steroid pharmaceuticals that are designed to target ER (Wishart et al., 2008). Bisphenol AF is a close analog of bisphenol A, one of the reference agonist chemicals. Zearalenone is a mycotoxin with known estrogenic activity (Higa-Nishiyama et al., 2005; Le Guevel and Pakdel, 2001). HPTE is a degradate of the pesticide methoxychlor and is a known environmental estrogen (Miller et al., 2006). Norethindrone is a progesterone derivative. 17beta-trenbolone is synthetic androgen. Both of these steroids appear to be weakly active against ER relative to their activity in their native receptor. Therefore, none of the most potent set of actives is novel. It should be noted that norethindrone, as with other steroid chemicals, could be contaminated with a low level of a more potent derivative, which for this chemical would be the estrogen mestranol. We have analytical QC on norethindrone (data not shown), which shows all samples are at least 90% pure. However, given that mestranol is approximately 2 orders of magnitude more potent, it would only require a 1% contamination level to exhibit the observed activity.
A second interesting set of chemicals are those labeled in cyan in Figure 5 (chemicals 11-13). These have low but significant AUC values (0.1–0.2) but have at least one very potent AC50 value. The most potent of these is 4-androstene-3,17-dione, a potent androgen. The assay plot for this chemical is shown as an inset in Figure 5. The most potent assays are the ATG transactivation assays. This assay platform has 2 interesting features, first that it is run in HepG2 cells with some metabolic activity, and second, that it is highly multiplexed, including having androgen receptor readouts simultaneous with those for the ER. So, 2 possibilities exist for the potent activity of this androgen—there could be metabolic activation, leading to real ER activity, or there could be assay technology crosstalk. Understanding this behavior is the subject of ongoing research. Melengestrol acetate is a progestin, and is most potent in the ACEA cell proliferation assay. The cells used in this assay (T47D) are known to be sensitive to progestins and glucocorticoids (Chan et al., 1989). 3,3'-Dimethylbenzidine dihydrochloride, an intermediate in the production of dyes, is active in the 3 cell-free radioligand binding assays, indicating its potential to disrupt the protein in these assays, potentially through protein denaturation.
A final set of chemicals are those with some weak activity in one or more of the assays. There are further chemicals with AUC(agonist) in the range of values seen with the weak and very weak reference chemicals (green triangles, lower right of figure), and these would be worth additional investigation, although with a lower priority than those chemicals that are more potent. Note that there is greater uncertainty about activity for chemicals where the “true” activity approaches the upper limit of testing (100 µM) because of the large spread in AC50 values across the assays. Finally, there are a set of chemicals with very low median-AC50s, but low or zero AUC(agonist/antagonist) (black points running along the bottom middle). These chemicals are very potent in one assay or technology, and are the typical chemicals causing assay interference.
One goal of this study was to determine whether a chemical interacts with ER based on data from in vitro assay which is subject to noise and assay interference. Table 2 gives the counts of chemicals for each of the receptors or pseudoreceptors with at least 1 chemical having an AUC > 0.2, over selected ranges. For the agonists and antagonists, one can see that the number of chemicals in these potency categories shifts as a function of the penalty term strength α (see equation 5).
TABLE 2.
Counts of Chemicals for Each Receptor/Pseudoreceptor as a Function of AUC Value
| Receptor | 0.1–0.2 | 0.2–0.5 | 0.5–1 |
|---|---|---|---|
| AUC(Agonist) α = 0.01 | 22 | 37 | 12 |
| AUC(Agonist) α = 1 | 36 | 42 | 14 |
| AUC(Agonist) α = 100 | 51 | 49 | 16 |
| AUC(Antagonist) α = 0.01 | 4 | 4 | 4 |
| AUC(Antagonist α = 1 | 9 | 4 | 5 |
| AUC(Antagonist) α = 100 | 10 | 8 | 5 |
| AUC(R3) | 3 | 2 | 0 |
| AUC(R6) | 36 | 7 | 0 |
| AUC(R7) | 0 | 0 | 1 |
| AUC(R8) | 14 | 15 | 2 |
| AUC(R9) | 21 | 4 | 0 |
| AUC(A1) | 0 | 1 | 1 |
| AUC(A2) | 4 | 1 | 0 |
| AUC(A3) | 12 | 7 | 0 |
| AUC(A12) | 17 | 2 | 0 |
| AUC(A13) | 32 | 9 | 0 |
| AUC(A15) | 30 | 5 | 0 |
| AUC(A17) | 29 | 6 | 0 |
| AUC(A18) | 7 | 6 | 0 |
Only receptors or pseudo receptors with at least 1 chemical with AUC > 0.2 are listed. Counts for the agonist and antagonist modes as a function of α are also given. Note that for the pseudo receptors, all values use α = 1.
Understanding all of the causes of assay interference (and hence pseudoreceptor activity) is beyond the scope of this study, but we analyzed 2 major factors that appear to play a role. These factors include non-normal baseline variability and cytotoxicity or cell-stress-induced non-specific activity. In the assay data processing pipeline (see Methods), baseline variability is assumed to be approximately normally distributed, and to be due to noise processes. However, other processes can cause baseline shifts, for instance uncorrected edge effects on a microtiter plate. Assay data processing attempts to correct for these types of effects, but in a high-throughput automated system, some issues will remain. A second potential cause of assay interference is cell-stress or cytotoxicity related non-selective activity. With in vitro assays, one often observes false activity in many assays at concentrations near cytotoxicity. The Z-score (see methods) is used to quantify the relative proximity of an assay AC50 to the cytotoxicity region. Qualitatively, Z < 3 may be associated with cytotoxicity, while Z ≥ 3 is not. For most assays, we observe a bimodal distribution of Z-scores with a minimum at ∼3. An example of the Z-score distribution is shown in Figure 6 for ATG_ERa_TRANS_up (assay A12).
FIG. 6.

Histogram of Z-scores for the assay ATG_ERa_TRANS_up. The Z-score is defined as the distance between the median cytotoxicity concentration and a chemical’s AC50 in this assay, in units of global cytotoxicity MAD, for all chemicals active in this assay. One can see a bimodal distribution with one peak at zero (marked with a heavy line) and another with a peak near 6. We hypothesize that chemicals active in the low-Z region are more likely to be false positives and less likely to be estrogenic than those active in the high-Z region.
For subsequent analyses, we examined chemical activity after filtering for likely non-ER activity using the maximum efficacy (Top or T) and cytotoxicity (ie, Z-score). For each chemical, the median T and Z-scores were calculated for the corresponding assays, and chemicals were removed with T < 50% or Z < 3. A total of 165 chemicals passed this filter. The chemicals filtered out were typically those with low AUC values (active only at high concentrations). Figure 7 shows the fraction of chemicals remaining after the filtering for receptors or pseudoreceptors with more than 5 hits and with AUC > 0.1 before filtering. For illustration, only multi-assay pseudoreceptors are shown. One can see that the low AUC bins lose the most number of chemicals. Pseudoreceptor R9 loses the largest fraction of chemicals in all bins, likely because the loss-of-signal antagonist assays making up R9 are the most subject to being confounded by cytotoxicity (Huang et al., 2014). This is in contrast to R3, made up of the cell-free radioligand binding assays, which lose the smallest fraction of chemicals in the intermediate AUC bins, likely because these assays are less sensitive to the cytotoxicity processes. Finally, note that a number of agonist and antagonist chemicals in the low and intermediate AUC bins are also lost. These are chemicals that are active in many ER assays, and include some of known weak estrogens (linear nonylphenol is an example), but whose activity all occurs in the cytotoxicity region. We would argue that, while these chemicals may be truly estrogenic, they are of more concern from their cytotoxicity than as estrogens.
FIG. 7.

Bar chart showing the fraction of chemicals remaining for each of the multi-assay receptors/pseudoreceptors after filtering for efficacy (T) and cytotoxicity (Z-score). The receptors were limited to those with 5 or more chemicals with AUC > 0.1 from Table 2. If there were no chemicals for a pseudoreceptor in a given AUC bin, a small negative bar is shown. The legend indicates AUC ranges corresponding to Table 2.
A total of 72 chemicals have an AUC(agonist) or AUC(antagonist) > 0.1, median-Z-score > 3, and median-T > 50%. These are listed, along with a variety of annotations in Table 3. Many of these chemicals fall into 2 main structural classes with known estrogenic activity—steroids (16, 22%), and phenol-containing compounds (41, 57%). Pharmaceuticals are the most widely represented use class (28, 39%). Other use classes include antioxidants, detergents/surfactants, pesticides, plastics and other industrial reagents and UV absorbers. Another interesting class are chemicals that are found in foods, including the natural phytoestrogen flavones genistein, daidzein, biochanin A, apigenin, kaempferol and chrysin; and the flavor/fragrance ingredient 4-(2-methylbutan-2-yl)cyclohexanol (also known as 4-tert-amylcyclohexanol), which is a perfume ingredient.
DISCUSSION
We have developed a computational approach to distinguish true ER receptor-mediated agonist and antagonist activity from false positive activity often related, we postulate, to assay interference. The primary driver of this application is the need to screen thousands of man-made chemicals found in the environment for their potential to interact with the ER. Current in vivo methods used for chemical safety testing are too slow and resource intensive to screen a set of chemicals of this magnitude. The present method ranked large numbers of chemicals based on potential ER pathway activity in a manner that is useful for setting priorities for further screening or testing.
The method described here uses a network model to integrate concentration-response profiles for a collection of 18 in vitro assays probing different molecular processes in the ER pathway. The model assigns scores for true agonist and antagonist activity as well as scores representing non-receptor mediated effects. Model scores are combined with a measure of relative efficacy and cytotoxicity-related assay activity. These results indicate whether the activity of a chemical is most likely ER mediated, or related to either assay- or technology-specific assay interference. Model results demonstrated that the method works well for a set of reference chemicals by correctly identifying agonist, antagonist and inactive compounds with high sensitivity and specificity. The model agonist score [AUC(agonist)] is also correlated with the expected potency class of the active reference chemicals.
Additionally, this study allowed us to probe mechanisms behind assay interference. The existence of this phenomenon is well known in the pharmaceutical industry, and some models to identify interfering chemicals are available (Baell and Holloway, 2010; Bruns and Watson, 2012). However, we believe that the types of interference one sees may indicate important aspects of the underlying biology triggered by these chemicals, although typically only at high concentrations. We have demonstrated here that a fraction of pseudoreceptor activity is associated with cytotoxicity, but the phenomenon of cytotoxicity is not uniform. In particular, Figure 7 shows that the chemicals with lower support for activity against any of the receptors or pseudoreceptors (as measured by AUC values) are the ones most likely to have assay activity occurring only in the cytotoxicity region. In the ToxCast assay portfolio, a total of 35 cytotoxicity assays are run in multiple cell types (cell lines and primary cells), and different types of readouts (primarily measuring decrease in viable cell count, ATP levels or decrease in rate of cell proliferation). We observed (data not shown) that many chemicals will trigger only one class of the cytotoxicity assays in the cell-stress/cytotoxicity region (eg, only the cell-line-based assays, or only the reduced proliferation assays), indicating the potential for a specific mechanism for cytotoxicity. The ToxCast assay portfolio also contains a collection of cell stress assays (eg, oxidative stress, endoplasmic reticulum stress, mitochondrial disruption). We are currently studying how to combine patterns of assay interference, cell stress and cytotoxicity with the aim of better understanding how chemicals perturb cells at high concentrations. Understanding these effects may also help interpret the results of typical high-dose animal toxicity studies as many of these effects are dose-dependent.
The goal of this model is to identify potential estrogen-related hazards, ie, to determine whether a chemical is likely to interact with the ER. Equally important to carrying out a full risk assessment are the need to understand exposure (to single chemicals or mixtures), pharmacokinetics, in vivo adaptation, etc. To this end, we are also developing high-throughput quantitative estimations of pharmacokinetics (Rotroff et al., 2010; Thomas et al., 2013; Wetmore et al., 2012, 2013; Wambaugh et al., 2015) and chemical exposure (Wambaugh et al., 2013, 2014). In combination, these will provide the capability to develop risk-based priorities for targeted testing within the framework of high-throughput risk assessment (Judson et al., 2011).
In parallel, we are have also performed a direct comparison of the current model with data from guideline uterotrophic studies (Kleinstreuer et al., forthcoming) (Browne et al., 2015). The result of this comparison is that the current ER model results are predictive of in vivo uterotrophic assay results. In particular, for chemicals run in at least 2 uterotrophic, guideline-like studies, the sensitivity and specificity of the ER model were 97% and 89%, respectively, once ER-model-ambiguous results were excluded, ie, chemicals with 0.01 < AUC(agonist) < 0.1. If all guideline-like uterotrophic data from the literature is included (incorporating chemicals for which only a single assay was run), the sensitivity and specificity drop to 89% and 80%, respectively. These values need to be compared with the observed discrepancies between guideline-like uterotrophic assays run for the same chemical in different laboratories. Kleinstreuer et al. documented that 26% of chemicals had discrepant results, ie, at least 1 positive and 1 negative result. So in summary, we believe that the agonist model results can serve as a reliable indicator of ER activity both in vitro and in vivo, with sensitivity and specificity comparable to that provided by the guideline uterotrophic assay. Chemicals with AUC(agonist) ≥ 0.1 are likely in vivo active; those with AUC(agonist) < 0.01 are likely in vivo inactive; and those in the intermediate region are ambiguous, and may require further testing to make a definitive call. The agonist and antagonist AUC scores, in addition to all assay data, are available at the EDSP21 dashboard: http://epa.gov/ncct/toxcast/data.html and http://actor.epa.gov/edsp21.
In addition, the method described here is general enough to apply to any pathway for which multiple assays are available that probe different points in a pathway using multiple technologies. We currently have equivalent data sets to the one described here for the androgen receptor, steroidogenesis, and the peroxisome proliferator activating receptor (PPAR) pathways. We are also adding physicochemical properties and other structural features to try and develop rules to be used in designing safer alternatives to currently widely used chemicals. The ER context is helpful in this broad area because we can better assess what is true receptor-mediated activity as opposed to assay interference. We can likely apply assay interference information for specific chemicals derived from this ER study to the behavior of those chemicals in other pathways, for which we do not have this large assay coverage.
SUPPLEMENTARY DATA
Supplementary data are available online at http://toxsci.oxfordjournals.org/.
FUNDING
The authors gratefully acknowledge the American Institute of Mathematics and National Science Foundation for support of this research through the “Modeling Problems Related to Our Environment” workshop held January 14-18, 2013 in Palo Alto, California. All other funding was provided by the U.S. EPA.
Supplementary Material
REFERENCES
- Akaike H. (1998). Information Theory and an Extension of the Maximum Liklihood Principle. Springer, New York, NY. [Google Scholar]
- Auld D. S., Thorne N., Nguyen D. T., Inglese J. (2008). A specific mechanism for nonspecific activation in reporter-gene assays. ACS Chem. Biol. 3, 463–470. [DOI] [PMC free article] [PubMed] [Google Scholar]
- Baell J. B., Holloway G. A. (2010). New substructure filters for removal of pan assay interference compounds (PAINS) from screening libraries and for their exclusion in bioassays. J. Med. Chem. 53, 2719–2740. [DOI] [PubMed] [Google Scholar]
- Browne P., Judson R. S., Casey W. M., Kleinstreuer N. C., Thomas R. S. (2015). Screening chemicals for estrogen receptor bioactivity using a computational model. Environ Sci. Technol. 49, 8804–8814. [DOI] [PubMed] [Google Scholar]
- Bruns R. F., Watson I. A. (2012). Rules for identifying potentially reactive or promiscuous compounds. J. Med. Chem., 55, 9763–9772. [DOI] [PubMed] [Google Scholar]
- Chan W. K., Klock G., Bernard H. U. (1989). Progesterone and glucocorticoid response elements occur in the long control regions of several human papillomaviruses involved in anogenital neoplasia. J. Virol. 63, 3261–3269. [DOI] [PMC free article] [PubMed] [Google Scholar]
- Christian A. E., Haynes M. P., Phillips M. C., Rothblat G. H. (1997).Use of cyclodextrins for manipulating cellular cholesterol content. J. Lipid Res. 38, 2264–2272. [PubMed] [Google Scholar]
- Diel P., Olff S., Schmidt S., Michna H. (2001). Molecular identification of potential selective estrogen receptor modulator (SERM) like properties of phytoestrogens in the human breast cancer cell line MCF-7. Planta Med. 67, 510–514. [DOI] [PubMed] [Google Scholar]
- Dix D. J., Houck K. A., Martin M. T., Richard A. M., Setzer R. W., Kavlock R. J. (2007). The ToxCast program for prioritizing toxicity testing of environmental chemicals. Toxicol. Sci. 95, 5–12. [DOI] [PubMed] [Google Scholar]
- Dutertre M., Smith C. L. (2000). Molecular mechanisms of selective estrogen receptor modulator (SERM) action. J. Pharmacol. Exp. Ther. 295, 431–437. [PubMed] [Google Scholar]
- Gronemeyer H., Gustafsson J. A., Laudet V. (2004). Principles for modulation of the nuclear receptor superfamily. Nat. Rev. Drug. Discov. 3, 950–964. [DOI] [PubMed] [Google Scholar]
- Higa-Nishiyama A., Takahashi-Ando N., Shimizu T., Kudo T., Yamaguchi I., Kimura M. (2005). A model transgenic cereal plant with detoxification activity for the estrogenic mycotoxin zearalenone. Transgenic Res. 14, 713–717. [DOI] [PubMed] [Google Scholar]
- Hoerl A. E., Kennard R. W. (1970). Ridge regression: biased estimation for nonorthogonal problems. Technometrics 12, 55–67. [Google Scholar]
- Hsieh J. H., Sedykh A., Huang R., Xia M., Tice R. R. (2015). A data analysis pipeline accounting for artifacts in Tox21 quantitative high-throughput screening assays. J. Biomol. Screen 20, 887–897. [DOI] [PMC free article] [PubMed] [Google Scholar]
- Huang R., Sakamuru S., Martin M. T., Reif D. M., Judson R. S., Houck K. A., Casey W., Hsieh J. H., Shockley K. R., Ceger P., et al. (2014). Profiling of the Tox21 10K compound library for agonists and antagonists of the estrogen receptor alpha signaling pathway. Sci. Rep. 4: 5664. [DOI] [PMC free article] [PubMed] [Google Scholar]
- Ihaka R., Gentleman R. (1996). R: A language for data analysis and graphics. J.Comput. Graph. Stat. 5, 299–314. [Google Scholar]
- Inglese J., Johnson R. L., Simeonov A., Xia M., Zheng W., Austin C. P., Auld D. S. (2007). High-throughput screening assays for the identification of chemical probes. Nat. Chem. Biol. 3, 466–479. [DOI] [PubMed] [Google Scholar]
- Judson R. S., Houck K. A., Kavlock R. J., Knudsen T. B., Martin M. T., Mortensen H. M., Reif D. M., Rotroff D. M., Shah I., Richard A. M., et al. (2010). In vitro screening of environmental chemicals for targeted testing prioritization: the ToxCast project. Environ. Health Perspect. 118, 485–492. [DOI] [PMC free article] [PubMed] [Google Scholar]
- Judson R. S., Kavlock R. J., Setzer R. W., Cohen Hubal E. A., Martin M. T., Knudsen T. B., Houck K. A., Thomas R. S., Wetmore B. A., Dix D. J. (2011). Estimating toxicity-related biological pathway altering doses for high-throughput chemical risk assessment. Chem. Res. Toxicol. 24, 451–462. [DOI] [PubMed] [Google Scholar]
- Katzenellenbogen B. S., Choi I., Delage-Mourroux R., Ediger T. R., Martini P. G., Montano M., Sun J., Weis K., Katzenellenbogen J. A. (2000a). Molecular mechanisms of estrogen action: selective ligands and receptor pharmacology. J. Steroid Biochem. Mol. Biol. 74, 279–285. [DOI] [PubMed] [Google Scholar]
- Katzenellenbogen B. S., Katzenellenbogen J. A. (2000). Estrogen receptor transcription and transactivation: Estrogen receptor alpha and estrogen receptor beta: regulation by selective estrogen receptor modulators and importance in breast cancer. Breast Cancer Res. 2, 335–344. [DOI] [PMC free article] [PubMed] [Google Scholar]
- Katzenellenbogen B. S., Montano M. M., Ediger T. R., Sun J., Ekena K., Lazennec G., Martini P. G., McInerney E. M., Delage-Mourroux R., Weis K., Katzenellenbogen J. A. (2000b). Estrogen receptors: selective ligands, partners, and distinctive pharmacology. Recent Prog. Horm. Res. 55, 163–193; discussion 194–165. [PubMed] [Google Scholar]
- Kavlock R., Chandler K., Houck K., Hunter S., Judson R., Kleinstreuer N., Knudsen T., Martin M., Padilla S., Reif D., et al. (2012). Update on EPA's ToxCast program: providing high throughput decision support tools for chemical risk management. Chem Res. Toxicol. 25, 1287–1302. [DOI] [PubMed] [Google Scholar]
- Kleinstreuer N. C., Ceger P., Allen D., Strickland J., Xiaoqing C., Hamm J., Casey W. (forthcoming). A Curated Database of Rodent Uterotrophic Bioactivity. Env. Health Perspectives DOI: 10.1289/ehp.1510183. [DOI] [PMC free article] [PubMed] [Google Scholar]
- Knudsen T. B., Houck K. A., Sipes N. S., Singh A. V., Judson R. S., Martin M. T., Weissman A., Kleinstreuer N. C., Mortensen H. M., Reif D. M., et al. (2011). Activity profiles of 309 ToxCast chemicals evaluated across 292 biochemical targets. Toxicology 282, 1–15. [DOI] [PubMed] [Google Scholar]
- Le Guevel R., Pakdel F. (2001). Assessment of oestrogenic potency of chemicals used as growth promoter by in-vitro methods. Hum. Reprod. 16, 1030–1036. [DOI] [PubMed] [Google Scholar]
- Mangelsdorf D. J., Thummel C., Beato M., Herrlich P., Schutz G., Umesono K., Blumberg B., Kastner P., Mark M., Chambon P., et al. (1995). The nuclear receptor superfamily: the second decade. Cell 83, 835–839. [DOI] [PMC free article] [PubMed] [Google Scholar]
- Martin M. T., Dix D. J., Judson R. S., Kavlock R. J., Reif D. M., Richard A. M., Rotroff D. M., Romanov S., Medvedev A., Poltoratskaya N., et al. (2010). Impact of environmental chemicals on key transcription regulators and correlation to toxicity end points within EPA's ToxCast program. Chem. Res. Toxicol. 23, 578–590. [DOI] [PubMed] [Google Scholar]
- Miller J. R., Thanabal V., Melnick M. M., Lall M., Donovan C., Sarver R. W., Lee D. Y., Ohren J., Emerson D. (2010). The use of biochemical and biophysical tools for triage of high-throughput screening hits - A case study with Escherichia coli phosphopantetheine adenylyltransferase. Chem. Biol. Drug Des. 75, 444–454. [DOI] [PubMed] [Google Scholar]
- Miller K. P., Gupta R. K., Flaws J. A. (2006). Methoxychlor metabolites may cause ovarian toxicity through estrogen-regulated pathways. Toxicol. Sci. 93, 180–188. [DOI] [PubMed] [Google Scholar]
- Nagel S. C., Hagelbarger J. L., McDonnell D. P. (2001). Development of an ER action indicator mouse for the study of estrogens, selective ER modulators (SERMs), and xenobiotics. Endocrinology 142, 4721–4728. [DOI] [PubMed] [Google Scholar]
- OECD. (2012). OECD Test No. 457: BG1Luc Estrogen Receptor Transactivation Test Method for Identifying Estrogen Receptor Agonists and Antagonists 2012. [Google Scholar]
- Reif D. M., Martin M. T., Tan S. W., Houck K. A., Judson R. S., Richard A. M., Knudsen T. B., Dix D. J., Kavlock R. J. (2010). Endocrine profiling and prioritization of environmental chemicals using ToxCast data. Environ. Health Perspect. 118, 1714–1720. [DOI] [PMC free article] [PubMed] [Google Scholar]
- Rotroff D. M., Dix D. J., Houck K. A., Kavlock R. J., Knudsen T. B., Martin M. T., Reif D. M., Richard A. M., Sipes N. S., Abassi Y. A., et al. (2013). Real-time growth kinetics measuring hormone mimicry for toxcast chemicals in T-47D human ductal carcinoma cells. Chem. Res. Toxicol. 26, 1097–1107. [DOI] [PubMed] [Google Scholar]
- Rotroff D. M., Martin M. T., Dix D. J., Filer D. L., Houck K. A., Knudsen T. B., Sipes N. S., Reif D. M., Xia M., Huang R., et al. (2014). Predictive endocrine testing in the 21st century using in vitro assays of estrogen receptor signaling responses. Environ. Sci. Technol. 48, 8706–8716. [DOI] [PubMed] [Google Scholar]
- Rotroff D. M., Wetmore B. A., Dix D. J., Ferguson S. S., Clewell H. J., Houck K. A., Lecluyse E. L., Andersen M. E., Judson R. S., Smith C. M., et al. (2010). Incorporating human dosimetry and exposure into high-throughput in vitro toxicity screening. Toxicol. Sci. 117, 348–358. [DOI] [PMC free article] [PubMed] [Google Scholar]
- Sipes N. S., Martin M. T., Kothiya P., Reif D. M., Judson R. S., Richard A. M., Houck K. A., Dix D. J., Kavlock R. J., Knudsen T. B. (2013). Profiling 976 ToxCast chemicals across 331 enzymatic and receptor signaling assays. Chem. Res. Toxicol. 26, 878–895. [DOI] [PMC free article] [PubMed] [Google Scholar]
- Stossi F., Bolt M. J., Ashcroft F. J., Lamerdin J. E., Melnick J. S., Powell R. T., Dandekar R. D., Mancini M. G., Walker C. L., Westwick J. K., et al. (2014). Defining estrogenic mechanisms of bisphenol A analogs through high throughput microscopy-based contextual assays. Chem. Biol. 21, 743–753. [DOI] [PMC free article] [PubMed] [Google Scholar]
- Thomas R. S., Philbert M. A., Auerbach S. S., Wetmore B. A., Devito M. J., Cote I., Rowlands J. C., Whelan M. P., Hays S. M., Andersen M. E., et al. (2013). Incorporating new technologies into toxicity testing and risk assessment: moving from 21st century vision to a data-driven framework. Toxicol. Sci. 136, 4–18. [DOI] [PMC free article] [PubMed] [Google Scholar]
- Thorne N., Auld D. S., Inglese J. (2010). Apparent activity in high-throughput screening: origins of compound-dependent assay interference. Curr. Opin. Chem. Biol. 14, 315–324. [DOI] [PMC free article] [PubMed] [Google Scholar]
- Tibshirani R. (1996). Regression shrinkage and selection via the Lasso. J. Roy. Statis. Soc. Series B Method. 58, 267–288. [Google Scholar]
- Wambaugh J. F., Setzer R. W., Reif D. M., Gangwal S., Mitchell-Blackwood J., Arnot J. A., Joliet O., Frame A., Rabinowitz J., Knudsen T. B., et al. (2013). High-throughput models for exposure-based chemical prioritization in the ExpoCast project. Environ. Sci. Technol. 47, 8479–8488. [DOI] [PubMed] [Google Scholar]
- Wambaugh J. F., Wang A., Dionisio K. L., Frame A., Egeghy P., Judson R., Setzer R. W. (2014). High throughput heuristics for prioritizing human exposure to environmental chemicals. Environ. Sci. Technol. 48, 12760–12767. [DOI] [PubMed] [Google Scholar]
- Wambaugh J. F., Wetmore B. A., Pearce R., Strope C., Goldsmith R., Sluka J. P., Sedykh A., Tropsha A., Bosgra S., Shah I., et al. (2015). Toxicokinetic triage for environmental chemicals. Toxicol. Sci. [DOI] [PMC free article] [PubMed] [Google Scholar]
- Wetmore B. A., Wambaugh J. F., Ferguson S. S., Li L., Clewell 3rd, H. J., Judson R. S., Freeman K., Bao W., Sochaski M. A., Chu T. M., et al. (2013). Relative impact of incorporating pharmacokinetics on predicting in vivo hazard and mode of action from high-throughput in vitro toxicity assays. Toxicol. Sci. 132, 327–346. [DOI] [PubMed] [Google Scholar]
- Wetmore B. A., Wambaugh J. F., Ferguson S. S., Sochaski M. A., Rotroff D. M., Freeman K., Clewell H. J., 3rd, Dix D. J., Andersen M. E., Houck K. A., et al. (2012). Integration of dosimetry, exposure, and high-throughput screening data in chemical toxicity assessment. Toxicol. Sci. 125, 157–174. [DOI] [PubMed] [Google Scholar]
- Wishart D. S., Knox C., Guo A. C., Cheng D., Shrivastava S., Tzur D., Gautam B., Hassanali M. (2008). “DrugBank: a knowledgebase for drugs, drug actions and drug targets. Nucleic Acids Res. 36(Database issue): D901–D906. [DOI] [PMC free article] [PubMed] [Google Scholar]
Associated Data
This section collects any data citations, data availability statements, or supplementary materials included in this article.