

Abstract
Objectives.
To determine the extent to which genetic and environmental factors contribute to individual and gender differences in aging of functional ability.
Method.
Twenty assessments of functional ability are collected as part of the longitudinal Swedish Adoption/Twin Study of Aging from 859 twins aged 50–88 at the first wave. Participants completed up to 6 assessments covering a 19-year period. Factor analysis was used to create 3 factors: flexibility, fine motor skills, and balance.
Results.
Latent growth curve analysis demonstrated increasing disability and variability after age 70. For flexibility, results indicated significant sex differences in mean change trajectories but no sex differences in components of variance. No sex differences were found for fine motor movement. For balance, there were no sex differences in mean change trajectories; however, there was significant genetic variance for changes in balance in women after age 70 but not for men.
Discussion.
Although idiosyncratic environmental influences account for a large part of increasing variance, correlated and shared rearing environmental effects were also evident. Thus, both microenvironmental (individual) and macroenvironmental (family and cultural) effects, as well as genetic factors, affect maintenance of functional ability in late adulthood.
Key Words: Aging, Behavior genetics, Functional ability, Longitudinal, Sex differences, Twins
Quality of life in late adulthood is a function of physical, emotional, and intellectual health, and maintenance of functional ability is central to sustaining independent living. It is of paramount importance, therefore, both to assess functional ability accurately and to understand the sources of individual differences in functional ability. Functional ability is most often assessed via self-report of activities of daily living (ADL). Although the ability to manage dressing, eating, walking, toileting, and hygiene is clearly necessary for independent living, evidence suggests that self-reported ADL can reflect affect and personality as well as functional ability (Jagger et al., 2010). Objective measures of functional tasks such as walking, balance, and chair stands may provide a more accurate picture of an individual’s physical ability. Correlations between the two types of measures tend to be significant but modest, ranging from .17 to .54 (Ernsth-Bravell, Zarit, & Johansson, 2011; Farag et al., 2012). Therefore, even though objective measures of physical function are more time-consuming for investigators and more taxing for participants, investigating the nature and source of individual differences in these measures will enrich our understanding of one of the primary components of the aging process.
There are individual differences in rates of decline in physical function, and behavior genetic approaches provide a method for decomposing that variance into genetic and environmental sources. To date, however, behavior genetic investigations of functional ability have produced mixed results (Christensen, Fredriksen, Vaupel, & McGue, 2003; Christensen, Gaist, Vaupel, & McGue, 2002; Finkel, Pedersen, & Harris, 2000; Finkel et al., 2003). Overall, the behavior genetic data suggest gender and age differences in genetic influences on physical functioning. Study differences in estimates of genetic influences on functional ability may result from differences in measurement and approach.
The primary goal of the current analysis was to attempt to resolve some of these discrepancies by optimizing the measurement and statistical approaches using data from the Swedish Adoption/Twin Study of Aging (SATSA). First, treating functional ability as a single entity or factor likely masks distinctions between, for example, upper-body function and lower-body function. A recent analysis of various measures of functional ability identified three factors: balance, upper dexterity, and upper strength and flexibility (Ernsth-Bravell et al., 2011). More fine-grained analyses of components of functional ability may provide both more agreement across studies and a deeper understanding of the aging process. Therefore, the current analyses focus on three functional ability factors instead of a single principal component. Second, given the sex differences evident in both mean performance and genetic and environmental components of variance (Christensen et al., 2003, 2002), the current analyses examine sex differences in genetic and environmental contributions to changes in functional ability with age. Finally, data from six waves of measurement covering up to 19 years are now available from SATSA, providing more power to examine genetic and environmental influences on change in functional ability with age.
Method
Participants
Accrual procedures for SATSA have been described previously (Finkel & Pedersen, 2004). The sample is a subset of twins from the population-based Swedish Twin Registry, comprised all reared apart twin pairs and a sample of twins reared together matched on the basis of gender and date and county of birth. In-person testing (IPT1) took place in a location convenient to the participants, such as district nurses’ offices, health care schools, and long-term care clinics. Testing was completed during a single 4-hr visit. Age range at IPT1 was 50–88 years. The second (IPT2) and third (IPT3) waves of IPT occurred at 3-year intervals. IPT did not occur during Wave 4; therefore, the next wave of IPT is labeled IPT5 and occurred after a 7-year interval. Regular 3-year testing continued after IPT5; therefore, the total time span from IPT1 to IPT7 was 19 years.
In total, 859 individuals had function ability data available from at least one testing occasion; 60% of them were women. Mean number of waves of participation was 3.68 (SD = 1.6) for men and 3.70 (SD = 1.7) for women, and 79% of men and 75% of women in the current sample participated in at least three waves of data collection; sex differences in participation were not statistically significant. Rates of missing data at any IPT were low (at most 2%) and did not differ for men and women. Table 1 presents descriptive information for each IPT. Four types of twins participate in SATSA: monozygotic twins reared apart (MZA), monozygotic twins reared together (MZT), dizygotic twins reared apart (DZA), and dizygotic twins reared together (DZT). Number of twin pairs participating at each IPT is indicated in Table 1; data from both complete and incomplete pairs were used in the analyses to maximize power.
Table 1.
Sample Characteristics
| Wave | N | N pairs | Age | Flexibility | Fine motor | Balance |
|---|---|---|---|---|---|---|
| Mean (SD) | Mean (SD) | Mean (SD) | Mean (SD) | |||
| IPT1: men | 247 | 22/24/32/41 | 65.1 (7.7) | 2.0 (0.2) | 8.6 (1.4) | 10.6 (1.9) |
| IPT1: women | 396 | 26/40/70/50 | 65.9 (8.9) | 2.0 (0.2) | 8.7 (1.5) | 11.0 (2.3) |
| IPT2: men | 247 | 16/26/31/37 | 65.0 (8.5) | 2.1 (0.4) | 8.5 (1.3) | 10.4 (1.4) |
| IPT2: women | 346 | 17/31/63/42 | 66.7 (9.3) | 2.2 (0.6) | 8.6 (1.2) | 10.9 (2.7) |
| IPT3: men | 234 | 15/19/30/38 | 67.2 (8.4) | 2.2 (0.4) | 8.6 (1.4) | 10.8 (1.5) |
| IPT3: women | 335 | 15/33/57/36 | 69.9 (9.5) | 2.3 (0.6) | 8.7 (1.2) | 11.1 (2.5) |
| IPT5: men | 213 | 10/21/27/27 | 68.9 (9.2) | 2.2 (0.6) | 8.8 (1.9) | 11.3 (3.1) |
| IPT5: women | 328 | 19/28/50/25 | 71.7 (10.3) | 2.4 (0.9) | 9.2 (2.8) | 12.0 (4.1) |
| IPT6: men | 181 | 10/15/20/20 | 71.0 (8.9) | 2.2 (0.5) | 9.1 (1.5) | 11.5 (3.1) |
| IPT6: women | 264 | 15/20/37/21 | 73.0 (9.5) | 2.4 (0.8) | 9.5 (2.6) | 11.9 (3.4) |
| IPT7: men | 155 | 8/13/15/19 | 73.1 (8.7) | 2.4 (0.8) | 9.8 (3.3) | 12.1 (4.2) |
| IPT7: women | 222 | 10/17/28/18 | 75.2 (9.0) | 2.5 (0.9) | 9.8 (3.4) | 12.5 (4.2) |
Notes. IPT = in-person testing. N pairs indicates number of monozygotic reared apart/monozygotic reared together/dizygotic reared apart/dizygotic reared together twin pairs.
Measures
Twenty-four measures of functional ability were collected at each IPT. Although the functional ability tasks were timed, analyses indicated that nurse ratings of successful performance (1 = no difficulty, 2 = some difficulty, 3 = impossible) were more sensitive to subtle changes with age. In a sample aged 70 and older, test–retest reliability and interrater agreement on similar measures of functional ability were strong (Holbein-Jenny, Billek-Sawhney, Beckman, & Smith, 2005). Data reduction for the functional ability measures has been described previously (Ernsth-Bravell, Finkel, Dahl, & Pedersen, in press). In brief, 20 functional ability measures were used to generate three factors with consistent factor loadings across IPT and age. The remaining four measures did not load consistently on any factor. The flexibility factor included two items: touch left earlobe with right hand behind the head and touch right earlobe with left hand behind the head. The fine motor movement factor included eight measures of function ability: pour water from a jug into a glass, pour water from one hand to the other (dominant hand), pour water from one hand to the other (nondominant hand), insert key into lock and turn, insert electrical plug into socket, screw in a light bulb, put coins in a coin slot, and dial the numbers one through nine on a rotary phone. Finally, the balance factor included 10 measures of function ability and can also be considered a measure of gross motor function: walk and turn 3 m, single chair stand, five chair stands, standing balance with feet side-by-side for up to 10 s, standing balance with feet together and arms extended for up to 10 s, lift a glass, lift a 1kg packet, pick up a pen from the floor from a standing position, touch right fingers to left toes while seated, and touch left fingers to right toes while seated. The three factors are significantly but modestly correlated: balance correlates .29 with fine motor and .24 with flexibility and the correlation between fine motor and flexibility is .17. Descriptive statistics for the three functional ability factors at each IPT are presented separately for men and women in Table 1; higher scores indicate higher levels of disability. Most adults perform fairly well on tasks of functional ability in young-old age; therefore, the standard deviations for the three factors are quite small at IPT1 and increase significantly in later IPTs. Because of the skew in the data, the factors were rank normalized to support biometric model fitting.
Statistical Method
Due to the range in age at each IPT (up to 40 years), an age-based biometric latent growth curve model (LGCM) was used to examine genetic and environmental contributions to age changes in functional ability (Neale & McArdle, 2000). The LGCM provides estimation of fixed effects, that is, fixed population parameters as estimated by the average growth model of the entire sample, and random effects, that is, individual variation in growth model parameters. Because of the age trends in mean and variance in functional ability, a two-slope LGCM was used (Finkel et al., 2003): one slope before age 70 and a separate slope after age 70. Model fitting indicated that centering at age 70 provided the best fit to the data. Thus, the intercept is evaluated at the inflection point: age 70. The age-based LGCM is presented in Figure 1. The paths from the latent slope factors to the observed scores are the age basis coefficients, B1(t) and B2(t). The age basis serves as a marker for the age of the participant at each time of measurement, adjusted for the centering age. A practice effect (P) is included in the model to reflect the novelty of some of the functional ability tasks, which may be easier to comprehend at the second wave of participation.
Figure 1.
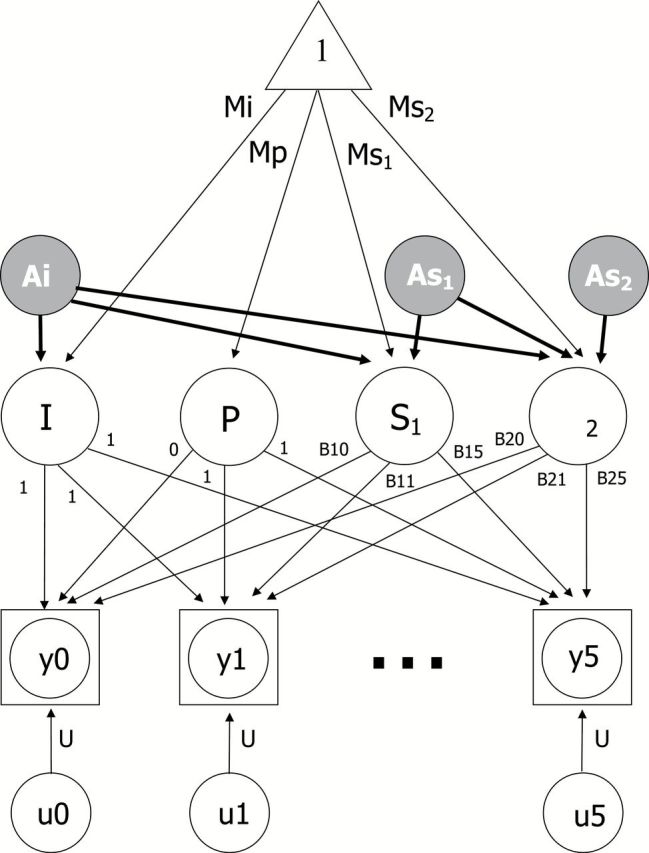
Biometric latent growth curve model. Observed data are denoted by the squared circles y0 through Y5; indicating that up to 2% of participants may have missing data. The paths from the latent slopes to the observed scores are the age basis coefficients, B1(t) and B2(t), which define the intervals of change over age. Mi = mean intercept; Mp = mean practice; Ms1 = mean slope before age 70; Ms2 = mean slope after age 70; u0 through U5 indicate random error. Biometric decomposition of variance around the intercept (I) and slopes (S1 and S2) is indicated by additive genetic influences on intercept (Ai), slope 1 (As1), and slope 2 (As2). Genetic influences on correlations among intercepts and slopes are captured by the paths from Ai to As1 and As2 and from As1 to As2. Shared rearing environment, correlated environment, and nonshared environment were also included in the model but are not pictured here.
Using twin data, the random effects, or variance, in latent growth curve parameters can be divided into four separate components: additive genetic effects (A), correlated environmental effects shared by anyone living in the same culture (C), shared rearing environmental effects shared only by twins who grew up in the same home (S), and nonshared environmental effects unique to each individual and error associated with age-specific residuals (E). For simplicity, the model in Figure 1 includes only the additive genetic effects for the intercept (Ai) and slopes (As1 and As2). Genetic influences on correlations among intercepts and slopes are captured by the paths from Ai to S1 and S2 and from As1 to S2. In total, then, there are six genetic parameters (paths) estimated by the model. Shared rearing environment, correlated environment, and nonshared environment were also included in the model, for a total of 24 biometric parameters.
By fitting structural models to the observed MZA, MZT, DZA, and DZT covariance matrices, we can estimate the proportion of phenotypic variance accounted for by the variance in genetic factors, shared environment factors, correlated environment factors, and nonshared environment factors. Biometric LGCMs were fit with the structural equation modeling program Mx version 1.66b (Neale, Boker, Xie, & Maes, 2003). The raw maximum likelihood estimation procedure was used throughout. We tested sex differences in model parameters using a difference chi-square test (i.e., subtracting the −2 log likelihoods of the models being compared).
Results
Latent Growth Curve Models
Model fitting occurred in three stages and the results of model comparisons for all three functional ability factors are presented in Table 2. First, we tested the full model (Model 1) and the effect of equating all model parameters across sex (Model 2), equating only the four LGCM mean parameter estimates across sex (Model 3), and equating only the 24 biometric variance components across sex (Model 4). A model is considered to provide an acceptable fit to the data when the ratio of the log likelihood to the degrees of freedom (−2LL/df) is less than or equal to 2.5; a ratio of 2 or less indicates a close fit (Loehlin, 1987). The ratios for the flexibility, fine motor, and balance are 1.72, 2.28, and 2.09, respectively. Examining the reduced Models 2 through 4, significant changes in goodness of fit were found only for flexibility, indicating significant sex differences in the LGCM parameters (change in model fit = 17, df = 4, p < .01).
Table 2.
Model Fitting Results
| Model | Flexibility | Fine motor | Balance |
|---|---|---|---|
| −2LL (df) | −2LL (df) | −2LL (df) | |
| Initial model testing | |||
| 1. Full model | 5,248 (3,057) | 6,870 (3,018) | 6,172 (2,951) |
| 2. Equate all across sex | 5,294 (3,085)* | 6,882 (3,046) | 6,202 (2,979) |
| 3. Equate LGCM across sex | 5,265 (3,061)** | 6,873 (3,022) | 6,177 (2,955) |
| 4. Equate biometric across sex | 5,280 (3,081) | 6,879 (3,042) | 6,199 (2,975) |
| Follow-up testing of LGCM | |||
| 5. Equate I across sex | 5,253 (3,058)* | 6,870 (3,019) | 6,174 (2,952) |
| 6. Equate P across sex | 5,258 (3,058)** | 6,871 (3,019) | 6,173 (2,952) |
| 7. Equate S1 across sex | 5,253 (3,058)* | 6,872 (3,019) | 6,174 (2,952) |
| 8. Equate S2 across sex | 5,252 (3,058)* | 6,871 (3,019) | 6,178 (2,952) |
| Follow-up testing of biometric | |||
| 9. Equate all A across sex | 5,249 (3,063) | 6,873 (3,024) | 6,220 (2,957)** |
| 10. Drop all A for women | 5,248 (3,063) | 6,870 (3,024) | 6,185 (2,957)* |
| 11. Drop all A for men | 5,248 (3,063) | 6,872 (3,024) | 6,172 (2,957) |
Notes. LGCM = latent growth curve model.
*Difference in model fit vs Model 1 is significant at p < .05.
**Difference in model fit vs Model 1 is significant at p < .01.
Thus, in the second stage of model fitting, sex differences in LGCM mean parameter estimates were investigated one at a time: mean intercept (Model 5), mean practice (Model 6), mean slope 1 (Model 7), and mean slope 2 (Model 8) were set equal across sex in independent models; results are reported in Table 2. As expected from the first stage of model fitting, sex differences in LGCM parameters were found only for flexibility. Moreover, significant sex differences were indicated for all four parameters. The intercept and practice effects were smaller in men than in women; slope 1 was smaller in women, but slope 2 was smaller in men. Mean change trajectories estimated separately for men and women by the LGCM for all three functional ability factors are presented in Figure 2. To allow for comparison across factors, the trajectories are reported as percent of maximum observed disability. The significant sex differences for mean trajectories in flexibility are readily apparent: men demonstrate a fairly consistent but modest increase in disability both before and after age 70. In contrast, women show little change in ability before age 70 but significantly increasing disability after age 70. Mean trajectories of change in the fine motor and balance factors are the same for men and women. Of the three functional ability factors, balance exhibits the fastest rate of increasing disability after age 70.
Figure 2.

Longitudinal change trajectories in mean performance on the three factors for men and women.
Biometric Analyses
The third stage of model fitting focused on sex differences in genetic influences on functional ability. Although Model 4 did not result in a significant reduction in model fit for any of the functional ability factors, testing 24 variance components at the same time can mask significant differences in individual parameters. Therefore, three additional models were fit to the data focusing on possible sex differences in genetic influences on functional ability: equating all additive genetic variance parameters across sex (Model 9), setting all additive genetic variance parameters equal to zero for women (Model 10), and setting all additive genetic variance parameters equal to zero for men (Model 11); each model involved reducing the number of estimated parameters by six. As reported in Table 2, model comparisons indicated significant sex differences in genetic influences on the balance factor. Thus, genetic factors play a significant role in individual differences in change with age only for the balance factor and only in women.
Information about all 28 parameters from the biometric LGCM for men and women for all three functional ability factors is available from the first author. These parameters were used to develop representations of the longitudinal change in genetic and environmental components of variance flexibility with age, as presented in Figure 3. As expected from the descriptive statistics and the raw data, total variance is limited in young-old age and increases significantly after age 70. As expected from the biometric model fitting, little or no genetic variance is evident for either men or women. Notably, increases in shared rearing environmental variance make the largest contribution to increasing total variance.
Figure 3.
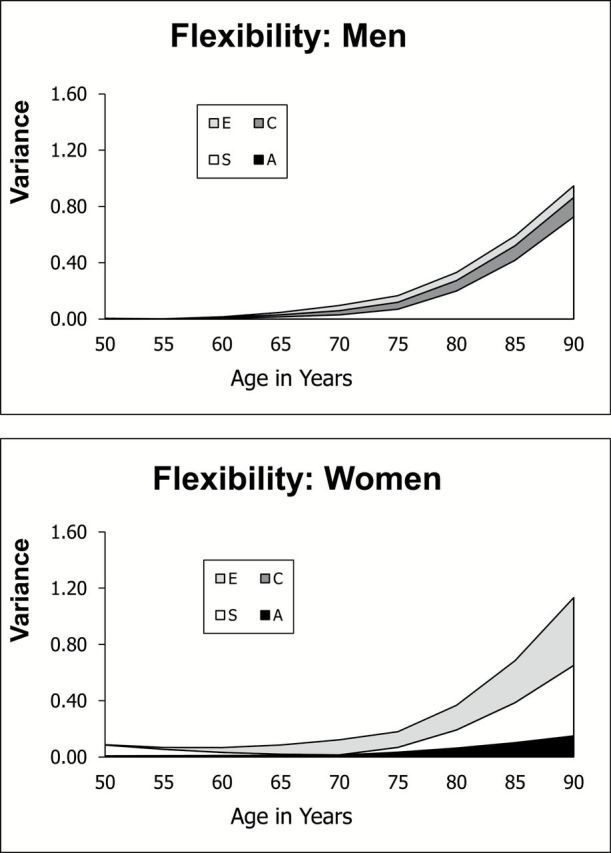
Change in variance components with age: flexibility.
Several distinctions between results for flexibility and fine motor are evident in a comparison of Figures 3 and 4. First, although total variance in fine motor increases after age 70, it does not increase to the same extent as flexibility. Second, there is stronger suggestion that genetic and correlated environmental variances contribute to the increasing total variance. Figure 4 also indicates modest genetic variance for all three LGCM parameters for both men and women. Although dropping genetic variance did not result in a significant reduction of fit (Models 10 and 11), dropping genetic variance from a reduced AE-only model (no C or S) did result in a marginally significant reduction in model fit (model change = 19, df = 12, p < .10). Results suggest a modest heritability of about 25% for intercept and slope for fine motor in both men and women, similar to reported heritability estimates for arthritis (Harney & Wordsworth, 2002).
Figure 4.
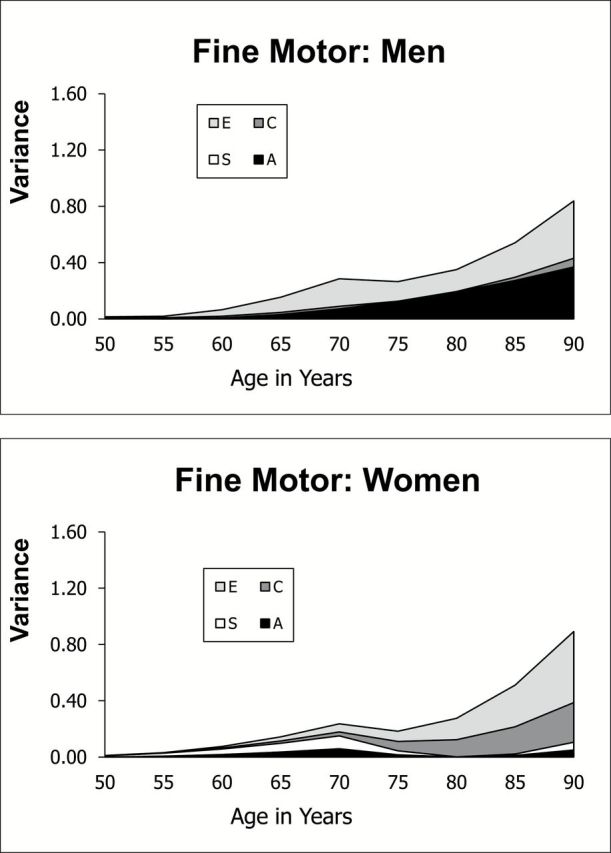
Change in variance components with age: fine motor movement.
Clearly significant sex differences in biometric parameters were indicated for balance, and these differences are evident in the age trends in genetic and environmental components of variance presented in Figure 5. Genetic variance is evident only for women, and this genetic variance increases after age 70. As a proportion of variance, however, standardized heritability estimates decrease from an average of 75% before age 70 to 55% after age 70. Heritability estimates for men are functionally zero before and after age 70. Nonshared and correlated environmental variances play a role for both men and women.
Figure 5.
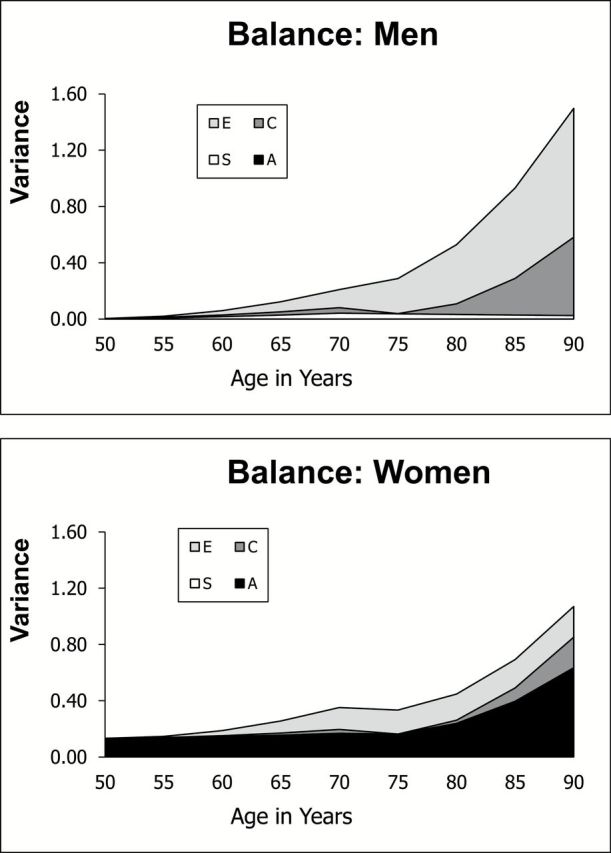
Change in variance components with age: balance.
Discussion
The current analyses focused on examining sex differences in mean longitudinal change and in genetic and environmental contributions to change with age in three functional ability factors: flexibility, fine motor movement, and balance. Two primary findings from the current analyses require elucidation. First, increasing variance in the functional ability factors resulted largely from increases in environmental components of variance, including correlated and shared rearing environmental variance. Second, a significant exception to that conclusion was found for the balance factor, which demonstrated significantly increasing genetic variance in women only.
It is not surprising that environmental factors play a large role in individual differences in mean performance and change in functional ability with age. Given the likely cumulative impact of occupation, leisure activities, health, and other exposures, we would predict significant environmental variance. We did not expect to find lingering effects of shared rearing environment in late adulthood nor the cultural and cohort level effects tapped by the correlated environment parameter. The SATSA sample includes twins born between 1900 and 1948; the life experiences of individuals born before World War I would be quite different from those born after World War II. Not only have we experienced a significant increase in the amount of leisure time for men and women in the 20th century (Aguiar & Hurst, 2006) but there has also been a change in the type of leisure activities. At the same time that occupations were shifting to more sedentary office work, physical exercise became a more popular leisure time activity (Ng & Popkin, 2013). In addition, generational shifts in expected gender roles mean that men in younger cohorts are more likely to participate in household tasks like cleaning and cooking (Larsson, 2006). Large cohort differences in occupational and leisure activity will appear as correlated environmental effects in the behavior genetic model: environmental effects shared by anyone living in the same culture in the same era. Furthermore, early rearing environmental expectations of participation in household chores or physical activity may establish patterns of behavior that affect continued functional ability in late adulthood. The fact that both shared and correlated environments contribute to increasing total variance in functional ability with age suggests that both microenvironmental (individual) and macroenvironmental (family and cohort) effects play a role in maintaining functional ability in late adulthood. Thus, both microenvironmental and macroenvironmental factors are candidates for interventions. Moreover, without intervention, the societal trend toward more sedentary occupations may result in increases in disability rates in the future (Lin, Beck, Finch, Hummer, & Master, 2012).
Sex differences in genetic and environmental contributions to general functional ability have been reported previously (Christensen et al., 2003, 2002), whereas the specific factor level of analysis of functioning used in the current study allowed us to isolate sex difference to the balance factor. Given the consistency across studies in finding sex differences in genetic and environmental influences on measures like the balance factor, uncovering an explanation for the difference is the next step. In general, women demonstrate slower aging trajectories on the majority of biological markers of the aging process, with the exception of measures that tap muscle strength or function (Weale, 2009). Women have less muscle mass to begin with and tend to lose muscle mass at a faster rate than men (Rantanen, Era, & Heikkinen, 1996). Moreover, women experience a higher prevalence of genetically influenced chronic disabling diseases compared with men’s more compressed history of disability before death (Sainio et al., 2006). Thus, fundamental biological differences between men and women may contribute to the finding of significant genetic variance for functional ability in women and not in men.
Differences in environmental factors will also contribute to sex differences in heritability. If access to aspects of the environment is constrained for one group by socially defined gender roles, then genetic factors will explain a greater portion of the remaining individual differences in that group. The men and women in these cohorts clearly experienced different occupational histories: more job opportunities were available to men, providing differential support for maintenance of functional ability. This differential access extends even to leisure time activities. A recent analysis found that older women participate in less leisure time physical activity (LTPA) than older men (Gardner & Montgomery, 2008). Indeed, when sex differences in LTPA were controlled, sex differences in functional ability were no longer significant. In these cohorts, then, sex differences in access to occupational and leisure activity that would support functional ability result in sex differences in heritability estimates for both mean performance and change over time in measures that focus on balance and gross motor function.
Limitations of these conclusions include many of the statistical assumptions common to structural equation models. The data are assumed to be missing at random, the sample is assumed to be relatively homogeneous, and structural relations based on interindividual variance and on intraindividual variance are assumed to be equivalent (Lövdén, Ghisletta, & Lindenberger, 2005). As the focus of the current analysis was on sex differences, it is important that patterns of participation and attrition did not differ significantly for men and women. As with any longitudinal sample, attrition occurred in the SATSA sample. Even though approximately 90% of the sample is maintained from one IPT to the next, there were only 128 complete twin pairs remaining at IPT7. However, using an age-based growth curve model instead of a time-based model allowed us to maximize power, especially for twin pairs with more participation waves. Finally, although measures of functional ability demonstrated marked positive skew, the use of rank normalized data and the two-slope growth curve model allowed us to address the issue.
In summary, increasing variance in measures of functional ability resulted from increases in unique, shared rearing, and cohort-related environmental factors. For the balance factor, however, increasing genetic variance was evident for women only. Sex differences in biological patterns of aging likely contribute to sex differences in genetic influences on changes in balance. Nevertheless, results for all three functional ability factors reflect the impact of differential historical experiences of the cohorts included in the current analyses.
Funding
The Swedish Adoption/Twin Study of Aging is supported by National Institute on Aging (AG04563, AG10175), the MacArthur Foundation Research Network on Successful Aging, the Swedish Council for Working Life and Social Research (FAS) (97:0147:1B, 2009-0795), and the Swedish Research Council (825-2007-7460, 825-2009-6141).
References
- Aguiar M., Hurst E. (2006). Measuring trends in leisure: The allocation of time over five decades. Research Review, 10–13. [Google Scholar]
- Christensen K., Fredriksen H., Vaupel J. W., McGue M. (2003). Age trajectories of genetic variance in physical functioning: A longitudinal study of Danish twins aged 70 years and older. Behavior Genetics, 33, 125–136. 10.1023/A:1022501817781 [DOI] [PubMed] [Google Scholar]
- Christensen K., Gaist D., Vaupel J. W., McGue M. (2002). Genetic contributions to rate of change in functional abilities among Danish twins aged 75 years or more. American Journal of Epidemiology, 155, 132–139. 10.1093/aje/155.2.132 [DOI] [PubMed] [Google Scholar]
- Ernsth-Bravell M., Finkel D., Dahl A. K., Pedersen N. L. (in press). The role of gender in the relationship between motor functioning and mortality. Age and Ageing.
- Ernsth-Bravell M., Zarit S. H., Johansson B. (2011). Self-reported activities of daily living and performance-based functional ability: A study of congruence in the oldest-old. European Journal of Ageing, 8, 199–209. 10.1007/s10433-011-0192-6 [DOI] [PMC free article] [PubMed] [Google Scholar]
- Farag I., Sherrington C., Kamper S. J., Ferreira M., Moseley A. M., Lord S. R., Cameron I. D. (2012). Measures of physical functioning after hip fracture: Construct validity and responsiveness of performance-based and self-reported measures Age & Ageing, 41, 659–664. 10.1093/ageing/afs090 [DOI] [PubMed] [Google Scholar]
- Finkel D., Pedersen N. L. (2004). Processing speed and longitudinal trajectories of change for cognitive abilities: The Swedish Adoption/Twin Study of Aging. Aging, Neuropsychology, and Cognition, 11, 325–345. 10.1080/13825580490511152 [Google Scholar]
- Finkel D., Pedersen N. L., Harris J. R. (2000). Genetic mediation of the associations among motor and perceptual speed and adult cognitive abilities. Aging, Neuropsychology, and Cognition, 7, 141–155. 10.1076/1382-5585(200009)7:3;1-Q;FT141 [Google Scholar]
- Finkel D., Pedersen N. L., Reynolds C. A., Berg S., de Faire U., Svartengren M. (2003). Genetic and environmental influences on decline in biobehavioral markers of aging. Behavior Genetics, 33, 107–123. 10.1023/A:1022549700943 [DOI] [PubMed] [Google Scholar]
- Gardner A. W., Montgomery P. S. (2008). Differences in exercise performance and leisure-time physical activity in older men and women. Clinical Medicine: Geriatrics, 2008, 9–15. [PMC free article] [PubMed] [Google Scholar]
- Harney S., Wordsworth B. P. (2002). Genetic epidemiology of rheumatoid arthritis. Tissue Antigens, 60, 465–473. 10.1034/j.1399-0039.2002.600601.x [DOI] [PubMed] [Google Scholar]
- Holbein-Jenny M. A., Billek-Sawhney B., Beckman E., Smith T. (2005). Balance in personal care home residents: A comparison of the Berg Balance Scale, the Multi-Directional Reach Test, and the Activities-Specific Balance Confidence Scale. Journal of Geriatric Physical Therapy (2001), 28, 48–53. [PubMed] [Google Scholar]
- Jagger C., Gillies C., Cambois E., Van Oyen H., Nusselder W., Robine J. M. (2010). The Global Activity Limitation Index measured function and disability similarly across European countries. Journal of Clinical Epidemiology, 63, 892–899. 10.1016/j.jclinepi.2009.11.002 [DOI] [PubMed] [Google Scholar]
- Larsson K. (2006). Care needs and home-help services for older people in Sweden: Does improved functioning account for the reduction in public care? Aging & Society, 26, 413–429. 10.1017/S0144686X05004496 [Google Scholar]
- Lin S.-F., Beck A. N., Finch B. K., Hummer R. A., Master R. K. (2012). Trends in US older adult disability: Exploring age, period, and cohort effects. American Journal of Public Health, 102, 2157–2162. 10.2105/AJPH.2011.300602 [DOI] [PMC free article] [PubMed] [Google Scholar]
- Loehlin J. C. (1987). Latent variable models: An introduction to factor, path, and structural analysis. Hillsdale, NJ: Erlbaum. [Google Scholar]
- Lövdén M., Ghisletta P., Lindenberger U. (2005). Social participation attenuates decline in perceptual speed in old and very old age. Psychology and Aging, 20, 423–434. 10.1037/0882-7974.20.3.423 [DOI] [PubMed] [Google Scholar]
- Neale M. C., Boker S. M., Xie G., Maes H. H. (2003). Mx: Statistical modeling (6th ed.). Richmond, VA: Department of Psychiatry. [Google Scholar]
- Neale M. C., McArdle J. J. (2000). Structure latent growth curves for twin data. Twin Research, 3, 165–177. 10.1375/136905200320565454 [DOI] [PubMed] [Google Scholar]
- Ng S. W., Popkin B. M. (2013). Time use and physical activity: A shift away from movement across the globe. Obesity Reviews, 13, 659–680. 10.1111/j.1467-789X.2011.00982.x [DOI] [PMC free article] [PubMed] [Google Scholar]
- Rantanen T., Era P., Heikkinen E. (1996). Maximal isometric knee extension strength and stair-mounting ability in 75- and 80-year-old men and women. Scandinavian Journal of Rehabilitation Medicine, 28, 89–93. PMID:8815993 [PubMed] [Google Scholar]
- Sainio P., Koskinen S., Heliövaara M., Martelin T., Härkänen T., Hurri H., Aromaa A. (2006). Self-reported and test-based mobility limitations in a representative sample of Finns aged 30+. Scandinavian Journal of Public Health, 34, 378–386. 10.1080/14034940500489859 [DOI] [PubMed] [Google Scholar]
- Weale R. (2009). Biomarkers by gender. Archives of Gerontology and Geriatrics, 49, 208–211. 10.1016/j.archger.2008.07.013 [DOI] [PubMed] [Google Scholar]