

Summary
Using information including variant physical and functional properties, we applied multiple variant prioritization techniques in 13 lung cancer genomic studies. We identified and validated novel regions highlighting the utility of using prioritization analyses to search for robust signals.
Abstract
Large-scale genome-wide association studies (GWAS) have likely uncovered all common variants at the GWAS significance level. Additional variants within the suggestive range (0.0001> P > 5×10⁻⁸) are, however, still of interest for identifying causal associations. This analysis aimed to apply novel variant prioritization approaches to identify additional lung cancer variants that may not reach the GWAS level. Effects were combined across studies with a total of 33456 controls and 6756 adenocarcinoma (AC; 13 studies), 5061 squamous cell carcinoma (SCC; 12 studies) and 2216 small cell lung cancer cases (9 studies). Based on prior information such as variant physical properties and functional significance, we applied stratified false discovery rates, hierarchical modeling and Bayesian false discovery probabilities for variant prioritization. We conducted a fine mapping analysis as validation of our methods by examining top-ranking novel variants in six independent populations with a total of 3128 cases and 2966 controls. Three novel loci in the suggestive range were identified based on our Bayesian framework analyses: KCNIP4 at 4p15.2 (rs6448050, P = 4.6×10⁻⁷) and MTMR2 at 11q21 (rs10501831, P = 3.1×10⁻⁶) with SCC, as well as GAREM at 18q12.1 (rs11662168, P = 3.4×10⁻⁷) with AC. Use of our prioritization methods validated two of the top three loci associated with SCC (P = 1.05×10⁻⁴ for KCNIP4, represented by rs9799795) and AC (P = 2.16×10⁻⁴ for GAREM, represented by rs3786309) in the independent fine mapping populations. This study highlights the utility of using prior functional data for sequence variants in prioritization analyses to search for robust signals in the suggestive range.
Introduction
Lung cancer is the leading cause of cancer-related mortality worldwide accounting for over 1 million deaths annually (1). While tobacco consumption remains unequivocally the main determinant of lung cancer incidence, evidence suggests a role of genetic variation in disease etiology (2). The main histological subtypes of lung cancer are adenocarcinoma (AC), squamous cell carcinoma (SCC) and small cell lung cancer (SCLC). These different histological subtypes of lung cancer have differing etiologies with different somatic mutations (3) and different risk factor profiles (4) observed across major histology groups.
Genome-wide association studies (GWAS) of lung cancer have demonstrated in large-scale replicated analyses that germline genetic variation influences lung cancer risk in European populations 15q25.1 (CHRNA5–CHRNA3–CHRNA4) (5–7), with varying effects by tumor histology. Consistent associations have been observed for AC at 5p15.33 (TERT-CLPTM1L) (8,9) and 3q28 (10), and for SCC at 6p21.33 (BAT3-MSH5) (11), 9p21 (CDKN2A/p16 INK4A/p14 ARF/CDKN2B/p15 INK4B), 12p13 (RAD52) (12), 13q13 (BRCA2) and 22q12 (CHEK2) (10,13). Single-nucleotide polymorphisms (SNPs) at 15q15.2 (TP53bp1) have also been consistently associated with lung cancer risk in candidate gene analyses (14). Additional susceptibility regions at 13q12.12 and 22q12.2 (15) have been identified in Asian populations. These regions have not be associated with lung cancer risk in Europeans.
The Transdisciplinary Research In Cancer of the Lung (TRICL) research team and the International Lung Cancer Consortium (ILCCO) recently completed two comprehensive GWAS meta-analysis of lung cancer across multiple subgroups, including smoking, gender/sex, stage of disease, age at onset and histology (10,13,16). Both investigations employed a standard GWAS analytical approach, which relies on P-values from single marker analysis and stringent significance levels to adjust for multiple comparisons. This standard analytical approach is, however, limited in that (i) it does not take study power into account when comparing test statistics; (ii) it ignores biological function of the genes and variants and (iii) the GWAS-level significance is based on a global null hypothesis and true susceptibility loci may be left unidentified. Given the importance of differential response to therapy and subsequent outcomes by lung cancer histological subtypes, we aimed to conduct an in-depth GWAS investigation of lung cancer histological subtypes. The main innovative aspects of this study include Bayesian framework prioritizations to incorporate prior biological information, five additional lung cancer studies genotyped based on Axiom array and two non-European populations (a Japanese and a Han Chinese population) for across ethnic generalizability. We conducted three Bayesian framework analyses including the stratified false discovery rate (SFDR) (17), the Bayesian false discovery probability (BFDP) (18) and hierarchical modeling (HM) methods (19). We used these methods to incorporate available functional and regulatory data for the genes and variants located on the 550K genotyping platform in order to identify additional genetic regions of interest.
Materials and methods
Study descriptions
Discovery set
The meta-analysis was based on summary data from 13 previously reported lung cancer GWAS conducted in European-descent populations providing genotype data on a total of 14049 lung cancer cases, including 5061 SCC, 6756 AC and 2216 SCLC with 33456 controls of European descent: the M.D. Anderson Cancer Center (MDACC) lung cancer study (6); the Liverpool Lung Project (LLP) (20); the UK lung cancer GWAS from the Institute for Cancer Research (ICR) (11); deCODE Genetics lung cancer study (21); the Helmholtz-Gemeinschaft Deutscher Forschungszentren lung cancer GWAS (22); the lung cancer study from Canada (Lunenfeld-Tanenbaum Research Institute (LTRI) and University of Toronto) (23); the Harvard lung cancer study (24); NCI lung cancer GWAS including the Environment and Genetics in Lung Cancer Etiology (EAGLE) GWAS (25), the Alpha-Tocopherol, Beta-Carotene Cancer Prevention Study (ATBC) GWAS (26), the Prostate, Lung, Colon, Ovary Screening Trial (PLCO) (27), lung cancer GWAS and the Cancer Prevention Study II Nutrition Cohort (CPS-II) GWAS (28); the IARC lung cancer GWAS (29); the Memorial Sloan Kettering Lung Cancer GWAS (30) and the Mayo lung cancer GWAS (31). In each of these studies, SNP genotyping had been performed using Illumina HumanHap 300 BeadChips, HumanHap 550 or 610 Quad arrays. Further details about genotyping in each study are provided in Supplementary Table 2, available at Carcinogenesis Online. For those larger studies with 300K data (MDACC, IARC, LTRI, deCODE and LLP), we included imputed variants to match the genotyped variants on 550K. IMPUTE 2, Mach or minimac using 1000 genome or HapMap2 were used to complete the imputation at the study level (Supplementary Table 2, available at Carcinogenesis Online). Conducting a meta-analysis based on imputed dosage from all studies without any genotyped data on those specific variants would create substantial uncertainty in the combined results. Therefore, for the discovery analysis, we restricted the baseline meta-analysis to those included on 550K array, instead of the maximum number of imputed variants possible. For those regions identified to be associated with lung cancer risk, we conducted further investigation based on regional imputation. To evaluate the association with lung cancer risk in the Japanese and Chinese populations, we analyzed the top regions in 594 lung cancer cases and 942 controls from the Aichi Lung Cancer Studies in Japanese (32) together with 2338 cases and 3077 controls of Han Chinese descent from the Nanjing and Beijing studies (15).
Fine mapping set as a validation approach of signals
For the susceptibility regions identified in the discovery set, we conducted dense genotyping for the purpose of replication and fine mapping based on 3128 cases and 2966 controls of European ancestry from 6 additional independent studies including Mount-Sinai Hospital-Princess Margaret (MSH-PMH) study (10), Multiethnic Cohort (MEC) study, Liverpool lung cancer study (LLP), Nurses’ Health Study (NHS), National Physicians Health Study (NPHS) and the European Prospective Investigation into Cancer and Nutrition (EPIC)-Lung cancer. Details for each of the replication studies are shown at the bottom of Table 1. Genotyping for the replication set was done using the Axiom custom genotyping array from Affymetrix, Inc., Santa Clara, CA, USA.
Table 1.
Study populations included in the pooled analysis
| Study | Study design | Platform | Control (n) | SCC (n) | AC (n) | SCLC (n) |
|---|---|---|---|---|---|---|
| Discovery set | ||||||
| NCI/EAGLE | Population based | HumanHap 550K | 5735 | 1447 | 1844 | 706 |
| Han Chinese | Hospital based | 3077 | 825 | 1307 | 179 | |
| IARCa | Hospital/population based | HumanHap 317Kb | 3791 | 1031 | 595 | 451 |
| ICR | Hospital-based cases, 1958 birth controls | HumanHap 550K | 2699 | 611 | 465 | 530 |
| MD Anderson | Hospital based | HumanHap 317Kb | 1137 | 302 | 558 | — |
| Harvard | Hospital based | HumanHap 610K | 970 | 215 | 486 | — |
| deCODE | Nested case–control | HumanHap 317Kb | 11227 | 179 | 346 | 98 |
| Japan Aichi | Population based | HumanHap 550K | 942 | 118 | 412 | 64 |
| Germany | Population based | HumanHap 550K | 484 | 100 | 198 | 109 |
| Liverpool | Population-based cases, WTCCII controls | HumanHap 317K | 2501 | 167 | 169 | 57 |
| Mayo | Hospital based | HumanHap 370K/610K | 377 | 16 | 221 | 10c |
| Toronto | Hospital and population based | HumanHap 317Kd | 464 | 50 | 90 | 22 |
| MSKCC | Hospital based | HumanHap 317K | 52 | 5c | 63 | 1c |
| Total | 33456 | 5061 | 6756 | 2216 | ||
| Validation set | ||||||
| EPIC Lung | Nested case–control | Axiom custom array | 1003 | 218 | 297 | 148 |
| LLP | Hospital based | Axiom custom array | 336 | 148 | 137 | 49 |
| NHS | Nested case–control | Axiom custom array | 324 | 0 | 195 | 43 |
| PHS | Nested case–control | Axiom custom array | 169 | 23 | 67 | 21 |
| MEC | Nested case–control | Axiom custom array | 213 | 26 | 79 | 25 |
| MSH-PMH | Clinic based | Axiom custom array | 921 | 210 | 641 | 83 |
| Total | 2966 | 625 | 1417 | 369 | ||
aIARC study consists of cases and controls from CARET, Central Europe, HUNT\Tromso, Estonia and France studies.
bUsed imputed data to get a set of SNPs closer to the 550K chip where measure of imputation quality was above 0.3 from MACH.
cNot included in the combined estimates.
dUsed imputed data to get a set of SNPs closer to the 550K chip where measure of imputation quality was above 0.3 from Impute.
Statistical methods
Study-specific analysis of GWAS data
For all studies, we used unconditional logistic regression models adjusted for sex, age (years or 5-year age intervals where available), country/study center where appropriate, smoking status (never/current/former or pack-years where available) and the top principal components of population structure (where available). Effects were estimated separately for SCC, AC and SCLC. Analyses among large cell lung cancers and other less frequent histology groups were not pursued, as the within-study numbers of cases were small. We therefore confined our analyses to the three main histology groups.
Prior to undertaking the meta-analysis of all GWAS data sets, we searched for potential errors and biases in data from each case–control series. Lambda inflation factors (λ) were calculated for each study. With the exception of Memorial Sloan Kettering Cancer Center (MSKCC) study that has a smaller sample size (λ = 1.11), quantile–quantile (Q–Q) plots showed no evidence of inflation of the test statistics indicating that substantial cryptic population substructure or differential genotype calling between cases and controls was unlikely in each of the individual GWAS (Supplementary Table 3, available at Carcinogenesis Online) (33).
Combined analysis
The combined analyses were conducted based on fixed-effects models for each of the three main histology groups. As for the individual studies, we examined for overdispersion of P-values in the meta-analysis by generating Q–Q plots and deriving an inflation factor. Cochran’s Q statistic to test for heterogeneity and the I 2 statistic to quantify the proportion of the total variation due to heterogeneity were calculated. I 2 values ≥75% are considered characteristic of large heterogeneity (34).
All calculations for the pooling of the effect estimates were performed using PLINK (35) and SAS version 9.2 (SAS Institute Inc., Cary, NC, USA). Q–Q and Manhattan plots were created using an R program. We used LocusZoom for regional visualization of results (36).
Prioritization approaches
We utilized three Bayesian framework analytical approaches, including the SFDR described in Sun et al. (17), the BFDP described in Wakefield (37) and HM described in Chen and Witte (19), in order to identify additional novel variants by incorporating prior knowledge. The three methods, although differing greatly in approach, are all based on the premise of using additional information to improve the identification of variants for prioritization. All methods used estimates from the fixed-effects meta-analyses as input data for prioritization.
Variant information
In order to inform the prioritization analyses, we utilized biological data on the genes and the variants including (i) functional annotations: whether a variant was in a coding region, non-synonymous or intergenic based on Illumina annotation files (38); (ii) conservation scores across mammals [PhastCons (39)]; (iii) prediction of deleterious nature of a variant [SIFT Scores (40)] and (iv) regulatory elements [whether a variant was in an area of a transcription factor (TF) binding or DNase hypersensitivity sites (www.genome.ucsc.edu) for several cell lines including normal human lung fibroblasts] and (v) linkage disequilibrium (LD) tagging: as the variants on the platforms used are chosen as ‘tagSNPs’ for their tagging ability, we included information for those variants in LD (defined as r 2 > 0.8 within a 500kb window) with the directly measured variants. In order to determine variants in LD with tagSNPs, we used the SNAP tool from the broad institute (41). This process included functional variants (whether a variant was in LD with a variant at a splice site, a variant in a coding region, a non-synonymous variant, non-sense or missense variant, whether a variant was in a 3′ untranslated region or a frameshift variant). To account for the aspects of pooled analysis and heterogeneity across the study-specific results, we also included the P-values for heterogeneity in the prior data for each variant for each histology analyses. This is motivated by the notion that ‘true’ effects will be consistent across studies of similar genetic ancestry and should be given additional weight in prioritization analyses. Each of the measures/categories of information was parameterized to have non-negative values in a similar range across the information columns. Examples and further detail of the variant information are provided in Supplementary Table 4, available at Carcinogenesis Online. We employed the functional information differently in each of the methods as described below. Specific details for each of the approaches have been published (17−19) previously; hence, only a brief description of the specific parameters in each application is described below.
Stratified false discovery rate
The SFDR is based on the premise of using stratification in the number of hypotheses tested based on prior knowledge as a stratum indicator for the calculation of false discovery rates (17). After stratification, provided that the stratum indicator is informative of association with the phenotype of interest, the false discovery rate for a given threshold should be lower in the strata with higher prior evidence. Within the strata, Q-values (42) are then calculated for each variant and used as a means of prioritization ranking. Thus, with the use of an informative stratum indicator the ratio of true positive associations should be greater within the higher strata. In this application we used the sum of all the information categories (Supplementary Table 4, available at Carcinogenesis Online) as a stratum indicator and used a 3-strata approach. The functional categories for exonic variants and regulatory regions [deoxyribonuclease (DNase) hypersensitive sites and TF-binding sites] are given higher weighting in our prior distribution/stratum indicator. This is reflective of the findings of Hindorff et al. (43) that showed these types of variants to be augmented in the replicated GWAS findings observed to date in the NHGRI catalogue. For each histology group, we determined 3-strata based on two sets of the prior probability distribution: at the 50% and 90% percentile cutoffs and the 75% and 95% percentile. P-values from fixed-effects pooling were used as input data for each SNP across histology groups into the software provided by Sun et al. (http://www.utstat.toronto.edu/sun/Software/SFDR/index.html).
Bayesian false discovery probability
The BFDP utilizes Bayes factors, the ratio of the probability of the data under the null and alternative hypotheses, as an alternative to the P-value for assessing the consistency of a set of data with a null hypothesis (18). We applied an asymptotic closed-form approximation of the Bayes factor that is based on results of the logistic regression. The sum of all the information categories was used as the prior odds of association in the calculation of the approximate Bayes factors (ABF). This is based on the assumption that the functional categories for exonic variants and regulatory regions (DNase hypersensitive sites and TF-binding sites) are given higher weighting in our prior distribution/stratum indicator as described above. The minor allele frequency (MAF)-independent derivation of the BFDP was used with an upper relative risk parameter of two (44). This approach assumes that relative risk will occur with low probability above two. The critical difference between Wald-based P-values and ABF is that ABF depends not only on the test statistic but also on the power through the asymptotic variance (45).
Hierarchical modeling
We applied a HM method developed by Chen and Witte (19) for GWAS data to optimize variant prioritization based on prior biological information. This method takes prior information into account in a weighted two-stage regression model with the aim of improving effect and variance estimation. Their method was shown to be informative to deviations in the prior information used, provided that the altered prior distributions remain informative. The measures of function described in the variant information section were used for the Z-matrix for this analysis, a key component of this particular HM approach. The input data for this model were the variant-specific regression coefficients and standard error estimates for each variant across histology groups. Based on our previous investigations (46), we used the P-value for heterogeneity across studies as a weighting column for the second-stage analyses. We used τ of 0.05 and ρ of 0.01 as variance parameters required for model estimation based on previous investigations (13) where τ represents the range of residual effects after adjustment for all first- and second-stage covariates and ρ constrains the minimum standard deviation across all variants. The model provides a HM estimate (B^) which can be considered a posterior estimate of the association after consideration of the prior (Z) matrix and weighting between first- and second-stage estimates based on the model parameters. Although B^ are not asymptotically unbiased estimators, previous theoretical and simulation work shows that they are consistent estimators and that Wald procedures perform work well in typical finite samples (47). We therefore present P-values from HM based on this approach.
Comparison of results and methods
We applied a straightforward ranking procedure for each of the additional prioritization techniques whereby those with low BFDP values, small P-values from HM or small Q-values from SFDR were given top rankings. These were compared with the results of the P-values and their respective rankings from fixed-effects pooled maximum likelihood estimates. The number of variants ranked in the top 100 that was not included in the P-value cutoffs of interest was investigated further since those were the variants that would have been missed if one only considered P-values as the selection criteria.
Regional imputation based on HapMap2 and 1000 genomes
Where available, data from 1000 genomes or HapMap2 was used for the top regions of interest from the discovery set results. A protocol was circulated with the flanking positions for the four regions based on human genome build 18 and/or 19 depending on the imputation that was done in each of the centers. Centers used the software of preference for imputation including Minimac, MACH, IMPUTE or BEAGLE (Supplementary Table 2, available at Carcinogenesis Online). The analytical model was the same as in the initial first-stage analyses. Study-level results were then pooled for each of the regions to examine for additional variants of interest within the regions using GWAMA (48).
Fine mapping set analyses
In order to validate the regions identified through the prioritization techniques, a conventional analysis of regions of interests were conducted. We employed unconditional logistic regression models adjusted for sex, age (years or 5-year age intervals where available), country/study center where appropriate, smoking status (never/current/former or pack-years where available) and the top principal components of population structure (where available).
Results
In general, the Bayesian framework analysis in each histological subtype with a denser baseline of meta-analysis after imputation led to identification of additional susceptibility regions of lung cancer histology groups. Table 2 displays the number of novel variants that reached a level of significance at 10−6 to 10−3 as well as the number of variants ranked in the top 100 from the prioritization techniques for each histology group that had P-values > 0.001 in the pooled analysis. From the additional pooled fixed-effects, we identified regions of interest in the P-value range of P < 10−5 where relative ranking persisted after incorporation of prior functional knowledge with a Q-value from SFDR < 0.05, ABF < 0.05 and P-value from HM < 0.001 (Figure 1). Our results included the previously observed variants from GWAS of lung cancer examining histology-specific effects (16). Following the application of prioritization methods, these variants remained top ranked, suggesting that true effects will not be altered or missed when using these alternative approaches (Supplementary Table 1, available at Carcinogenesis Online).
Table 2.
Number of variants and regions included through each prioritization method
| SCC | AC | SCLC | ||||
|---|---|---|---|---|---|---|
| Variants | Regions | Variants | Regions | Variants | Regions | |
| Novel variants P = 10−6 to 10−3 | 15 | 11 | 8 | 7 | 3 | 3 |
| P < 0.0001 first stage | 123 | 75 | 93 | 62 | 92 | 68 |
| P > 0.0001 but SFDR rank in top 100 | 26 | 20 | 21 | 19 | 17 | 14 |
| P > 0.0001 but ABF rank in top 100 | 20 | 19 | 35 | 29 | 36 | 32 |
| P > 0.0001 but HM rank in top 100 | 12 | 12 | 24 | 24 | 47 | 39 |
Region corresponds to an area of LD R2 > 0.8 or with 500 kbp.
Figure 1.

Study-specific results for top variants of interest in the discovery set.
Squamous cell carcinoma
When estimates from the 12 studies including SCC cases were combined (n = 5061 cases, without MSKCC that has too few SCC), P-values were not overly inflated (λ = 1.01). We observed significant associations with the previously reported regions at 15q25, 5p15, 6p21 and 12p13 (Figure 2). In addition, a locus (rs6448050) in KCNIP4 gene at 4p15.2 (Supplementary Figure 1A, available at Carcinogenesis Online) was found across the studies to be associated with the risk of lung SCC with odds ratio (OR) of 1.18 [95% confidence interval (CI) = 1.10–1.26, P-heterogeneity (P-het) = 0.99] and P-value of 4.6×10⁻⁷ (ABF = 1.01×10⁻⁴, SFDR = 0.017, HM P-value = 3.0×10⁻⁶) (Figures 1 and 2 A–D). When examining the ABF and P-value from HM, the relative significance of the variant persisted. The combined prior weight across all the columns of the prior matrix for this variant was in the 75th percentile, which placed it in an elevated stratum of prior probability of association for the SFDR analysis. This variant was not present on the 317K array therefore was not identified in Timofeeva et al. (16). By imputation, we were able to combine the genotyped data in Germany, NCI, Harvard, ICR and Mayo, with imputed data from the MDACC, Toronto, deCODE and Central Europe data sets. In the Japanese GWAS, we observed the association in the same direction which when combined provided a P-value of 7.07×10⁻⁷. The results did not appear to be generalizable in the Han Chinese population in the Nanjing study.
Figure 2.
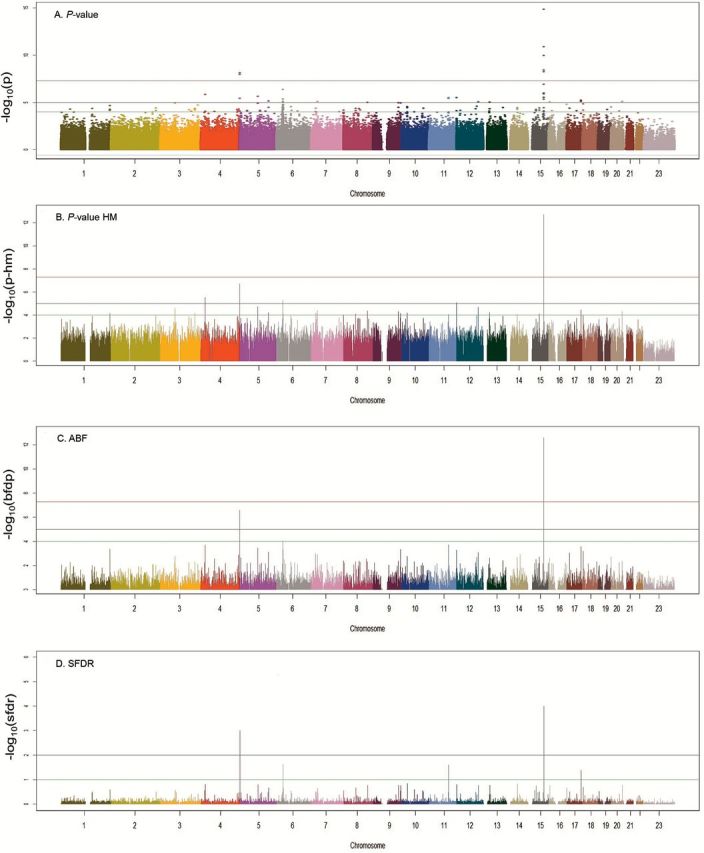
Results of fixed-effects analysis and prioritization techniques for SCC. Panel A. P-values from random effects models across studies. P-value: red line = 10−7, black line = 10−5 and green line = 10−4. Panel B. P-values from hierarchical modeling. HM P-value: red line = 10−7, black line = 10−5 and green line = 10−4. Panel C. Approximate Bayes Factor Values from BFDP modeling. ABF: red line = 10−4, black line = 10−2 and green line = 10−1. Panel D. Q-values from stratified false discovery rate modeling. SFDR: black line = 10−2 and green line = 10−1.
In our fine mapping set, we increased the density of this region and genotyped 1304 markers (positions 20391615–23274625bps625bpsin Build 37 coordinates) with an Axiom array in 3128 cases and 2966 controls. The overall signal in KCNIP4 was validated with P-value of 1.4×10⁻⁶ for lung SCC, but interestingly the dense genotyping refined the location of the signal within KCNIP4. The lead variant in the fine mapping and validation sets was rs9799795 with an OR of 0.74 (95% CI = 0.64–0.86, P = 1.05×10⁻⁴, P-het = 0.23) (Supplementary Figure 1B, available at Carcinogenesis Online).
Another locus (represented by rs10501831) in the MTMR2 gene located on chromosome 11q21.1 at position 95230961 was associated with SCC risk in the discovery set (Supplementary Figure 2A, available at Carcinogenesis Online) with an OR of 1.41 (95% CI = 1.22–1.63, P = 3.1×10⁻⁶, P-het = 0.95, SFDR = 0.0248, ABF = 1.44×10⁻⁴). When examined among the Japanese population, consistent effects were observed with a combined P-value of 9.99×10⁻⁷. SNP rs10501831 had a high prior weight (>90th percentile), which contributed to the higher-ranking HM and ABF and placed it in the third strata for SFDR (Figure 2A–D). From the regional imputation examination, the region of interest on chromosome 11 showed a large region of LD across the MTMR2 and CEP57 genes including two additional SNPs of interest, rs2155436 and rs10501832. A dense panel of 711 markers was genotyped with Axiom array for this region (between position 95472391 and 96125436 based on Build 37) in our validation and fine mapping set, but variant (rs10501831) was not significant (Supplementary Figure 2B, available at Carcinogenesis Online) for lung SCC. Although the adjacent variants (represented by rs74663383) in the same region showed a suggestive association with P-value of 0.004, the overall evidence of an association based on the regional plot was not strong.
Adenocarcinoma
When estimates from the 13 studies examining AC were combined (n = 6756 cases including studies from Japan and China), significant values were not overly inflated (λ = 1.01). We observed significant associations with the previously reported regions of 15q25 and 5p15 (Figure 3A–D). In addition, we observed a novel locus (represented by rs11662168) at 18q12.1 in the GAREM (also known as FAM59A) gene with an OR of 1.34 and P-value of 3.44×10⁻⁷ (95% CI = 1.19–1.49, P-het = 0.28, Q-SFDR = 0.0108, ABF = 2.0×10⁻⁵, P-value from HM = 5.30×10⁻⁵) (Supplementary Figure 3A, available at Carcinogenesis Online). The effect was observed in the same direction among the Japanese population, which provided a combined P-value of 2.95×10⁻⁷ (Figure 1). The results did not appear to be generalizable in the Han Chinese population based on the Nanjing study. When examining the Q-values from the SFDR and ABF the ranking of the variant was suggested to be higher than using fixed-effect P-values. Examining the regional imputation results using HapMap2, the results on chromosome 18 show an area of elevated significance around the lead SNP rs11662168 with rs11662168 remaining the most significant variant (Supplementary Figure 3A, available at Carcinogenesis Online). These variants map directly to the GAREM gene. The region also showed a significant association in the validation and fine mapping population. A dense panel of 1786 markers was genotyped with Axiom array (between positions 28571083 and 30434298 based on Build 37) in our replication and fine mapping set. The lead variant in the replication set was rs3786309 (OR = 1.22, 95% CI = 1.10–1.35, P-value = 0.000192, P-het = 0.07) (Supplementary Figure 3B, available at Carcinogenesis Online) for lung AC. The original hit rs11662168 also remained significant in the replication set with P-value of 0.04.
Figure 3.
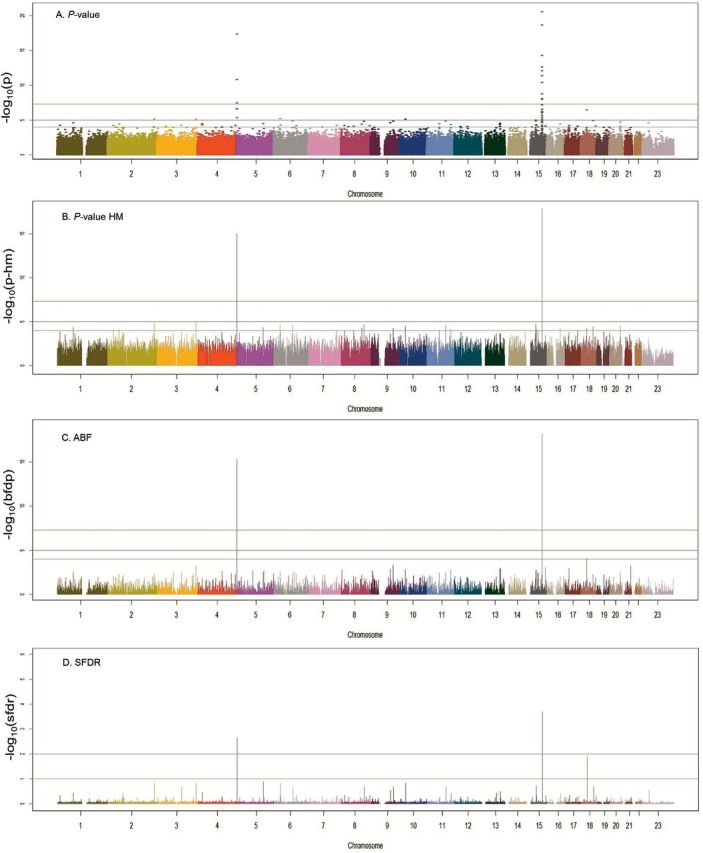
Results of fixed-effects analysis and prioritization techniques for AC. Panel A. P-values from random effects models across studies. P-value: red line = 10−7, black line = 10−5 and green line = 10−4. Panel B. P-values from hierarchical modeling. HM P-value: red line = 10−7, black line = 10−5 and green line = 10−4. Panel C. Approximate Bayes Factor Values from BFDP modeling. ABF: red line = 10−4, black line = 10−2 and green line = 10−1. Panel D. Q-values from stratified false discovery rate modeling. SFDR: black line = 10−2 and green line = 10−1.
Small cell lung cancer
When estimates from the nine studies with genotyped cases of SCLC were combined (n = 2216, without the Mayo and MSKCC studies as the sample sizes were too small to obtain reliable estimates), significant values were not overly inflated (λ = 1.00). We observed significant associations with the previously reported region of 15q25 (Supplementary Figure 4A–D, available at Carcinogenesis Online). When applying additional prioritization techniques, we did not identify additional regions of interest for SCLC. Two loci (DAOA and LTB1) warranted additional investigation; however, results did not appear to be consistent across studies and were being driven by single-study estimates. A lack of LD with other associated SNPs in regional plots was also suggestive of a chance finding at a single SNP. A full list of top results is included in Supplementary Table 1, available at Carcinogenesis Online.
Discussion
We uncovered novel associations in the genome-wide suggestive range for both AC and SCC of the lung using additional prioritization approaches. We used fine mapping as validation for our methods that confirmed significant effects in two of the three susceptibility regions in independent data sets of five additional lung cancer studies using a different genotyping platform. We consider this result as an evidence to support the biological importance of this gene for lung cancer etiology in general. Our findings, in conjunction with previous lung cancer GWAS (16) and recent histology-specific whole-genome sequencing initiatives (49–51), provided additional evidence of histology-specific genetic etiology of lung cancer. The previous combined analyses conducted within TRICL/ILCCO were well powered to detect common risk loci (MAF > 5%) of a moderate effect size (Relative Risk (RR) = 1.20) at power of over 90%. Therefore, this analysis demonstrated the potential for the application of additional statistical techniques under the Bayesian framework to identify associations in the suggestive regions that appeared to be robust to adjustment for additional measures of prior information.
Novel lung cancer susceptibility regions
For SCC and AC, we identified novel variants using a Bayesian framework analysis approach. We identified an association with variations in KCNIP4 gene in the suggestive range specifically in squamous cell lung cancer as indicated based on this analysis, and this was robust to several prioritization techniques. To our knowledge, this gene has not been implicated in lung cancer risk to date. This gene is believed to play a role in the regulation of Wnt-mediated beta catenin signaling and target gene transcription pathways (52). It is also implicated in the carcinogenic mechanism of kidney cancer (53) and pancreatic cancer (54) through candidate pathways analysis. KCNIP4 has also been implicated in the development of asthma (55). Asthma has been implicated in lung cancer risk (56) and may present a shared causal genetic contribution between the two diseases.
For the loci in GAREM (Grb2 associated and regulator of Erk/MAPK) (rs11662168/rs3786309), the effect was observed in the consistent direction in one of the study populations consisting entirely of never smokers (MSKCC and Mayo). This at least partially alleviates the possibility of the variant acting as a marker of tobacco exposure. GAREM, also referred to as FAM59A, has been identified as a protein that contributes to cellular transformation through the activation of extracellular signaling-regulated kinase signaling (57).
The possibility of the variants representing chance findings cannot be excluded despite the large amount of data included in these analyses. The validation of our prioritization results in an independent data set, the reliability of the relative rankings of the variants after adjustment for prioritization techniques and the homogeneity of results across all participating studies would, however, collectively argue against chance findings. Winner’s curse (58) cannot be precluded particularly for those variants with low MAFs. The lead variants of the two validated regions highlighted in this work all have MAF above 5% in the study populations (4p15 rs6448050 T allele 28%, rs9799795 A allele 45%, 18q12: rs11662168 C allele 8% and rs3786309 T allele 47%). Despite a standard protocol of covariate adjustment and quality control threshold, variations may be present in the results of imputed variants as they were conducted at each study level. However, the minimal heterogeneity across the study results for these two regions is most reassuring. Our analysis has included all lung cancer GWAS data that are available for European descendants to date, and it represents maximum statistical power for the analysis for each histological subtype.
Functional variation
As the validated variants in 4p15.2 and 18q12.1 representing the two novel loci are located in intronic regions (non-coding variants), we undertook additional investigation into probable function of the variants or those with which they are in LD. Non-coding variants in these regions were investigated in the RegulomeDB database (59) and using HaploReg (60). RegulomeDB and Haploreg synthesize data from multiple sources including protein-binding data (ChIP-Seq), expression quantitative trait loci (eQTL), location of TF binding sites, TF motif data (position weight matrices, PWM), DNase sensitivity (DNase-Seq), histone modification (Chip-Seq) data, manually curated regions and validated functional SNPs and provide a score for all non-protein coding variants in dbSNP132 (regulome.standford.edu) as obtained from the ENCODE database. Application of this approach has shown that in 80% of validated GWAS findings taken from the NHGRI database the associated ‘lead SNP’ is in LD with a variant in the RegulomeDB with a substantially higher functional score than the lead SNP itself (61). Regions of LD where r 2 > 0.8 and within the 500-kb distance from the lead SNP were investigated. The top-ranked SNP for each variant using RegulomeDB and HaploReg is shown in Table 3. RegulomeDB provides a score from 1 to 7 with subcategories for 1–3 (1a being the highest level of evidence, e.g. variant is an eQTL + TF-binding site + matched TF motif + matched DNase Footprint + DNase peak). For example, the variant rs923673 that is in linkage with our lead SNP (rs9799795) and located in the KCINP4 gene was scored as 1f in RegulomeDB as it was located in an eQTL, in a TF-binding site (from ChIP-Seq data) and the variant is likely to affect protein binding through histone modifications. HaploReg provides similar information about functionality of variants, including those in LD with the primary variant of interest. This tool suggests that variants in LD with our novel loci may alter regulatory motifs for genes with known relationships with lung cancer. Table 3 highlights the variants that may impact the function of genes known to be relevant in lung cancer development and/or progression. For example, the variant rs11727733 that is in linkage with our lead SNP (rs9799795) and located in the KCINP4 gene alters a Foxp3 regulatory motif. Furthermore, the variant rs10468834 that is in linkage with our lead SNP (rs11662168) and located in the GAREM gene alters a p53 regulatory motif.
Table 3.
Annotation of possible ‘functional’ SNPs using lead SNP approach in (A) RegulomeDB (61) and (B) HaploReg (60)
| Lead SNP | chr | Position (hg19) | Associated gene | Highest SNP in LD | RegulomeDB score | Position (hg19) | Distance to lead SNP (bp) |
|---|---|---|---|---|---|---|---|
| (A) | |||||||
| rs6448050 (discovery) | 4 | 21407759 | KCNIP4 | rs59708864 | 3a | 21368138 | 39621 |
| rs9799795 (fine mapping) | 4 | 20831806 | KCNIP4 | rs923673 | 1f | 20791197 | 40609 |
| rs11662168 (discovery) | 18 | 30026392 | GAREM | rs7237059 | 2b | 29958797 | 67595 |
| rs3786309 (fine mapping) | 18 | 29972774 | GAREM | rs73956883 | 2b | 29913973 | 58801 |
| Lead SNP | chr | Position (hg19) | Associated gene | Highest SNP in LD | HaploReg results | Position (hg19) | Distance to lead SNP (bp) |
|---|---|---|---|---|---|---|---|
| (B) | |||||||
| rs6448050 (discovery) | 4 | 21407759 | KCNIP4 | rs17462464 | 16 regulatory motifs altered | 21383391 | 24368 |
| rs9799795 (fine mapping) | 4 | 20831806 | KCNIP4 | rs11727733 | Foxp3 regulatory motif altered | 20837717 | 5911 |
| rs11662168 (discovery) | 18 | 30026392 | GAREM | rs10468834 | p53 regulatory motif altered | 30029959 | 3567 |
| rs3786309 (fine mapping) | 18 | 29972774 | GAREM | rs3786309 | RXRA motif altered | — | — |
Regulome scores correspond to 1f, eQTL + TF binding/DNase peak; 2a, TF binding + matched TF motif + matched DNase Footprint + DNase peak; 2b, TF binding + any motif + DNase Footprint + DNase peak; 3a, TF binding + any motif + DNase peak. Table 3B highlights the variants that may impact the function of genes known to be relevant in lung cancer development and/or progression. For rs3786309, HaploReg did not yield any functional SNPs in their LD algorithm.
Using novel prioritization approaches to replicate known variants
Our results included the previously observed variants from GWAS of lung cancer examining histology-specific effects (16). After calibration with the techniques employed in this investigation, these known loci remained top ranked, suggesting that true effects will not be altered or missed when using these alternative prioritization approaches (Supplementary Table 1, available at Carcinogenesis Online).
The observed association in 5p15 region appears to be different across SCC and AC cases as previously observed with the association localized to CLPTM1L (rs401681) for SCC and localized to TERT for (rs2736100) AC. The previously observed associations in RAD52 (12) and BAT3-MSH5 (11) specific to SCC are consistent with the premise that altered DNA-repair capacity is essential to lung cancer (62) development and for this subtype where tobacco smoking is an extremely strong risk factor.
As expected, we also observed the associations within the 15q25.1 region. We observed evidence consistent with two distinct signals in the region having independent effects on lung cancer (6,7). As identifying additional variants in novel regions using Bayesian prioritization approach was the main goal of this study, and conditional analyses (adjusting for the effects of the regions) were already conducted for a previous study based on similar data (16), we did not include conditional analyses for these known regions in this project.
Motivation for using prioritization approaches
The approaches employed in the prioritization analyses are based on the presumption that ‘functional’ SNPs or those in LD with such SNPs are more likely to be associated causally with risk of cancer development. A summary of enrichment/depletion of SNP types from published GWAS (43) suggested that non-synonymous sites were significantly enriched in addition to regulatory elements and intergenic with a depletion of effect among intergenic regions when compared with SNPs randomly selected from genotyping arrays. A recent analysis suggested that in validated GWAS associations, among those SNPs that are not in coding regions, a higher proportion of DNase hypersensitive sites are observed suggesting a great importance of variants in non-coding regulatory regions (63). Our prior data were constructed to reflect these observations with information capturing both coding, differential coding sequences and regulatory elements. The limitation in the use of this data as well as use of the RegulomeDB is that they are not tissue specific and therefore may affect applicability of the functional information. With additional tissue-specific database becoming available [e.g. GTEx and TCGA data portal (64,65)], it is possible that the prior data can be improved over time. The present study was also limited to the genetic variants tagged by the genotyping arrays used and the quality of the imputation data for those regions. Our approach did not consider a polygenic model to account for the joint effect of many variants with small effects. However, the novel variants identified in our study will contribute to future work on establishing polygenic model for lung cancer as the statistical methods continue to develop to adequately analyze polygenic effects in GWAS of complex diseases (66).
The results of these analyses and others (67–69) employing prioritization approaches to GWAS data utilizing the wealth of information available through online collaborative and data banking efforts suggest that these techniques are indeed useful as complimentary approaches to the traditional methods. Our results suggest that in this particular application and using this prior distribution for the variants, the Q-values from the SFDR stratified the ranking most clearly between those variants suggested for additional prioritization compared with the other two methods. This is based on the relative difference between those top values for the top-ranked SNPs and the rest of variants as observed in the Manhattan plots.
In this study, we identified two novel lung cancer susceptibility loci using multiple variant prioritization techniques with a total of 16460 cases and 36422 controls in a two-stage design. Moving forward, these variants are included on the OncoArray, a cancer-specific chip, being developed in partnership across the major cancer consortia at which point associations for multiple cancer sites can be investigated. Our results can also contribute to future work on establishing polygenic model for lung cancer.
Supplementary material
Supplementary Tables 1–4 and Figures 1–4 can be found at http://carcin.oxfordjournals.org/
Funding
The work reported in this article was partly undertaken during the tenure of a Postdoctoral Fellowship from the IARC (for D.R.B.). The statistical analysis and data management of this project was partially supported by National Institutes of Health (NIH) (U19-CA148127-01). Work carried out at Mayo was supported by the Mayo Foundation funds and U.S. National Institutes of Health (R01 grants CA-80127, CA-84354). The Nurses’ Health Study (NHS) was supported by the grant (P01-CA087969). PHS is supported by (CA 097193, CA 34944, CA 40360, HL 26490 and HL 34595) from the NIH, Bethesda, MD USA. The work performed at ICR was supported by Cancer Research UK (C1298/A8780 and C1298/A8362); National Cancer Research Network (NCRN); HEAL; Sanofi-Aventis and National Health Service funding to the Royal Marsden Hospital and Institute of Cancer Research, as well as the National Institute for Health Research Biomedical Research Centre. Work at ICR was also supported by NIH (GM103534) and the Institute for Quantitative Biomedical Sciences at Dartmouth to C.I.A. The work performed at the M.D. Anderson Cancer Center (MDACC) was supported by the National Cancer Institute grant (P50-CA070907). The work done at the Memorial Sloan Kettering Cancer Center (MSKCC) was supported by NCI CCSG award (P30-CA008748). Work performed at Harvard was supported by the NIH (CA074386, CA092824 and CA090578). The Nanjing study and Beijing studies were funded by the China National High-Tech Research and Development Program Grant (2009AA022705); the National Key Basic Research Program Grant (2011CB503805) and the National Natural Science Foundation of China (30730080, 30972541, 30901233 and 30872178). The LTRI study was supported by Canadian Cancer Society Research Institute (020214); Ontario Institute of Cancer and Cancer Care Ontario Chair Award to R.H. Sample collection for the Heidelberg lung cancer study was in part supported by a grant (70–2919) from the Deutsche Krebshilfe. The work was additionally supported by a Helmholtz-DAAD fellowship (A/07/97379 to M.N.T.) and by the NIH (USA) (U19CA148127). The KORA Surveys were financed by the GSF, which is funded by the German Federal Ministry of Education, Science, Research and Technology and the State of Bavaria. The LUng Cancer in the Young study (LUCY) was funded in part by the National Genome Research Network (NGFN); the DFG (BI 576/2-1, BI 576/2-2); the Helmholtzgemeinschaft (HGF) and the Federal office for Radiation Protection (BfS: STSch4454). Genotyping was performed in the Genome Analysis Center (GAC) of the Helmholtz Zentrum Munchen. Support for the IARC genome-wide studies was provided by Institut National du Cancer, France. The MSH-PMH study is supported by Canadian Cancer Society Research Institute (no. 020214, PI: Hung) and Cancer Care Ontario Research Chair (Hung, Liu). The Multiethnic Cohort Study has been supported by US Public Health Service (National Cancer Institute) grant (R37 CA54281) and MEC Infrastructure Grant (UM1 CA164973). The Liverpool Lung Project (LLP) was supported by the Roy Castle Lung Cancer Foundation, UK.
The EPIC study has been supported by the Europe Against Cancer Program of the European Commission (SANCO); Deutsche Krebshilfe, Deutsches Krebsforschungszentrum, German Federal Ministry of Education and Research; Danish Cancer Society; Health Research Fund (FIS) of the Spanish Ministry of Health, Spanish Regional Governments of Andalucia, Asturias, Basque Country, Murcia and Navarra; Catalan Institute of Oncology, Spain; the ISCIII of the Spanish Ministry of Health (RETICC DR06/0020); Cancer Research UK; Medical Research Council, United Kingdom; Greek Ministry of Health; Stavros Niarchos Foundation; Hellenic Health Foundation; Italian Association for Research on Cancer (AIRC); Italian National Research Council, Fondazione-Istituto Banco Napoli, Italy; Associazione Italiana per la Ricerca sul Cancro-AIRC-Milan; Compagnia di San Paolo; Dutch Ministry of Public Health, Welfare and Sports; World Cancer Research Fund; Swedish Cancer Society; Swedish Scientific Council; Regional Government of Västerbotten, Sweden; NordForsk (Centre of excellence programme HELGA), Norway; French League against Cancer (LNCC), France; National Institute for Health and Medical Research (INSERM), France; Mutuelle Générale de l’Education Nationale (MGEN), France; 3M Co, France; Gustave Roussy Institute (IGR), France and General Councils of France.
Aichi’s study was supported by the National Cancer Center Research and Development Fund (no. H23-A-4); Health and Labor Sciences Research Grants for Research on Applying Health Technology (no. 201136002A) and H26-Innovative Cancer-General-094 from the Ministry of Health, Labor and Welfare and a Research on Grant-in-Aid for Scientific Priority Areas of Cancer (no. 17015018) and on Innovative Areas (no. 221S0001) from the Japanese Ministry of Education, Culture, Sports, Science and Technology.
The Environment and Genetics in Lung Cancer Etiology (EAGLE), the Alpha-Tocopherol, Beta-Carotene Cancer Prevention Study (ATBC) and the Prostate, Lung, Colon, Ovary Screening Trial (PLCO) studies and the genotyping of ATBC, the Cancer Prevention Study II Nutrition Cohort (CPS-II) and part of PLCO were supported by the Intramural Research Program of NIH, NCI, Division of Cancer Epidemiology and Genetics. ATBC was also supported by US Public Health Service contracts (N01-CN-45165, N01-RC-45035 and N01-RC-37004) from the NCI. PLCO was also supported by individual contracts from the NCI to the University of Colorado Denver (NO1-CN-25514), Georgetown University (NO1-CN-25522), Pacific Health Research Institute (NO1-4992 Human Molecular Genetics, 2012, Vol. 21, No. 22, downloaded from http://hmg.oxfordjournals.org/ at Mount Sinai Hospital on January 11, 2013, CN-25515), Henry Ford Health System (NO1-CN-25512), University of Minnesota (NO1-CN-25513), Washington University (NO1-CN-25516), University of Pittsburgh (NO1-CN-25511), University of Utah (NO1-CN-25524), Marshfield Clinic Research Foundation (NO1-CN-25518), University of Alabama at Birmingham (NO1-CN-75022, Westat, Inc. NO1-CN-25476) and University of California, Los Angeles (NO1-CN-25404). The Cancer Prevention Study II Nutrition Cohort was supported by the American Cancer Society. The NIH Genes, Environment and Health Initiative (GEI) partly funded DNA extraction and statistical analyses (HG-06-033-NCI-01 and RO1HL091172-01), genotyping at the Johns Hopkins University Center for Inherited Disease Research (U01 HG004438 and NIH HHSN268200782096C) and study coordination at the GENEVA Coordination Center (U01 HG004446) for EAGLE and part of PLCO studies.
Supplementary Material
Acknowledgements
We thank Dr S.Benhamou for data contribution of the INSERM component in the IARC study.
Conflict of Interest Statement: None declared.
Glossary
Abbreviations
- ABF
approximate Bayes factors
- AC
adenocarcinoma
- BFDP
Bayesian false discovery probability
- CI
confidence interval
- DNase
deoxyribonuclease
- eQTL
expression quantitative trait loci
- GWAS
genome-wide association studies
- HM
hierarchical modeling
- LD
linkage disequilibrium
- MAF
minor allele frequency
- OR
odds ratio
- P-het
P-heterogeneity
- SCC
squamous cell carcinoma
- SCLC
small cell lung cancer
- SFDR
stratified false discovery rate
- SNPs
single-nucleotide polymorphisms
References
- 1. Jemal A., et al. (2011) Global cancer statistics. CA. Cancer J. Clin., 61, 69–90. [DOI] [PubMed] [Google Scholar]
- 2. Brennan P., et al. (2011) Genetics of lung-cancer susceptibility. Lancet. Oncol., 12, 399–408. [DOI] [PubMed] [Google Scholar]
- 3. Pietanza M.C., et al. (2012) Bringing the genomic landscape of small-cell lung cancer into focus. Nat. Genet., 44, 1074–1075. [DOI] [PubMed] [Google Scholar]
- 4. Sun S., et al. (2007) Lung cancer in never smokers—a different disease. Nat. Rev. Cancer, 7, 778–790. [DOI] [PubMed] [Google Scholar]
- 5. Thorgeirsson T.E., et al. (2008) A variant associated with nicotine dependence, lung cancer and peripheral arterial disease. Nature, 452, 638–642. [DOI] [PMC free article] [PubMed] [Google Scholar]
- 6. Amos C.I., et al. (2008) Genome-wide association scan of tag SNPs identifies a susceptibility locus for lung cancer at 15q25.1. Nat. Genet., 40, 616–622. [DOI] [PMC free article] [PubMed] [Google Scholar]
- 7. Hung R.J., et al. (2008) A susceptibility locus for lung cancer maps to nicotinic acetylcholine receptor subunit genes on 15q25. Nature, 452, 633–637. [DOI] [PubMed] [Google Scholar]
- 8. McKay J.D., et al. (2008) Lung cancer susceptibility locus at 5p15.33. Nat. Genet., 40, 1404–1406. [DOI] [PMC free article] [PubMed] [Google Scholar]
- 9. Landi M.T., et al. (2009) A genome-wide association study of lung cancer identifies a region of chromosome 5p15 associated with risk for adenocarcinoma. Am. J. Hum. Genet., 85, 679–691. [DOI] [PMC free article] [PubMed] [Google Scholar]
- 10. Wang Y., et al. (2014) Rare variants of large effect in BRCA2 and CHEK2 affect risk of lung cancer. Nat. Genet., 46, 736–741. [DOI] [PMC free article] [PubMed] [Google Scholar]
- 11. Wang Y., et al. (2008) Common 5p15.33 and 6p21.33 variants influence lung cancer risk. Nat. Genet., 40, 1407–1409. [DOI] [PMC free article] [PubMed] [Google Scholar]
- 12. Shi J., et al. (2012) Inherited variation at chromosome 12p13.33, including RAD52, influences the risk of squamous cell lung carcinoma. Cancer Discov., 2, 131–139. [DOI] [PMC free article] [PubMed] [Google Scholar]
- 13. Hung R.J., et al. (2007) Inherited predisposition of lung cancer: a hierarchical modeling approach to DNA repair and cell cycle control pathways. Cancer Epidemiol. Biomark. Prev., 16, 2736–2744. [DOI] [PubMed] [Google Scholar]
- 14. Truong T., et al. (2010) International Lung Cancer Consortium: coordinated association study of 10 potential lung cancer susceptibility variants. Carcinogenesis, 31, 625–633. [DOI] [PMC free article] [PubMed] [Google Scholar]
- 15. Hu Z., et al. (2011) A genome-wide association study identifies two new lung cancer susceptibility loci at 13q12.12 and 22q12.2 in Han Chinese. Nat. Genet., 43, 792–796. [DOI] [PubMed] [Google Scholar]
- 16. Timofeeva M.N., et al. (2012) Influence of common genetic variation on lung cancer risk: meta-analysis of 14,900 cases and 29,485 controls. Hum. Mol. Genet., 21, 4980–4995. [DOI] [PMC free article] [PubMed] [Google Scholar]
- 17. Sun L., et al. (2006) Stratified false discovery control for large-scale hypothesis testing with application to genome-wide association studies. Genet. Epidemiol., 30, 519–530. [DOI] [PubMed] [Google Scholar]
- 18. Wakefield J. (2007) A Bayesian measure of the probability of false discovery in genetic epidemiology studies. Am. J. Hum. Genet., 81, 208–227. [DOI] [PMC free article] [PubMed] [Google Scholar]
- 19. Chen G.K., et al. (2007) Enriching the analysis of genomewide association studies with hierarchical modeling. Am. J. Hum. Genet., 81, 397–404. [DOI] [PMC free article] [PubMed] [Google Scholar]
- 20. Field J.K., et al. (2005) The Liverpool Lung Project research protocol. Int. J. Oncol., 27, 1633–1645. [PubMed] [Google Scholar]
- 21. Rafnar T., et al. (2011) Genome-wide significant association between a sequence variant at 15q15.2 and lung cancer risk. Cancer Res., 71, 1356–1361. [DOI] [PMC free article] [PubMed] [Google Scholar]
- 22. Sauter W., et al. (2008) Matrix metalloproteinase 1 (MMP1) is associated with early-onset lung cancer. Cancer Epidemiol. Biomark. Prev., 17, 1127–1135. [DOI] [PubMed] [Google Scholar]
- 23. Brenner D.R., et al. (2010) Lung cancer risk in never-smokers: a population-based case-control study of epidemiologic risk factors. BMC Cancer, 10, 285. [DOI] [PMC free article] [PubMed] [Google Scholar]
- 24. Su L., et al. (2006) Genotypes and haplotypes of matrix metalloproteinase 1, 3 and 12 genes and the risk of lung cancer. Carcinogenesis, 27, 1024–1029. [DOI] [PubMed] [Google Scholar]
- 25. Landi M.T., et al. (2008) Environment And Genetics in Lung cancer Etiology (EAGLE) study: an integrative population-based case-control study of lung cancer. BMC Public Health, 8, 203. [DOI] [PMC free article] [PubMed] [Google Scholar]
- 26. The ATBC Cancer Prevention Study Group. (1994) The alpha-tocopherol, beta-carotene lung cancer prevention study: design, methods, participant characteristics, and compliance. Ann. Epidemiol., 4, 1–10. [DOI] [PubMed] [Google Scholar]
- 27. Hayes R.B., et al. (2005) Methods for etiologic and early marker investigations in the PLCO trial. Mutat. Res., 592, 147–154. [DOI] [PubMed] [Google Scholar]
- 28. Calle E.E., et al. (2002) The American Cancer Society Cancer Prevention Study II Nutrition Cohort: rationale, study design, and baseline characteristics. Cancer, 94, 2490–2501. [DOI] [PubMed] [Google Scholar]
- 29. Brennan P., et al. (2006) High cumulative risk of lung cancer death among smokers and nonsmokers in Central and Eastern Europe. Am. J. Epidemiol., 164, 1233–1241. [DOI] [PubMed] [Google Scholar]
- 30. Orlow I., et al. (2008) DNA damage and repair capacity in patients with lung cancer: prediction of multiple primary tumors. J. Clin. Oncol., 26, 3560–3566. [DOI] [PMC free article] [PubMed] [Google Scholar]
- 31. Li Y., et al. (2010) Genetic variants and risk of lung cancer in never smokers: a genome-wide association study. Lancet. Oncol., 11, 321–330. [DOI] [PMC free article] [PubMed] [Google Scholar]
- 32. Ito H., et al. (2012) Association between a genome-wide association study-identified locus and the risk of lung cancer in Japanese population. J. Thorac. Oncol., 7, 790–798. [DOI] [PubMed] [Google Scholar]
- 33. Hosking L., et al. (2004) Detection of genotyping errors by Hardy-Weinberg equilibrium testing. Eur. J. Hum. Genet., 12, 395–399. [DOI] [PubMed] [Google Scholar]
- 34. Higgins J.P., et al. (2003) Measuring inconsistency in meta-analyses. BMJ, 327, 557–560. [DOI] [PMC free article] [PubMed] [Google Scholar]
- 35. Purcell S., et al. (2007) PLINK: a tool set for whole-genome association and population-based linkage analyses. Am. J. Hum. Genet., 81, 559–575. [DOI] [PMC free article] [PubMed] [Google Scholar]
- 36. Pruim R.J., et al. (2010) LocusZoom: regional visualization of genome-wide association scan results. Bioinformatics, 26, 2336–2337. [DOI] [PMC free article] [PubMed] [Google Scholar]
- 37. Wakefield J. (2007) A Bayesian measure of the probability of false discovery in genetic epidemiology studies. Am. J. Hum. Genet., 81, 208–207. [DOI] [PMC free article] [PubMed] [Google Scholar]
- 38. Illumina. (2006) Technical Bulletin: Whole-Genome Genotyping with the Sentrix HumanHap550 Genotyping BeadChip and the Infinium II Assay. Illumina, Inc, San Diego, CA. [Google Scholar]
- 39. Siepel A., et al. (2005) Evolutionarily conserved elements in vertebrate, insect, worm, and yeast genomes. Genome Res., 15, 1034–1050. [DOI] [PMC free article] [PubMed] [Google Scholar]
- 40. Ng P.C., et al. (2003) SIFT: predicting amino acid changes that affect protein function. Nucleic Acids Res., 31, 3812–3814. [DOI] [PMC free article] [PubMed] [Google Scholar]
- 41. Johnson A.D., et al. (2008) SNAP: a web-based tool for identification and annotation of proxy SNPs using HapMap. Bioinformatics, 24, 2938–2939. [DOI] [PMC free article] [PubMed] [Google Scholar]
- 42. Storey J.D., et al. (2003) Statistical significance for genomewide studies. Proc. Natl Acad. Sci. USA, 100, 9440–9445. [DOI] [PMC free article] [PubMed] [Google Scholar]
- 43. Hindorff L.A., et al. (2009) Potential etiologic and functional implications of genome-wide association loci for human diseases and traits. Proc. Natl Acad. Sci. USA, 106, 9362–9367. [DOI] [PMC free article] [PubMed] [Google Scholar]
- 44. Wakefield J. (2008) Reporting and interpretation in genome-wide association studies. Int. J. Epidemiol., 37, 641–653. [DOI] [PubMed] [Google Scholar]
- 45. Wakefield J. (2009) Bayes factors for genome-wide association studies: comparison with P-values. Genet. Epidemiol., 33, 79–86. [DOI] [PubMed] [Google Scholar]
- 46. Brenner D.R., et al. (2013) Hierarchical modeling identifies novel lung cancer susceptibility variants in inflammation pathways among 10,140 cases and 11,012 controls. Hum. Genet., 132, 579–589. [DOI] [PMC free article] [PubMed] [Google Scholar]
- 47. Greenland S. (1993) Methods for epidemiologic analyses of multiple exposures: a review and comparative study of maximum-likelihood, preliminary-testing, and empirical-Bayes regression. Stat. Med., 12, 717–736. [DOI] [PubMed] [Google Scholar]
- 48. Mägi R., et al. (2010) GWAMA: software for genome-wide association meta-analysis. BMC Bioinform., 11, 288. [DOI] [PMC free article] [PubMed] [Google Scholar]
- 49. Imielinski M., et al. (2012) Mapping the hallmarks of lung adenocarcinoma with massively parallel sequencing. Cell, 150, 1107–1120. [DOI] [PMC free article] [PubMed] [Google Scholar]
- 50. Hammerman P.S., et al. (2012) Comprehensive genomic characterization of squamous cell lung cancers. Nature, 489, 519–525. [DOI] [PMC free article] [PubMed] [Google Scholar]
- 51. Govindan R., et al. (2012) Genomic landscape of non-small cell lung cancer in smokers and never-smokers. Cell, 150, 1121–1134. [DOI] [PMC free article] [PubMed] [Google Scholar]
- 52. Pruunsild P., et al. (2005) Structure, alternative splicing, and expression of the human and mouse KCNIP gene family. Genomics, 86, 581–593. [DOI] [PubMed] [Google Scholar]
- 53. Bonne A., et al. (2007) Mapping of constitutional translocation breakpoints in renal cell cancer patients: identification of KCNIP4 as a candidate gene. Cancer Genet. Cytogenet., 179, 11–18. [DOI] [PubMed] [Google Scholar]
- 54. Rossner P., Jr, et al. (2006) Relationship between urinary 15-F2t-isoprostane and 8-oxodeoxyguanosine levels and breast cancer risk. Cancer Epidemiol. Biomark. Prev., 15, 639–644. [DOI] [PubMed] [Google Scholar]
- 55. Himes B.E., et al. (2013) Integration of mouse and human genome-wide association data identifies KCNIP4 as an asthma gene. PLoS One, 8, e56179. [DOI] [PMC free article] [PubMed] [Google Scholar]
- 56. Rosenberger A., et al. (2012) Asthma and lung cancer risk: a systematic investigation by the International Lung Cancer Consortium. Carcinogenesis, 33, 587–597. [DOI] [PMC free article] [PubMed] [Google Scholar]
- 57. Tashiro K., et al. (2009) GAREM, a novel adaptor protein for growth factor receptor-bound protein 2, contributes to cellular transformation through the activation of extracellular signal-regulated kinase signaling. J. Biol. Chem., 284, 20206–20214. [DOI] [PMC free article] [PubMed] [Google Scholar]
- 58. Zollner S., et al. (2007) Overcoming the winner’s curse: estimating penetrance parameters from case-control data. Am. J. Hum. Genet., 80, 605–615. [DOI] [PMC free article] [PubMed] [Google Scholar]
- 59. Boyle A.P., et al. (2012) Annotation of functional variation in personal genomes using RegulomeDB. Genome Res., 22, 1790–1797. [DOI] [PMC free article] [PubMed] [Google Scholar]
- 60. Ward L.D., et al. (2012) HaploReg: a resource for exploring chromatin states, conservation, and regulatory motif alterations within sets of genetically linked variants. Nucleic Acids Res., 40, D930–D934. [DOI] [PMC free article] [PubMed] [Google Scholar]
- 61. Schaub M.A., et al. (2012) Linking disease associations with regulatory information in the human genome. Genome Res., 22, 1748–1759. [DOI] [PMC free article] [PubMed] [Google Scholar]
- 62. Hung R.J., et al. (2008) International Lung Cancer Consortium: pooled analysis of sequence variants in DNA repair and cell cycle pathways. Cancer Epidemiol. Biomark. Prev., 17, 3081–3089. [DOI] [PMC free article] [PubMed] [Google Scholar]
- 63. Maurano M.T., et al. (2012) Systematic localization of common disease-associated variation in regulatory DNA. Science, 337, 1190–1195. [DOI] [PMC free article] [PubMed] [Google Scholar]
- 64. GTEx Consortium. (2013) The Genotype-Tissue Expression (GTEx) project. Nat. Genet., 45, 580–585. [DOI] [PMC free article] [PubMed] [Google Scholar]
- 65. Cancer Genome Atlas Research Network. (2012) Comprehensive genomic characterization of squamous cell lung cancers. Nature, 489, 519–525. [DOI] [PMC free article] [PubMed] [Google Scholar]
- 66. Pan W., et al. (2015) Testing for polygenic effects in genome-wide association studies. Genet. Epidemiol., 39, 306–316. [DOI] [PMC free article] [PubMed] [Google Scholar]
- 67. Knight J., et al. (2011) Using functional annotation for the empirical determination of Bayes Factors for genome-wide association study analysis. PLoS One, 6, e14808. [DOI] [PMC free article] [PubMed] [Google Scholar]
- 68. Johansson M., et al. (2012) Using prior information from the medical literature in GWAS of oral cancer identifies novel susceptibility variant on chromosome 4—the AdAPT method. PLoS One, 7, e36888. [DOI] [PMC free article] [PubMed] [Google Scholar]
- 69. Sun L., et al. (2012) Multiple apical plasma membrane constituents are associated with susceptibility to meconium ileus in individuals with cystic fibrosis. Nat. Genet., 44, 562–569. [DOI] [PMC free article] [PubMed] [Google Scholar]
Associated Data
This section collects any data citations, data availability statements, or supplementary materials included in this article.