

Supplemental Digital Content is available in the text
Abstract
This study aims to validate blood pressure (BP) values measured by an oscillometric BP monitor and seek possible calibration methods if discrepancies exist.
Noninvasive BP measurement outcomes were determined using an oscillometric BP monitor (Omron HBP-1300) versus a mercury sphygmomanometer (standard device). Two percent of subjects enrolled in an epidemiological investigation were systematically sampled in this study. Intraclass correlation coefficient (ICC) was used to evaluate measurement reliability, paired t-test was used to evaluate trueness, and linear regression was used for calibration. The Association for the Advancement of Medical Instrumentation (AAMI) standards and British Hypertension Society (BHS) protocols were used for validation quality assessment.
Both mercury sphygmomanometer (standard device) and oscillometric BP monitor (test device) displayed high reliability. A significant difference in systolic blood pressure (SBP) was observed between devices. SBP calibration was achieved by using an effective linear regression model (B = 0.803 and constant = 19.592, P < 0.001). The calibrated model was corroborated by verification samples (P = 0.120) and was found to pass AAMI standards and BHS protocol requirements.
Calibrated SBP measurements from the Omron HBP-1300 device were valid. Use of a combination of statistical methods, such as ICC for reliability assessment as well as paired t-test for trueness evaluation can be used to validate data from the oscillometric BP monitors.
INTRODUCTION
Accurate blood pressure (BP) measurements are essential for classifying individuals at increased risk for diseases affected by BP, as well as for appropriately managing these cases. In the past few years, oscillometric BP monitors have steadily replaced mercury sphygmomanometers for BP measurement in clinics and hospitals. Due to its ease of use or portability, fast data acquisition, and intuitive advantage, oscillometric BP monitors have been avidly used for BP measurement in clinical trials, epidemiological studies, and long-term outcome studies.1,2
However, many studies have shown discrepancies between oscillometric BP monitor and mercury sphygmomanometer measurements.3,4 Among various oscillometric devices in the market, less than 10% of these devices have been independently evaluated for accuracy.5 It was proposed that before these devices fully replace standard devices, it is important to ensure that these new devices confirm with recommended validation protocols, especially since healthcare facilities utilize mercury sphygmomanometers as the “gold standard” and maintain mercury levels to ensure proper calibration. To date, the World Health Organization has not yet published any validation guidelines for these new devices. The two most widely used validation protocols include British Hypertension Society (BHS) protocols and standards developed by the Association for the Advancement of Medical Instrumentation (AAMI).6,7 Interestingly, both organizations have different validation criteria; and from time to time, opposite recommendations have appeared.8,9 In these instances, it is not easy to reconcile these discrepancies for certain criteria. Thus, it is becoming increasingly clear that performing quality control assessments on the validity of oscillometric BP measurements are important.
In this study, we aim to validate the reliability of oscillometric BP monitors for BP measurement through statistical analysis methods based on a predesigned quality control program in a survey on prevalence of hypertension in China. BP was measured with the Omron HBP-1300 Professional Portable Blood Pressure Monitor (Omron, Kyoto, Japan) and a mercury sphygmomanometer (Yutu, Shanghai Medical Instruments Co., Ltd., Shanghai, China).
SUBJECTS AND METHODS
Subject Recruitment
This study is a part of the survey on prevalence of hypertension in China supported by the National Key R&D Program in the Twelfth Five-year Plan (No. 2011BAI11B01) from the Chinese Ministry of Science and Technology. Permanent residents over the age of 15-years old were recruited in this general cross-sectional epidemiological investigation using a random sampling method stratified with gender and area.10 Participants were obtained from the residential list. For urban and rural areas, the sample size required was 1900 in each district. BP was assessed in all of the participants with an Omron HBP-1300 BP monitor. In addition, each participant received a brief physical examination and answered a questionnaire. Based on the sample, 2% was assigned as the number series. Their BP was measured using both the Omron device and a mercury sphygmomanometer, which was taken to validate the BP monitor and for BP quality control for the overall epidemiological investigation.
Recruitment for the study took place in the Henan province during 2 main periods, with the first stage in 2013 and the second stage in 2014. Participants (n = 72) in the first stage were recruited from the Xingyang County of Zhengzhou City and the Jinshui district of Zhengzhou City to validate the oscillometric BP monitor against the mercury sphygmomanometer. Participants (n = 106) in the second stage were recruited from the Lushan County of Pingdingshan City, Luolong district of Luoyang City, and Gushi County of Xinyang city to corroborate the calibrated model attained among the first stage population (Supplementary Table 1, http://links.lww.com/MD/A401).
Quality Control Procedure for BP Measurement
Mercury sphygmomanometers (Yutu Brand) and oscillometric BP monitors (Omron HBP-1300) were used by the national program control center. Standard arm cuffs (140–480 mm) suitable for arm circumferences ranging from 22 to 32 cm were supplied, and large cuffs were also available for arm circumferences ranging from 32 to 42 cm.
BP was measured 3 times on the right arm supported at heart level after the participant is sitting at rest for 5 minutes, with 30 seconds between each measurement. A suitable cuff for the Omron HBP-1300 BP monitor was placed over the subject's bare arm, leaving the cuff's lower edge approximately 1 inch above the cubital fossa. A “Y” shaped tube was connected to the cuff, which enabled both the Omron HBP-1300 BP monitor and the mercury sphygmomanometer to be utilized simultaneously with the same measuring cuff. The stethoscope was placed on the side of the cuff away from heart and over the brachial artery, which is located in the inner cubital fossa. Two trained observers were assigned to measure the BPs of the subjects. Importantly, observers were blinded from each other's BP results. The 1st Korotkoff sound for systolic blood pressure (SBP) and the 5th Korotkoff phase (absence of sounds) for diastolic blood pressure (DBP) were used in auscultation sphygmomanometry.11 Three measurements were taken from each subject, and a pause of no less than 1 minute was taken between measurements. Measurements were taken twice when there were discrepancies between SBP or DBP values. For example, measurements were repeated if there was a difference greater than 4 mmHg with the mercury sphygmomanometer or 10 mmHg with the oscillometric BP monitor.12 All procedures were performed under a supervisor, who was also responsible for filling up the quality control form.
This study was approved by the Ethical Committee of the Chinese Ministry of Science and Technology.
Statistical Analysis
Statistical analyses were performed in 3 stages. Firstly, accuracy and precision was assessed with paired-sample t-test and intraclass correlation coefficients (ICCs), respectively. Repeated measures analysis of variance was used to assess time effects on BP values. Secondly, a linear regression model was used to calibrate mean SBP deviation. Finally, we assessed the calibrated model using a separate group of 106 subjects. All reported P-values were 2-sided, and P-values less than 0.05 were considered statistically significant. Data were collected and checked with EpiData (v3.1) and statistical analysis was performed using SPSS software (v21.0).
Validation Criteria of AAMI Standards and BHS Protocols
Oscillometric BP monitor measurements taken before and after calibration were assessed with AAMI standards and BHS protocols.
BHS protocols are classified in terms of ABCD levels with grades representing the cumulative percentage of readings falling within 5, 10, and 15 mmHg mercury standards. All 3 percentages must be greater than or equal to values shown for a specific grade to be awarded. A minimum grade of B must be achieved for both systolic and diastolic measurements to be considered valid. Awarded values are as follows: 60, 85, and 95, respectively, for grade A; 50, 75 and 90, respectively, for grade B; and 40, 65, and 85, respectively, for grade C. Grade D denotes a grade worse than C.9
The criteria for fulfilling AAMI standards (Virginia, 2009) is that measurements from the test device must not differ from the standard device by a mean difference >5 mmHg or a standard deviation >8 mmHg.
Sample Size Estimation
The study was designed as a paired t-test. Estimation of sample size was justified using the following formula:
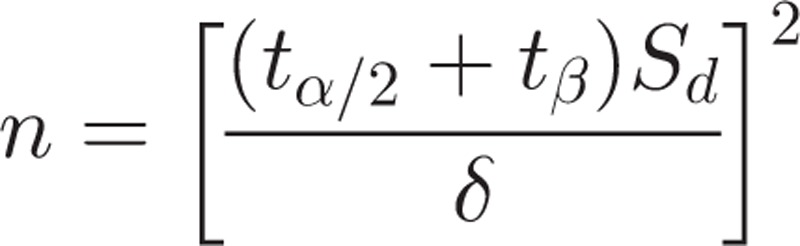 |
We assumed that α = 0.05 and β = 0.10. Sd and δ were set to 8 and 5, respectively, according to AAMI standards (Virginia, 2009). The sample size was calculated as 27. When we assessed for differences between gender and hypertension history, we needed to double our sample size to 54. Based on subject recruitment and data, we chose n = 72 to validate the oscillometric BP monitor. The remaining subjects (n = 106) were chosen for the second stage of the study, which was to corroborate the calibrated model.
Nonstandard Abbreviations
Variables were defined as follows for ease of analysis: “A” refers to the Omron HBP-1300, “B” refers to mercury sphygmomanometer, and “M” denotes the mean value of the 3 measurements. Thus, SBPA1, SBPA2, and SBPA3 denote the 1st, 2nd, and 3rd systolic measurements taken by using the Omron HBP-1300; while SBPB1, SBPB2, and SBPB3 denote the 1st, 2nd, and 3rd systolic measurements taken by using a mercury sphygmomanometer, respectively. Accordingly, DBPA1, DBPA2, and DBPA3 denote the 3 diastolic measurements taken by using the Omron HBP-1300; while DBPB1, DBPB2, and DBPB3 denote the 3 diastolic measurements taken by using a mercury sphygmomanometer. MSBPA and MDBPA denote the mean SBP and DBP values of the 3 repeated measurements taken using the Omron HBP-1300, while MSBPB and MDBPB denote the mean SBP and DBP values taken using a mercury sphygmomanometer, respectively.
RESULTS
Accuracy Analysis of BP Measurements
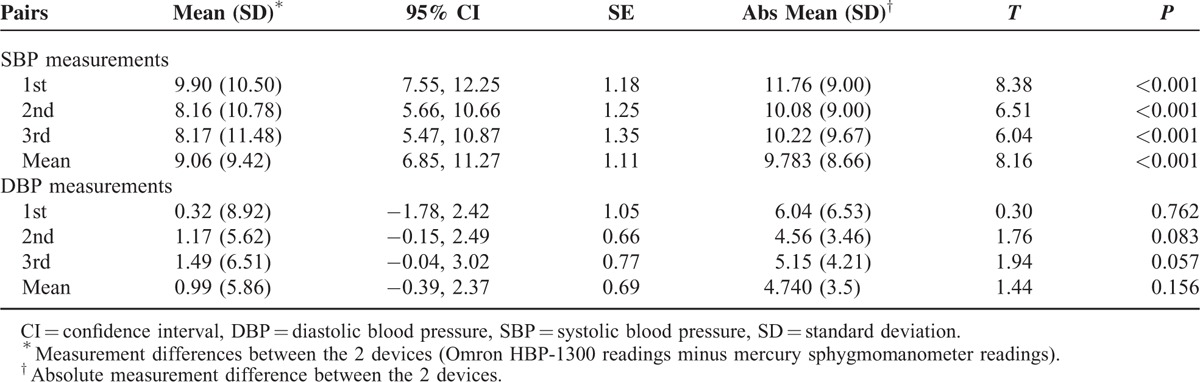
Measurement differences between the Omron HBP-1300 and mercury sphygmomanometer in each SBP pair using the paired t-test are shown in Table 1. All 3 SBP pairs and the mean SBP pair revealed significant differences (P < 0.001), but all DBP pairs did not have any significant difference (P > 0.05). Mean SBP difference (standard deviation) between these 2 devices was 9.06 ± 9.42 mmHg, while mean DBP difference between these 2 devices was 0.99 ± 5.86 mmHg.
TABLE 1.
Paired t-Test Analysis of Differences in Blood Pressure Measurements Between the Omron HBP-1300 and Mercury Sphygmomanometer (n = 72)
Analysis of Differences in Absolute BP Measurements
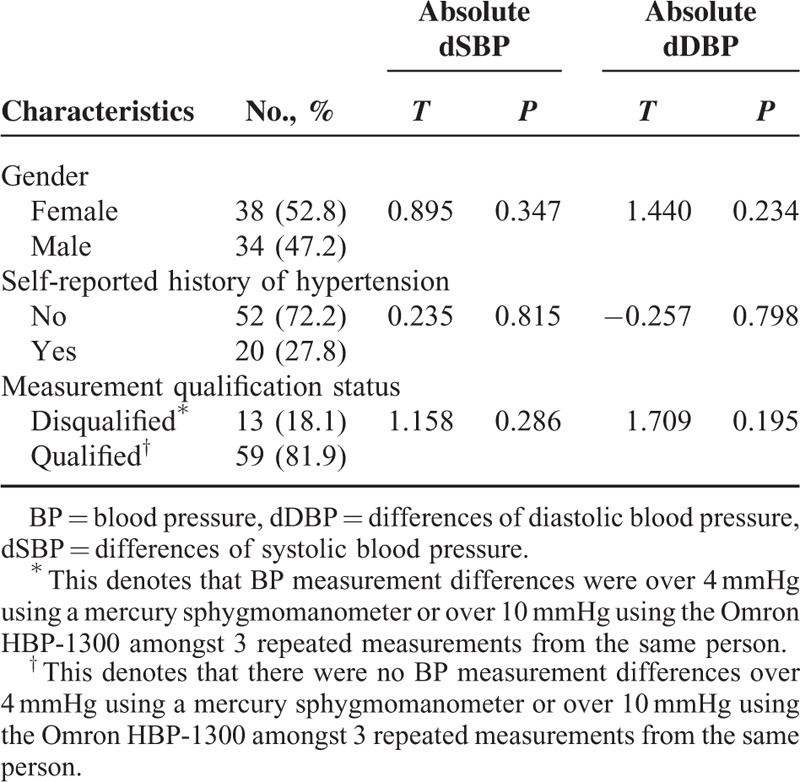
Seventy two subjects were enrolled in this study including 38 (52.8%) females and 34 (47.2%) males, and subjects had an average age of 54.50 ± 10.45-years old. A history of hypertension was self-reported by the participants, but was based on the diagnosis by professionals in the community hospitals. The history was reported in 20 (28.2%) subjects, and 52 (71.8%) subjects denied a hypertension history. Thirteen of 72 subjects failed to satisfy data quality control requirements; wherein, BP measurement differences of the 3 repeated measurements taken from the same person were more than 4 mmHg using a mercury sphygmomanometer or more than 10 mmHg using the Omron HBP-1300, even though another 3 repeated measurements were taken. Absolute BP measurement differences were analyzed between these 2 devices under the stratified demographic characteristics of subjects with a crosstab. Results revealed that these differences did not relate to age, gender, or general BP levels. Data qualification status did not affect BP deviation (Table 2).
TABLE 2.
Stratified Analysis of Blood Pressure Differences in Particpants With Certain Characteristics (n = 72)
Repeated Measures Analysis of BP Measurement Differences
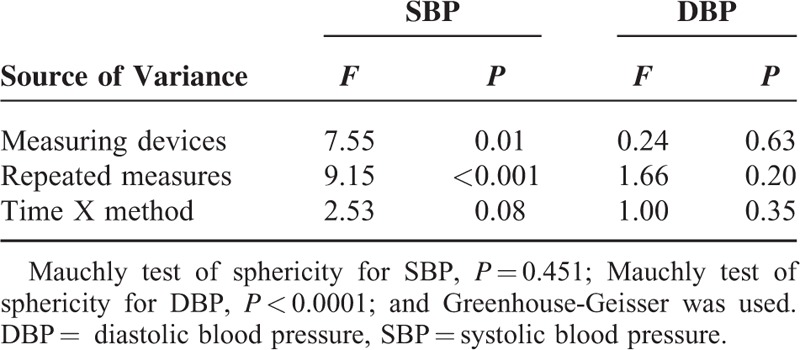
Repeated measures analysis of variance was used to explore whether there were differences among the 3 repeated measurements and whether measuring times were related to BP measurement differences. We demonstrated that there were significant differences in SBP between devices (P = 0.01), which was more apparent with each repeated measurement (P < 0.001). In contrast, no statistical differences were observed for DBP between devices (P = 0.63) or repeated measures (P = 0.20). Both SBP and DBP repeated measures did not affect BP measurement differences between devices; that is, there were no interactions between time effects and methods (Table 3).
TABLE 3.
Repeated Measures Analysis of the 3 Repeated Blood Pressure Measurements Using Both Devices
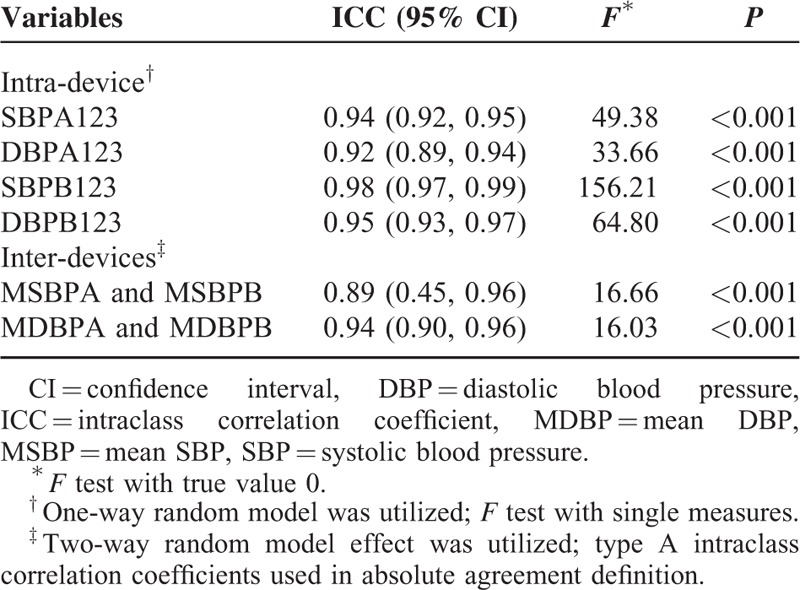
Reliability Assessment of BP Measurements
ICC is a good indicator for assessing reliability of quantitative data. ICC of SBP and DBP measurements using the Omron HBP-1300 were 0.94 and 0.92, respectively, while ICC of SBP and DBP measurements using a mercury sphygmomanometer were 0.98 and 0.95, respectively. Reliability values between the Omron HBP-1300 and mercury sphygmomanometer were 0.87, 0.88, and 0.87 for each SBP measurement, respectively, and 0.87, 0.95, and 0.92 for each DBP measurement, respectively (Table 4). ICC for mean SBP and DBP measurements were 0.89 and 0.94, respectively. These models were tested for efficacy (all P values were <0.001), as shown in Table 4.
TABLE 4.
Reliability Assessment of Measurements Within Each Device and Between Devices
SBP Calibration With the Omron HBP-1300 Device
Mean SBP was calculated based on 3 measurements. Mean systolic measurements with the Omron HBP-1300 (MSBPA) and mean systolic measurements with a mercury sphygmomanometer (MSBPB) both fitted a normal distribution (P = 0.32 and 0.85, respectively). The scatter graph suggested a linear correlation. MSBPA was used as the predictor and MSBPB was used as the dependent variable, with R as 0.891 and the adjusted R2 as 0.792. The regression model was constructed as MSBPB = 0.803 × MSBPA + 19.592 (Figure 1). The unstandardized coefficient B and constant were tested for statistical significance (P < 0.001 and 0.008, respectively). The residuals of linear regression of SBP measurements are presented in Figure 2.
FIGURE 1.
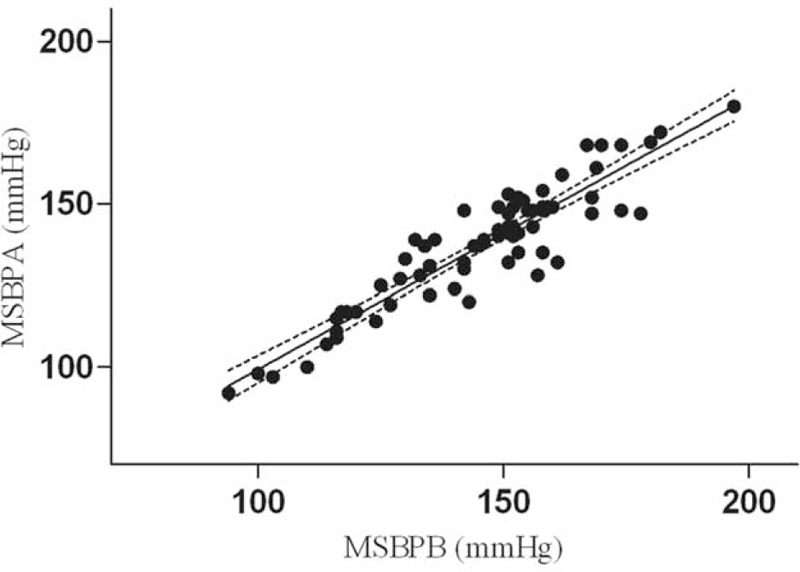
Scatter plot of systolic blood pressure (SBP) measurements with 2 instruments.
FIGURE 2.

Residuals of linear regression of systolic blood pressure (SBP) measurements.
Evaluation of the Calibrated Model Through Population Confirmation and Current Standards
We first assessed SBP using the calibrated model by exploiting the validation set (n = 106). The characteristics of the participants are listed in Supplementary Table 2, http://links.lww.com/MD/A401. Paired t-test analysis confirmed the validity of the calibrated model, and the difference was statistically significant between devices before calibration (P < 0.001); but no difference was found after calibration (P = 0.120, Table 5).
TABLE 5.
Analysis of BP Differences Before and After Calibration by Paired t-Test, AAMI Standards and BHS Protocol (n = 106)
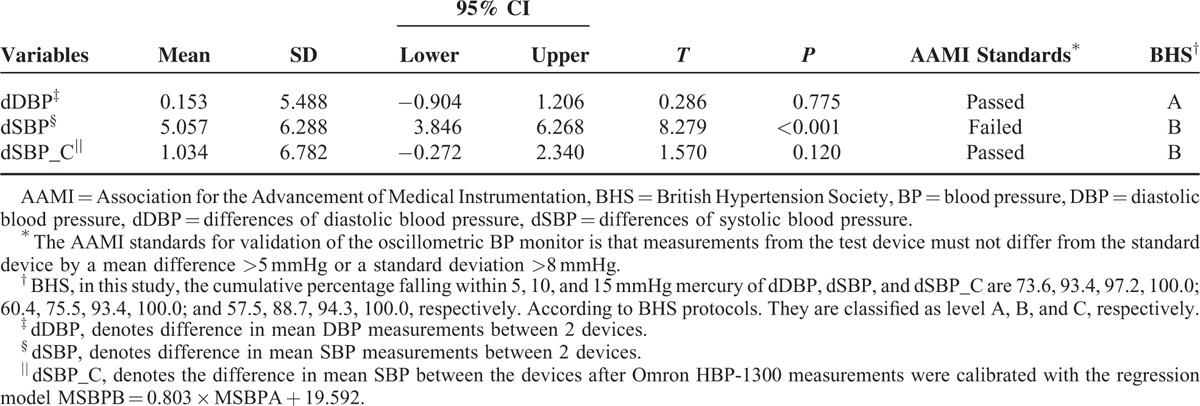
Further evaluation was performed against AAMI standards and BHS protocols. The AAMI standards for validation of the oscillometric BP monitor is that measurements from this test device must not differ from the standard device by a mean difference of >5 mmHg or a standard deviation of >8 mmHg. In the verification group, mean differences and standard deviations between both devices were 5.057 (6.288) before calibration and 1.034 (6.782) after calibration. As a result, the device failed to pass AAMI standards before calibration but passed after calibration.
According to BHS protocols,9 the differences in measurements of DBP between the test device and the standard device (dDBP) in the verification group are classified in terms of A (the cumulative percentage of differences falling within 5, 10, and 15 mmHg are 73.6, 93.4, 97.2, and the awarded values are 60, 85, 95); the differences of SBP (dSBP) are classified in terms of B (the cumulative percentage of differences are 60.4, 75.5, 93.4, and the awarded values are 50, 75, 90); and the differences of SBP after calibration (dSBP_C) are also classified in terms of B (the cumulative percentage of differences are 57.5, 88.7, 94.3, and the awarded values are 50, 75, 90, Table 5). These results suggested that the Omron HBP-1300 was valid under BHS protocols before and after calibration.
In general, we showed that the Omron HBP-1300 exhibited no significant differences to the standard device after calibration. However, it failed to pass AAMI standards before calibration, but met both AAMI and BHS protocols standards after calibration.
DISCUSSION
This study validated the use of the Omron HBP-1300 for BP measurement in both accuracy and precision perspectives, and constructed a calibration model that allows for verification against “gold standard” devices using a step-by-step process. We showed that these BP measurements are valid and comparable to the mercury sphygmomanometry. This process was achieved by using a series of statistical analyses that were independent of AAMI standards and BHS validation protocols. To the best of our knowledge, this is the first comprehensive study that validated and calibrated an oscillometric BP monitor against mercury sphygmomanometry.
First, we propose a precision assessment as well as a trueness evaluation when validating medical devices. According to ISO 5725-1, “The general term ‘accuracy’ is used to describe the closeness of measurement to the true value. This term is applied to sets of measurements of the same measure, and it involves a component of random error and a component of systematic error. In this case, trueness is the closeness of the mean of a set of measurement results to the actual (true) value, and precision is the closeness of agreement among a set of results.” We make clear that an oscillometric BP monitor can be considered valid or accurate if it is in both trueness and precision. A measurement system can be accurate but not precise, precise but not accurate, neither, or both.13–16 However, current protocols and most previous studies appear more closely focused on trueness and less focused on precision for validating digital BP monitors.
Precision is an important part of accuracy for medical measuring devices. A measure is said to have high reliability if it produces similar results under consistent conditions. Reliability is classically established through an internal consistency test, Cronbach alpha for qualitative data, and ICC for quantitative data. Reliability analysis ensures the sets of related values and compares related measurements between reference and target instruments. It is generally considered that reliability is good when ICC is above 0.75.17,18 In a previous study by Bland and Altman,19 the denied relation coefficient (r) was used as the statistical method for assessing the agreement between 2 methods of clinical measurements. We agreed to these types of methods and suggested ICC as the appropriate statistical method, because it could estimate reliability in several general classes including test-retest reliability, intrarater reliability, and internal consistency reliability, which altogether satisfy BP monitor validating requirements quite well. Although ICC is scarcely used in BP monitor validation, reliability analysis has been performed when assessing an agreement of a medical device against another “gold standard” device, as shown in previous studies.20–22
Secondly, we recommend the use of statistical methods for validating oscillometric BP monitors and bear the chance to correct it. Based on the current design of this validation program, paired t-test is suitable for applications involving trueness assessment, while reliability analysis is suitable for precision analysis. Most studies use AAMI standards and BHS protocols to validate oscillometric BP monitors. However, BHS criteria seem more qualitative, as grades are classified by specific figures awarded, which could generate more from experiences or observations than scientific evidence. AAMI standards use statistical methods that validate BP measurements for accuracy or trueness except for precision, which means that we assess less for the characteristics of BP devices. As a result, we lose the chance to calibrate discrepancies under excellent precision, which would be invaluable for manufacturers.
Our study further suggests a calibration method for measuring deviation, if a device demonstrates a good agreement to a “standard” device. A device could also be calibrated based on good reliability. In our study, we have shown data that met the requirements of linear regression analysis (linear correlation, independent and normal distribution, and equal variance). Accordingly, the regression model was constructed as MSBPB = 0.803 × MSBPA + 19.592, which was verified by a verification data set. A possibility has been proposed that this algorithm and experimentally obtained coefficients could be used to adjust oscillometric results to give readings that match auscultatory results.22,23 Thus, this computational formula is key in calibrating a device after being used or providing an intelligent correction inside the monitor.24,25
This study has a series of advantages. A particular strength is that we were able to obtain simultaneous measurements with 2 devices, and paired t-test analysis eliminated the time effects of BP measurement differences. Another important strength of this study is that we used the same cuff for both devices, which greatly decreased systematic error. In addition, we demonstrated that SBP and repeated 30 seconds interval measurements were sensitive to the measuring device. We believe the reason for these BP fluctuations most likely stems from mild psychological changes, since BP is a complicated and sensitive variable. The effects have been similarly observed for the white-coat effect.26
A limitation of our study is that we mainly focused on the general validation of the Omron HBP-1300 against the mercury BP sphygmomanometer, as opposed to using an extensive stratified factor analysis. Thus, it will be valuable to stratify various characteristics such as birthplace, race, smoking history, and various stages of hypertension to reach robust and convincing conclusions on the influencing factors in future studies. It would also be interesting to validate the new index (regression model) to diagnose hypertension through the ROC methodology and determine the best cut-off point, which could be applied to blood pressure control.
To summarize, we validated the Omron HBP-1300 BP monitor against a mercury sphygmomanometer, and calibrated it based on its good reliability. Furthermore, we propose the use of reliability assessments aside from trueness evaluation, and a chance for calibration in order to validate oscillometric BP monitors.
Acknowledgments
The authors thank the officers at the Academy of Medical Sciences of Henan Province for coordinating and organizing the early stages of this investigation. The authors also thank all personnel at the Jinshui and Xingyang Community Administration for calling the selected participants in the field studies, all team members for their participation in this epidemiology investigation, and Medjaden Bioscience Limited for their assistance in language modification.
Footnotes
Abbreviations: AAMI = Association for the Advancement of Medical Instrumentation, BHS = British Hypertension Society, BP = blood pressure, DBP = diastolic blood pressure, ICC = intraclass correlation coefficient, SBP = systolic blood pressure.
KJW and XQC were responsible for the study concept, study design, and data interpretation. XQC performed the data analysis and wrote the paper. LLG helped in performing the statistical analysis. Wolde Bealo helped in reviewing the literature and revising the paper. XLC and YJX were responsible for field investigations. CHS was responsible for the quality control of performance. LLG, JXY and SYD were responsible for data assembly and archiving. All authors reviewed the manuscript and contributed up to the final submission.
The study was funded by the National Key R&D Program in the Twelfth Five-year Plan (No. 2011BAI11B01) from the Chinese Ministry of Science and Technology.
Supplement Digital content is available for this article.
The authors have no conflicts of interest to disclose.
Supplemental digital content is available for this article. Direct URL citations appear in the printed text and are provided in the HTML and PDF versions of this article on the journal's Website.
REFERENCES
- 1.Mengden T, Asmar R, Kandra A, et al. Use of automated blood pressure measurements in clinical trials and registration studies: data from the VALTOP Study. Blood Press Monit 2010; 15:188–194. [DOI] [PubMed] [Google Scholar]
- 2.Yusuf S, Teo KK, Pogue J, et al. Telmisartan, ramipril, or both in patients at high risk for vascular events. N Engl J Med 2008; 10: 358:1547–1559. [DOI] [PubMed] [Google Scholar]
- 3.Elliott WJ, Young PE, DeVivo L, et al. A comparison of two sphygmomanometers that may replace the traditional mercury column in the healthcare workplace. Blood Press Monit 2007; 12:23–28. [DOI] [PubMed] [Google Scholar]
- 4.Cho K, Tian M, Lan Y, et al. Validation of the Omron HEM-7201 upper arm blood pressure monitor, for self-measurement in a high-altitude environment, according to the European Society of Hypertension International Protocol revision 2010. J Hum Hypertens 2013; 27:487–491. [DOI] [PMC free article] [PubMed] [Google Scholar]
- 5.Cosentino ER, Rinaldi ER, Borghi C. Integrated management of cardiovascular risk. Clin Manage Issues 2008; 2:127–134. [Google Scholar]
- 6.O’Brien E, Atkins N, Stergiou G, et al. European Society of Hypertension International Protocol revision 2010 for the validation of blood pressure measuring devices in adults. Blood Press Monit 2010; 15:23–38. [DOI] [PubMed] [Google Scholar]
- 7.Stergiou GS, Karpettas N, Atkins N, et al. Impact of applying the more stringent validation criteria of the revised European Society of Hypertension International Protocol 2010 on earlier validation studies. Blood Press Monit 2011; 16:67–73. [DOI] [PubMed] [Google Scholar]
- 8.Adler C, Ellert U, Neuhauser HK. Disagreement of the two oscillometric blood pressure measurement devices, Datascope Accutorr Plus and Omron HEM-705CP II, and bidirectional conversion of blood pressure values. Blood Press Monit 2014; 19:109–117. [DOI] [PubMed] [Google Scholar]
- 9.O’Brien E, Waeber B, Parati G, et al. Blood pressure measuring devices: recommendations of the European Society of Hypertension. BMJ (Clin Res Ed) 2001; 3: 322:531–536. [DOI] [PMC free article] [PubMed] [Google Scholar]
- 10.Wang Z, Zhang L, Chen Z, et al. Survey on prevalence of hypertension in China: background, aim, method and design. Int J Cardiol 2014; 174:721–723. [DOI] [PubMed] [Google Scholar]
- 11.White WB, Berson AS, Robbins C, et al. National standard for measurement of resting and ambulatory blood pressures with automated sphygmomanometers. Hypertension 1993; 21:504–509. [DOI] [PubMed] [Google Scholar]
- 12.Omboni S, Riva I, Giglio A, et al. Validation of the Omron M5-I, R5-I and HEM-907 automated blood pressure monitors in elderly individuals according to the International Protocol of the European Society of Hypertension. Blood Press Monit 2007; 12:233–242. [DOI] [PubMed] [Google Scholar]
- 13.Taylor JR. An Introduction to Error Analysis: The Study of Uncertainties in Physical Measurements. Sausalito, California: University Science Books; 1997. [Google Scholar]
- 14.De Bievre P. The 2007 International Vocabulary of Metrology (VIM), JCGM 200:2008 [ISO/IEC Guide 99]: Meeting the need for intercontinentally understood concepts and their associated intercontinentally agreed terms. Clin Biochem 2009; 42:246–248. [DOI] [PubMed] [Google Scholar]
- 15.Potts PJ. Glossary of analytical and metrological terms from the international vocabulary of metrology (2008). Geostand Geoanal Res 2012; 36:231–246. [Google Scholar]
- 16.Ferard G, Pontet F, Giroud C, et al. Introducing the new international vocabulary of metrology. Ann Biol Clin-Paris 2009; 67:591–594. [DOI] [PubMed] [Google Scholar]
- 17.Shrout PE, Fleiss JL. Intraclass correlations: uses in assessing rater reliability. Psychol Bull 1979; 86:420–428. [DOI] [PubMed] [Google Scholar]
- 18.Pihuan J. Medical Statistics. Shanghai: Fudan University Press; 2003. [Google Scholar]
- 19.Bland JM, Altman DG. Statistical methods for assessing agreement between two methods of clinical measurement. Lancet 1986; 1986: 1:307–310. [PubMed] [Google Scholar]
- 20.Barnhart HX, Lokhnygina Y, Kosinski AS, et al. Comparison of concordance correlation coefficient and coefficient of individual agreement in assessing agreement. J Biopharm Stat 2007; 17:721–738. [DOI] [PubMed] [Google Scholar]
- 21.Kikuya M, Chonan K, Imai Y, et al. Accuracy and reliability of wrist-cuff devices for self-measurement of blood pressure. J Hypertens 2002; 20:629–638. [DOI] [PubMed] [Google Scholar]
- 22.Ho JC, Youderian A, Davidson IU, et al. Accuracy and reliability of postoperative radiographic measurements of glenoid anatomy and relationships in patients with total shoulder arthroplasty. J Shoulder Elbow Surg 2013; 22:1068–1077. [DOI] [PubMed] [Google Scholar]
- 23.Forouzanfar M, Ahmad S, Batkin I, et al. Coefficient-free blood pressure estimation based on pulse transit time-cuff pressure dependence. IEEE Trans Biomed Eng 2013; 60:1814–1824. [DOI] [PubMed] [Google Scholar]
- 24.Pickering TG, Hall JE, Appel LJ, et al. Recommendations for blood pressure measurement in humans and experimental animals – Part 1: blood pressure measurement in humans – A statement for professionals from the Subcommittee of Professional and Public Education of the American Heart Association Council on High Blood Pressure Research. Circulation 2005; 8: 111:697–716. [DOI] [PubMed] [Google Scholar]
- 25.Jones DW, Frohlich ED, Grim CM, et al. Mercury sphygmomanometers should not be abandoned: an advisory statement from the council for high blood pressure research, American Heart Association. Hypertension 2001; 37:185–186. [DOI] [PubMed] [Google Scholar]
- 26.Sabater-Hernandez D, de la Sierra A, Sanchez-Villegas P, et al. Magnitude of the white-coat effect in the community pharmacy setting: The MEPAFAR Study. Am J Hypertens 2011; 24:887–892. [DOI] [PubMed] [Google Scholar]