Abstract
Myocardial perfusion imaging (MPI) using slow rotating large field of view cameras requires spatiotemporal reconstruction of dynamically acquired data to capture the time variation of the radiotracer concentration. In vivo, MPI contains additional degrees of freedom involving unavoidable motion of the heart due to quasiperiodic beating and the effects of respiration, which can severely degrade the quality of the images. This work develops a technique for a single photon emission computed tomography (SPECT) that reconstructs the distribution of the radiotracer concentration in the myocardium using a tensor product of different sets of basis functions that approximately describe the spatiotemporal variation of the radiotracer concentration and the motion of the heart. In this study the temporal B-spline basis functions are chosen to reflect the dynamics of the radiotracer, while the intrinsic deformation and the extrinsic motion of the heart are described by a product of a discrete set of Gaussian basis functions. Reconstruction results are presented showing the dynamics of the tracer in the myocardium as it deforms due to cardiac beating, and is displaced due to respiratory motion. These results are compared with the conventional 4D-spatiotemporal reconstruction method that models only the temporal changes of the tracer activity. The higher dimensional reconstruction method proposed here improves bias, yet the signal-to-noise ratio (SNR) decreases due to redistribution of the counts over the cardiac-respiratory gates. However, there is a trade-off between the number of gates and the number of projections per gate to achieve high contrast images.
Keywords: Myocardial perfusion imaging, dynamic SPECT, motion correction, higher dimensional reconstruction
I. Introduction
Non-invasive cardiac imaging using single photon emission computed tomography (SPECT) provides both diagnostic and prognostic assessment of patients suffering from coronary syndromes that include ischemia and myocardial dysfunction (Beller and Heede, 2011). In conventional studies using SPECT, generally a rest study followed by a stress study is performed. These studies are not performed dynamically, i.e., the data does not provide information on radiotracer kinetics; instead gated tomographic data are acquired 30 to 60 minutes after the injection of the radiotracer. Comparisons of the rest and stress scans provide information about ischemic heart disease and the gated images provide information about the wall motion which is important for diagnosing viable myocardium to identify patients that might benefit from revascularization. Dynamic imaging has been used for some time with PET to quantify myocardial blood flow (MBF) (Kuhle et al., 1992), (Di Carli et al., 1995), and recently some progress has also been made using dynamic SPECT (Gullberg et al., 2010), (Alhassen et al., 2013). Measuring coronary flow reserve (CFR) with PET manifests macro- and microvascular disease providing important prognostic value (Cremer et al., 2014). However, despite widespread applications, images from PET and SPECT suffer from undesirable motion artifacts due to cardiac beating, respiratory and/or patient’s movement leading to image degradation, blurring, and false positive diagnosis (Matsumoto et al., 2001). Even though several methods have been proposed (Parker et al., 2009), (Livieratos et al., 2005), (Rahmim et al., 2009), (Nam et al., 2013), (Bai and Brady, 2009), (Picard and Thompson, 1997), (Mukherjee et al., 2009), (Kovalski et al., 2007), in most cases cardiac motion due to respiration is difficult to handle especially when tracer kinetics is involved. For the dynamic cardiac SPECT application, there is the problem of analyzing tracer kinetic data acquired with a slowly rotating two-headed SPECT camera. In this paper, we demonstrate that it is possible to model all 6 dimensions of space, time, cardiac deformation, and cardiac respiratory motion from data acquired using a slowly rotating SPECT camera with only a few views per respiratory and cardiac gate.
Continuous cardiac beating and respiratory motion can result in up to a 2 cm displacement of the myocardium. Motion usually results in spatial blurring, image artifacts, and poor dissolution of perfusion related quantitative measurements such as MBF and CFR. These inaccuracies in the tomographic reconstruction impact the diagnostic accuracy of conventional myocardial perfusion imaging (MPI). The problem due to respiratory motion occurs not only in cardiac imaging, but also in the detection of small tumor lesions, and the therapeutic responses of external beam radiation can be severely affected (Shimizu et al., 2001). Motion artifacts can be reduced by gating the heart phases using an electrocardiogram (ECG), which is a standard clinical procedure for detecting the myocardium thickening and ventricular wall motion. The combined motion due to beating of the heart and respiration can be rectified by binning the list-mode data into projections of different cardiac-respiratory gates and reconstructing each gate separately (Kovalski et al., 2007). This is a powerful reconstruction approach in PET where all projection views can be acquired simultaneously in a list-mode format and can be used to reconstruct each cardiac or respiratory state (Nichols et al., 2002). Binning of the dynamic data in SPECT for the list mode reconstruction is also possible, however, because of the small number of detector heads and the rotation speed of the SPECT camera, it is difficult to obtain the necessary tomographic views in each cardiac and respiratory state.
The main goal of this study was to simultaneously model the continuous motion of the human heart and the distribution of the radiotracer for in situ MPI using a slowly rotating SPECT camera. The human heart for the application of dynamic SPECT MPI is modeled by incorporating the cardiac and respiratory motion in terms of spatiotemporal basis functions of the changing radiotracer concentration and basis functions corresponding to the cardiac and respiratory states of the heart. Spatiotemporal basis functions are the basic building blocks for modeling the variation of the radiotracer distribution in space and time (Reutter et al., 2000). Time-varying activity within a volume can be modeled by selecting a set of temporal basis functions that are capable of representing approximate local time variations and have desired smoothness properties. These functions may be splines, factor analysis of dynamic structures (FADS), curves that fit compartment models, polynomial expansions or other possible spectral decompositions (Gullberg et al., 2010). Similarly, the spatially nonuniform activity concentration within a particular volume can be modeled by selecting an appropriate set of spatial basis functions defined within the volume. These could also be splines, point clouds of tetrahedral elements, blobs, various types of polynomial expansions or indicator functions corresponding to voxels (Sitek et al., 2000), (Maltz, 2002), (Sitek et al., 2006), (Lewitt, 1990). On the other hand, the basis functions for the motion can be anything that optimally characterizes the internal degrees of freedom of the organ being considered. For instance, the motion of the heart can be characterized by some periodic functions that reflect the different cardiac phases. The number of basis functions and their spatial and temporal extents can also be varied so that they can optimally model the spatial and temporal content of the data with the fewest number of basis functions.
In this work, we formulated the reconstruction algorithm for the projection of dynamic cardiac SPECT data acquired by a slowly rotating camera using the tensor product of spatiotemporal basis functions and basis functions of the subspace of cardiac and respiratory phases and evaluated the algorithm using simulated data from the mathematical cardiac torso (MCAT) phantom. Usually slowly rotating in dynamic SPECT acquisition means that the rate of camera rotation is slower than the kinetics of the tracer i.e., the concentration of the tracer in the blood and heart is changing between projection views. This is particularly a problem during the early phase of the blood input but less so after the tracer has equilibrated. Our formulation is therefore somewhat more difficult than that developed for dynamic cardiac PET (Verhaeghe et al., 2007) because it takes into consideration the slowly rotating SPECT gamma camera as well as the additional degree of freedom due to the respiratory motion. We simultaneously solved a smooth time-varying distribution of the concentration of the tracer activity in each voxel in a given volume as the heart deformed and displaced due to cardiac and respiratory motion. We used the maximum likelihood expectation maximization (ML-EM) algorithm (Shepp and Vardi, 1982) for estimating the activity distribution. The ML-EM algorithm was successfully implemented in the past for modeling four-dimensional (4D) SPECT acquisition as well as for five-dimensional (5D) PET and (5D) SPECT acquisitions (Niu et al., 2010). Recently, we have also reported on a fully 5D reconstruction method using a continuous rotating SPECT system for dynamic MPI. In the implementation presented here, attenuation correction was explicitly incorporated into the system matrix (Gullberg et al., 1985), while the effect of scatter was neglected. We believe our approach of higher dimensional image reconstruction will provide a way to study tracer kinetics and dynamics in any organ that is subject to motion.
II. Theory
A. Spatiotemporal reconstruction in 4D
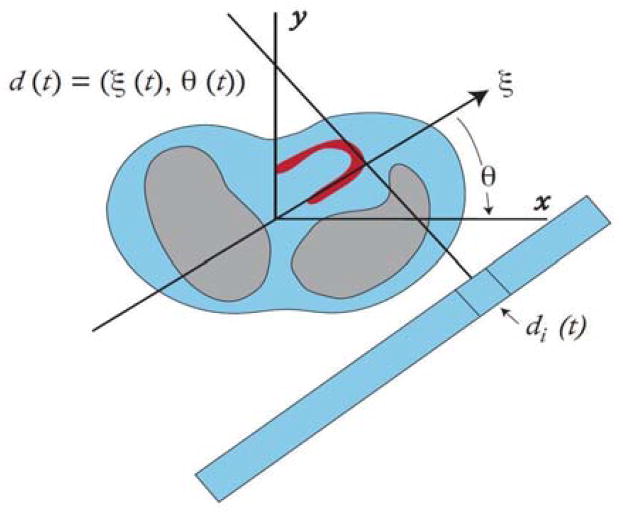
In dynamic cardiac SPECT using a slowly rotating gamma camera, a photon emitting radionuclide, e.g., technetium (Tc-99m) tagged to sestamibi or tetrofosmin, is infused into the patient’s vein and the emitted photons are detected and recorded continuously by the camera detector as it rotates (Fig. 1). The image of the detected photons, so called ‘projections’, contains the information of the kinetics and dynamics of the tracer as well as the motion of the heart. In a conventional four-dimensional (4D) spatiotemporal image reconstruction, the temporal change of the tracer is incorporated explicitly while the motion is neglected.
Fig. 1.
The SPECT detector is assumed to rotate continuously so that the detector coordinate d(t) has an angle θ(t) and a spatial coordinate ξ(t). The projection measurements pi(tk) are the activity acquired over the time period to tk to tk + Δt for the detector bin di(t).
The activity distribution of a radionuclide in the image space is represented by a function A(x,t), where x and t are the three dimensional volume and time coordinates, respectively. As a preliminary to our methodology, we show here how the formulation of image reconstruction in higher dimensions can be developed for 4D reconstruction. The activity distribution can be written as a tensor product of the spatiotemporal basis functions:
| (1) |
where Sm(x), m =1,2, … M, are the spatial and Vn(t), n =1,2, … N, are the temporal basis functions. The expansion coefficients amn provide the weights for each product of basis functions.
For the geometry of our acquisition scheme using continuous rotation shown in Fig. 1, the projection of the activity at any particular instant depends on the angular position of the detector. The detector is also pixelized so that for an arbitrary ith pixel, accumulation of the photons in a given small time interval Δtk at a time point tk is given by
| (2) |
where the spatiotemporal distribution of the activity is integrated along the line of projection in the image space χ. The weighting function F[x,di(t)] maps the activity from a position x in the image space into the projection at the detector position di(t). Expanding the activity in terms of the basis functions, the projections can be modeled as
| (3) |
with the definitions:
| (4) |
Generally, the projection data are recorded as individual events of radioactive emissions (list mode) or the accumulation of events in a detector bin di(t) over the acquisition time interval divided by the net interval so that the value at all time points are in terms of activity concentration in units of counts per unit time. The expression for the projection in Equation (3) can be generalized in terms of a matrix
| (5) |
where p is a (I × K)-element column vector, I being the total number of detector bins and K being the number of time points. F is the projection operator of dimensions (I × K × M×N) with matrix element
| (6) |
The matrix a of the coefficients of the expansion in Equation (1) that is to be estimated has the dimensions of (M × N). These coefficients can be estimated using either maximum likelihood or Bayesian formulation [27]. For a voxelized space, M corresponds to the total number of voxels in the reconstruction space and N, the number of temporal basis functions. For example, in a volume space of dimension 128×128×128 and a number of B-spline temporal basis functions of N = 13, the number of coefficients that are to be estimated is 128×128×128×13. Once these coefficients are estimated, the activity distribution in each voxel follows from Equation (1). In practice, the number of basis functions, N, is much smaller than the number of dynamic image frames, K.
B. Reconstruction in Higher Dimensions
In analogy, the formulation of image reconstruction in higher dimensions proceeds as described in the foregoing section. Here, we outline the general method of image reconstruction in a 6-dimensional space modeled by the tensor product of the basis functions in each dimension. In particular to the reconstruction of MPI, the measurement of the activity distribution in the heart is affected by cardiac beating, respiratory motion, and radiotracer kinetics. This can be represented by a general function A(x,t,τ(t), ζ(t)), where x is the spatial, t is the temporal, τ(t) is the cardiac phase coordinate due to beating of the heart, and ζ(t) is the cardiac displacement coordinate due to the respiratory motion. As before, we model the activity distribution in the myocardium as a tensor product of the spatiotemporal basis functions and the basis functions that represent the motion of the heart:
| (7) |
where Sm(x), m =1,2, … M, are the spatial and Vn(t), n =1,2, … N, are the temporal basis functions, while Wq(t), q = 1,2, … Q, and Rr(t), r = 1,2, … L, are basis functions corresponding to the cardiac and respiratory phases, respectively. Again, the expansion coefficients amnqr give the weights for each set of basis functions. The reconstruction problem thus involves the estimation of these coefficients.
Our formulation provides a particular representation of the activity concentration in parametric space to include smooth temporal changes of activity within the volume when the volume itself is moving in time, and so to provide the dynamic reconstruction in higher dimensions.
The projections of the activity in terms of the weighting function can be written as
| (8) |
Again substituting Equation (7) into Equation (8), the projections can be expanded as:
| (9) |
with the definitions:
| (10) |
The expression in Equation (9) can also be represented in matrix form as
| (11) |
where p is an (I × K × G × L)-element column vector, I being the total number of detector bins and K being the number of time points. Here, L is the number of respiratory gates, l =1,…,L, and G is the number of cardiac gates, g =1,…,G during the respective respiratory and cardiac cycles. The matrix operator F is of dimensions (I×K×G×L) (M×N× Q×R), and a is an (M×N×Q×R)-element column vector of unknown coefficients that are estimated by solving Equation (11). This is a 6D reconstruction problem where the elements of a are the estimated coefficients that determines the activity distribution A(x,t,τ(t), ζ(t)).
III. Methods
A. Cardiac Deformation (5D Reconstruction) – temporal, cardiac deformation, no respiratory motion simulated
1) Simulation of Data Acquisition
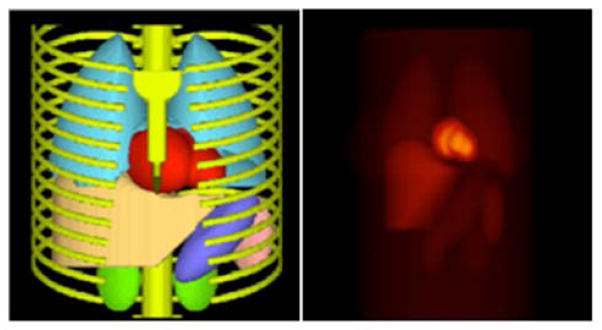
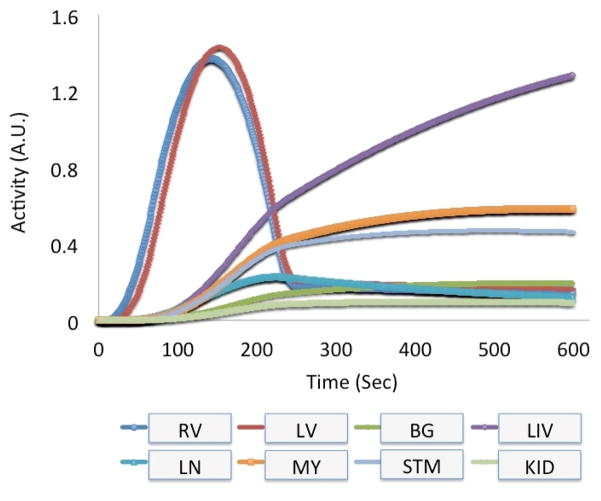
To evaluate our approach, the mathematical cardiac torso (MCAT) phantom (Fig. 2) was used to simulate the measurement of the time-varying activity distributions of the radiopharmaceutical and cardiac deformation due to cardiac beating and motion due to respiration. The time activity curves (TACs) for vital organs such as heart, lungs, liver, spleen, and several others such as stomach, kidney, and background tissue were measured or estimated and used to simulate activity distributions corresponding to one of the patients injected with the radiotracer 99mTc-tetrofosmin (99mTc, 140 keV) in our ongoing dynamic cardiac SPECT studies. The protocol consisted of starting the camera rotation followed by injection of 10 mCi of radiotracer and 10 ml flush of normal saline. Typical TACs obtained to simulate the projection data are shown in Fig. 3. The activity of the left ventricle (LV), right ventricle (RV), myocardium, liver and spleen were measured directly from the patient data. Activities of those organs such as stomach, kidney, and background tissue that were not visible in the reconstructed images were estimated using a 1-tissue compartment model by providing generic wash-in and wash-out kinetic parameters (Higley et al., 1993). Using these activities as input, the noise-free projection data sets were generated for the geometry of a commonly available dual-headed SPECT camera (Infinia Hawkeye 4, GE Healthcare).
Fig. 2.
Three-dimensional surface rendering of the MCAT phantom torso (left) and a coronal view of the radiotracer activity distribution in the vital organs of the phantom used in the simulations (right).
Fig. 3.
Measured and estimated time activity curves derived from one of the patients infused with the radiotracer 99mTc-tetrofosmin (99mTc, 140 keV) in one of our dynamic cardiac SPECT studies. The activity of the left ventricle (LV), right ventricle (RV), myocardium (MY), liver (LIV) and lung (LN) were measured directly from the patient’s data. Other activity for stomach (STM), kidney (KID) and background (BG) tissue (total of 16 organs in the MCAT phantom) were estimated using a 1-tissue compartment model by providing generic wash-in and wash-out kinetic parameters.
Although the activity was simulated for the entire torso as described above, we paid particular attention to the temporal changes of the tracer in the myocardium as it deformed and displaced by cardiac beating and respiratory motion. We considered a three-dimensional (3D) image space with 128×128×128 voxels each of 4.4 mm. Each detector surface was pixelized to a dimension of 128×128 with a pixel width of 4.4 mm. For imaging the MCAT phantom using parallel-hole collimator detector geometry, a system matrix was built which contained the information about the attenuation as well as the geometric point response of the parallel low-energy-high-resolution (LEHR) SPECT collimator. Attenuation was modeled for each projection image. It should be noted that the deformation of the myocardium and cardiac motion due to respiration changes the attenuation of the emitting photons in successive projection views. Incorporating the time dependent attenuation in the system matrix is complicated and the reconstruction would be challenging due to the dynamic nature of the system matrix. In order to avoid this difficulty, we considered an average attenuation so that the system matrix was time independent.
The projection data P at the detector position d(t) were obtained by applying the system matrix S to the MCAT phantom with a particular activity distribution O at a time t:
| (12) |
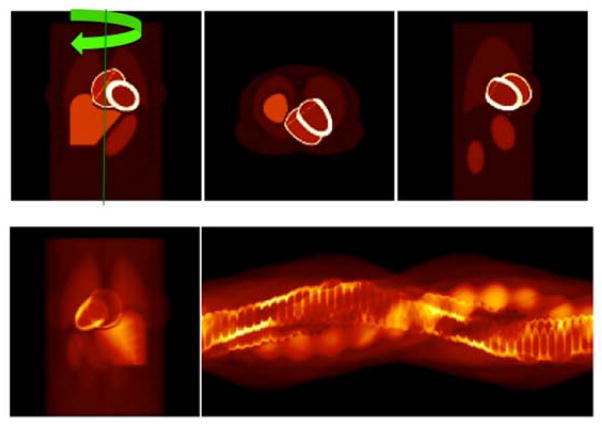
Figure 4 shows a typical activity distribution in the torso 4 minutes after the tracer injection and the corresponding projection images. The cardiac torso is placed in the supine position, and the axis of rotation of the detector head is shown for a patient aligned foot-to-head with the arrow indicating a clock-wise rotation.
Fig. 4.
(top row) A typical activity distribution for organs in the torso in three different orthogonal views (left: coronal, middle: transverse, and right: sagittal) after four minutes of a tracer injection. Also shown is the axis and direction of the rotation of the detector. (bottom row) A static noiseless projection at 90°-anterior view (left) and corresponding sinogram for one complete camera rotation (right).
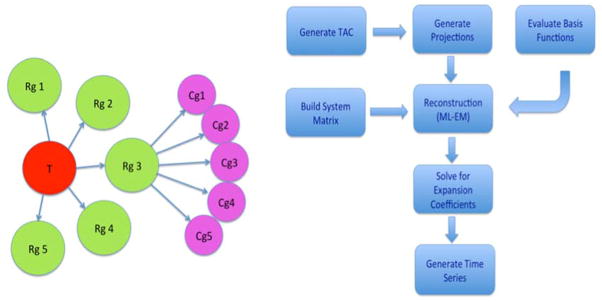
For the 5D case, the respiratory motion was turned off during the beating of the heart. The period of the cardiac cycle was 1 sec, and the duration between end-diastolic to the end-systolic phase was 0.325 sec. The camera rotation period was tuned in such a way that the projection data were synchronized, i.e., each projection corresponded to one gate of the cardiac cycle (See Fig. 5, left). There were 8-gates for each cardiac cycle (1 sec duration). There were 360 projections per rotation; and therefore the period of rotation was 45 sec. The total number of rotations was 8 that corresponded to 6 min duration of TAC (Fig. 3).
Fig. 5.
(Left) Tree diagram representing the grouping of temporal (T), respiratory (Rg), and cardiac (Cg) gates in the simulation of the data. For 5D, there were no respiratory gates. For 6D, the simulation of the data coincided with the subset of cardiac and respiratory gates, such that each projection measurement was timed to correspond to one of the gates denoted by the circles in the figure. (Right) Algorithmic flow chart for the reconstruction.
2) Reconstruction
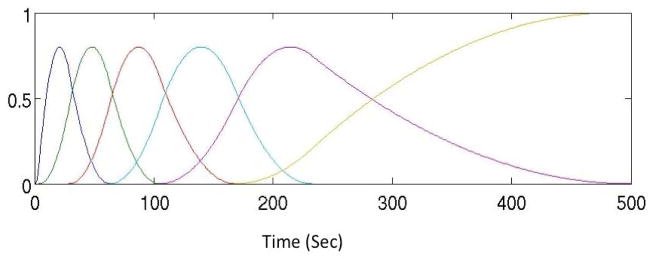
The spatiotemporal reconstruction models the temporal change of the activity in the heart by cubic B-spline basis functions (see Ref. (Reutter et al., 2000) for details). In order to obtain an optimal set of basis functions, the TACs of the measured patient data were first fitted to sets of B-spline basis functions. Figure 6 shows a set of 6 cubic B-spline basis functions that were determined to optimally model the temporal dynamics of the radiotracer.
Fig. 6.
A representative set of temporal cubic B-spline basis functions that were optimized for a specific input time activity curve (TAC) in Fig. 3.
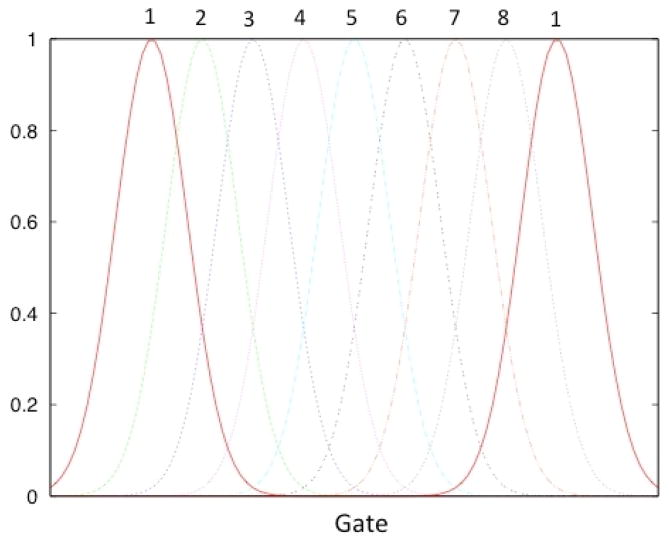
Although the beating of the heart is a continuous process, we assumed that the motion of the heart goes through a series of discrete states due to cardiac deformation. The basis functions for the cardiac phases were chosen as Gaussians functions. The widths and the peaks of the Gaussian functions were chosen in such a way that the reconstructed image activity closely correlated with the true activity distribution. Three sets of Gaussian functions of widths σ = 2, 4, and 8 were tested and it was found that the larger widths do not capture the finer motions of the heart. Therefore, Gaussian functions of all the same widths (σ = 2 ) were used and were equally spaced in gated cardiac coordinates. Figure 7 shows a representative set of Gaussian functions used to model the cardiac phase. The iterative ML-EM algorithm was used to estimate the coefficients of the expansion of the basis functions. Figure 5 (right) summarizes the flow of the reconstruction algorithm.
Fig. 7.
A representative set of Gaussian basis functions used to reconstruct the gated cardiac dynamic projection data. Altogether 8 cardiac basis functions were used to model the deformation of the heart. Due to symmetry gate 1 is identical to gate 9 (bold curves).
B. Cardiac Deformation and Respiratory Motion (6D Reconstruction)
1) Simulation of Data Acquisition
To simulate cardiac-respiratory motion, the respiratory motion in the MCAT was turned on along with the beating of the heart. The time-varying activity distribution of the radiotracer concentration for each respiratory and cardiac cycle was simulated as described in the previous section. Two sets of data were generated corresponding to the respiratory period of 4 sec and 5 sec with two different numbers of gates for each respiratory cycle. In both cases, the maximum vertical displacement of the heart due to respiratory motion was set to be 2 cm. The period of the cardiac cycle was again set to be 1 sec, and the duration between end-diastolic to the end-systolic phase was 0.325 sec. The camera rotation period was tuned in such a way that the data were synchronized, i.e., each projection corresponded to one gate of the cardiac-respiratory phase. For instance, if there were 30 cardiac-respiratory gates and the respiratory period was 5 sec, the activities were sampled every 5 sec from the TAC such that every 30 cardiac-respiratory gates, each with the same activity, corresponded to 5 sec time duration in the TAC (Fig. 3). There were 360 projections and 12 time frames in each rotation; and therefore the physical period of the camera rotation is 60 sec, which is a typical rotation speed of a commercially available SPECT camera (DePuey, 2012).
The activity distribution was reconstructed for two sets of cardiac-respiratory gates to see how the respiratory motion modulates the reconstructed images and if there is a trade-off between the number of gates and the number of projections per gate to achieve a high contrast image. We increased the number of cardiac-respiratory gates to 60 in order to reduce the effect of discreteness in cardiac-respiratory motion keeping the total number of projections 360 as before. For 60 gates in one cardiac-respiratory cycle, there were 6 time points over 360° camera rotation corresponding to only 6 projections per gate.
The other sets of detector parameters were exactly the same as in the 5D simulation. The object volume activity distribution changed with time due to both the temporal changes of the radiotracer and the cardiac-respiratory motion.
2) Reconstruction
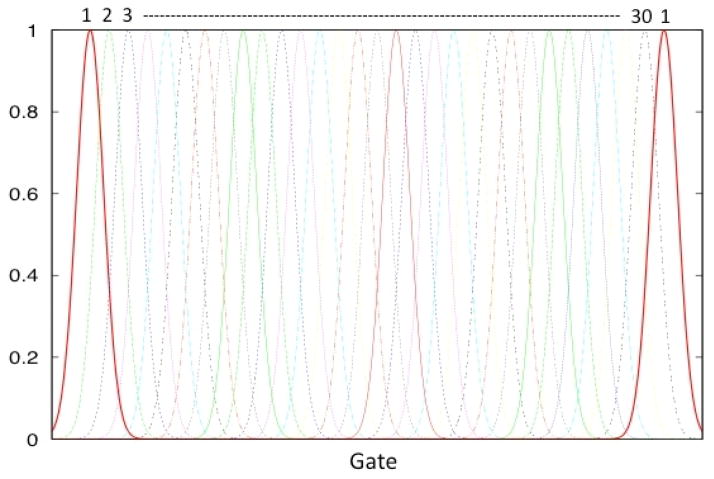
For the cardiac-respiratory reconstruction, we modeled the temporal dynamics of the tracer by cubic B-spline basis functions, and the basis functions for the cardiac-respiratory phases were chosen to be Gaussian functions as before. Figure 8 shows a set of Gaussian functions used to model the cardiac-respiratory phase. The widths and the peaks of the Gaussian functions were chosen in such a way that the reconstructed image volume closely correlated with the true activity distribution. Gaussian functions all with the same width (σ = 2 ) and equally spaced in gated cardiac-respiratory coordinates were used.
Fig. 8.
A representative set of Gaussian basis functions used to reconstruct the gated cardiac-respiratory dynamic projection data. The beating of the heart was assumed to be a discrete process as was respiration. Note that the cardiac and respiratory motion are periodic, so all of the basis curves are symmetric.
The reconstruction algorithm for solving the expansion coefficients in Equation (7) used a system matrix in Equation (11) that modeled attenuation and geometric point response using the line integral approach developed for the 3D geometry (Siddon, 1985), (Zeng and Gullberg, 1998), and adapted for spatiotemporal (Reutter et al., 2000) and gated dynamic reconstructions (Jin et al., 2006). Since the system matrix is the matrix of probabilities that the photon emitted from a given voxel in object space can reach the given pixel of the detector, it only depends on the orientation of the detector relative to the object (with attenuation) even though the activity distribution differs greatly with cardiac deformation and respiration motion. As mentioned previously, incorporating the time dependent attenuation into the system matrix would be computationally very costly, especially in the reconstruction part; so an average attenuation was used in generating the system matrix so that the system matrix was independent of time. The same system matrix was used for generating the projections and reconstructions for all datasets.
The standard iterative ML-EM algorithm was used to estimate the coefficients. For the noise free data only 17 iterations were used. It is pointed out that the reconstruction using the tensor product of the basis functions proposed in this work does not directly estimate the activity distribution in the image volume. Instead, it calculates the coefficients (weights) of the basis functions in the expansion in Equation (7) that is, in turn, used to map the spatiotemporal activity distribution of radiotracer over space and time.
3) 4D Reconstruction (only temporal simulated) Compared with 6D Reconstruction (temporal, cardiac deformation, respiratory motion simulated)
The 6D reconstructed images were compared with that obtained from the conventional spatiotemporal 4D reconstruction. The spatiotemporal 4D reconstruction provides information of the temporal changes of the radiotracer at each spatial point (voxel), assuming that the point (voxel) is static in nature. The spatial and the smooth temporal representation of the dynamic image volume were modeled using voxels and a continuous set of 6 cubic B-splines basis functions. In the 4D reconstruction, the projection data were still gated. However, reconstructions were performed without taking into consideration of respiratory-cardiac motion.
C. Performance Evaluation with Statistical Noise
1) Simulation and Data Acquisition
The simulations presented in the previous sections are ideal in the sense that they did not include noise. In emission tomographic data acquisition, a human subject is injected with a radiopharmaceutical used to tag the tissue of interest such as the myocardium, and a photon-counting camera detects the emitted photons. The detection of photons in the image acquisition using modalities such as PET or SPECT include photon noise or quantum fluctuations (Alpert et al., 1982), which are modeled by a Poisson probability distribution. This noise is related to an unavoidable uncertainty associated with the measurement inherent to the quantized nature of the radiation field and plays a dominant role in the system when number of photons is small (Javanainen and Shrestha, 2008).
To evaluate the performance of our algorithm in the presence of statistical noise, Poisson noise was added to the simulated projection data sets. For the reconstruction with multiple noise realizations, we considered data of only the third and fourth minutes after tracer injection with 360 projections per rotation, corresponding to a total of 720 projections with total counts equal to 2.65×10⁷. There were 30 cardiac-respiratory gates and the respiratory period was 5 sec. As before, each view in the detector plane was pixelized with 128×128 bins, and the mean photon counts per pixel was 2.25 ensuring the count rate was within the tolerance of the SPECT camera (Seo et al., 2008). These datasets and mean photon counts were comparable to a typical image obtained in clinical acquisition of one of our dynamic cardiac patient studies with 10 mCi of 99mTc-tetrofosmin (99mTc, 140 keV) and 120 projections per rotation, and was used to generate noisy projections.
The detected photons in each set of projection data ŷ were corrupted with Poisson distributed noise according to (Boutchko et al., 2013)
| (13) |
where A is the system matrix that contains the physics and geometry of the detector and η is the noise level. The index i = 1,2,… represents a particular noise realization for a given noise level η. Four sets of noise levels were simulated. We chose η = 1024,256,64 and 1 such that the mean number of photons with the noise level η =1024 approximately corresponded to a typical clinical acquisition with 10 mCi of 99mTc-tetrofosmin (99mTc, 140 keV) in our dynamic cardiac SPECT studies, where the estimated mean photon counts per pixel was 2.5. For each noise level there were 10 noise realizations.
2) Reconstruction
The projections were reconstructed in an analogous manner as described before with the same set of basis functions for the 6-D reconstruction. The addition of noise presented an ill-posed problem for the reconstruction. In this case, the number of iterations was increased to 27 to ensure better convergence for the values of the estimated coefficients. In order to generate the time activity curves from the reconstruction, we again reconstructed the noisy data up to 5 min of TAC.
The reconstructed volumes were rescaled by the noise level:
| (14) |
The reconstructed volume of activity were then filtered using a 3D convolution kernel of 9×9×9 that approximated a 3D Gaussian filter with FWHM = 4 mm.
3) Measures of SNR, Bias and Variance
For a given noise level, η, the statistical mean value 〈V(η)〉 and the standard deviation σ(η) of the activity at each voxel were computed for a set of 10 noise realizations. The average signal-to-noise ratio (SNR) over the region of interest (ROI) was then calculated as
| (15) |
where denotes averaging over a given ROI. The variance estimate is given by
| (16) |
Similarly the bias, BROI, owing to reconstruction is defined by
| (17) |
IV. Results
A. Cardiac Deformation (5-D Reconstruction) – temporal, cardiac deformation, no respiratory motion simulated
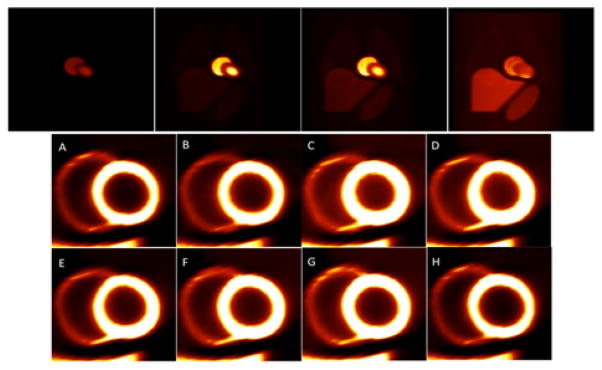
In this case only the deformation of the heart due to cardiac beating as the radiotracer washed in and washed out was simulated. The respiratory motion was switched off. Figure 9 presents an example of the reconstructed image volume from the gated noise-free cardiac data. Since the radiotracer wash-in and wash-out rates were relatively small compared to the heart rate, two plots are shown corresponding to these two time scales. The top row shows the coronal view of the activity distribution every 30 seconds beginning at 2 minutes after infusion. In the bottom row the short axis views of the myocardium are shown for one complete cardiac cycle from diastole (A) to end-diastole (H) through the systolic phases (C, D, and E) for one second beginning at four minutes after infusion. The reconstructed data were tri-linearly interpolated but no filtering was applied. The relative intensity of the left ventricle was adjusted to make the right ventricle visible in the short axis views. The thickening of the myocardium and reduction in the left ventricle volume are clearly visible in the systolic phases (C and D).
Fig. 9.
Reconstruction of gated cardiac data. (Top) Demonstration of the temporal changes of the tracer every 30 sec beginning at 2 minutes after tracer injection. (Bottom) Heart phases beginning at 4 minutes after the tracer injection showing short axis views of the myocardium (left and right ventricles) in one complete cardiac cycle from diastole (A) to end-diastole (H) through the systolic phases (C, D, E). Notice the thickening of the myocardium in the systolic phases (C, D).
B. Cardiac Deformation and Respiratory Motion (6D Reconstruction)
1) 6D Reconstruction (temporal, cardiac deformation, respiratory motion simulated)
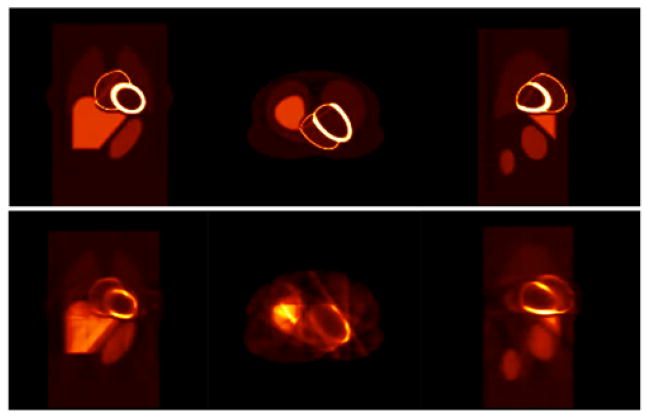
Figure 10 shows an example of the reconstructed images for the gated cardiac-respiratory dynamic data using the tensor product of basis functions described in the Method section. The top row shows the three orthogonal views (coronal, transverse, sagittal) of the actual activity distribution in the object space 4 minutes after the tracer injection. The bottom row shows the corresponding 6D reconstructed images. Again the reconstructed data were tri-linearly interpolated, but no filtering was applied. The sharpness of the image is clearly manifested with no blurring due to motion artifacts. The streak artifact seen in the transverse view is due to the inconsistency in the projections. Since there were only 12 projections for each gate, the reconstruction problem was highly underdetermined; and the projection data were insufficient for a good reconstruction.
Fig. 10.
Reconstruction of gated cardiac-respiratory noise-free data. (Top) three orthogonal views (coronal, transverse, sagittal) of the actual object activity distribution 4 minutes after the tracer injection. (Bottom row) corresponding reconstructed images. There were 30 gates in each time frame corresponding to 12 projection views for each gate and total of 360 projections per rotation.
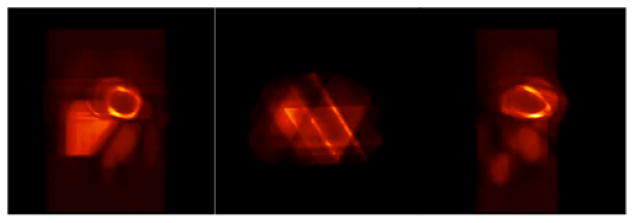
In order to corroborate the speculation that a smaller number of projections per gate produced the streak artifacts observed in Fig. 10, the number of cardiac-respiratory gates was increased to 60 keeping other parameters of the simulation unchanged. There were still 360 projections per rotation. This corresponded to 60 projections in one time frame with only 6 projections for each gate per rotation. Figure 11 shows the reconstructed images for the same activity as in Fig. 10 with 60 cardiac-respiratory gates. The image quality was degraded with pronounced streak artifact (in transverse view) even though the number of gates was doubled. This is due to the fact that increasing the number of cardiac-respiratory gates increased the number of states but this reduced the number of tomographic views per state (gate) in the tomographic reconstruction. Since the total number of projections in one rotation was 360, there were only 6 projections per gate, which made the reconstruction problem highly underdetermined. This clearly indicates that there is a trade-off between the number of gates per cardiac-respiratory cycle and the number of projections per gate in each tomographic rotation.
Fig. 11.
Three orthogonal views (coronal, transverse, sagittal) of the reconstruction of the gated cardiac-respiratory data with 60 gates and 6 projections for each gate per rotation. The rest of the parameters were the same as in Fig. 10.
Like in the case of the gated cardiac reconstruction in Fig. 9, the tensor product of basis functions should also be able to delineate the deformation as well as the upward motion of the heart due to respiration. Figure 12 shows the myocardial displacement in an exhalation-inhalation sequence during one respiratory cycle. Here the respiratory period was 4 sec while the duration of cardiac cycle was 1 sec. The images in the top row are the actual activity distribution in the object space while images in the bottom row are the reconstructed volumes 3 minutes after tracer injection. The cross hair marks the center of the left ventricle. The image frames were extracted from the reconstruction of 30 cardiac-respiratory gates in one complete respiratory cycle. Only the even numbered frames are shown.
Fig. 12.
Coronal views of an exhalation-inhalation sequence during one respiratory cycle. (Top row) The original time activity distribution and (Bottom row) the corresponding reconstructed images. The respiratory period was 4 sec while the heart beat period was 1 sec. The cross hair marks the center of the left ventricle during exhalation. The vertical shift of the myocardium is clearly demonstrated both in the original images and in the reconstructed images. The total number of cardiac-respiratory gates was 30. Only even number of frames is shown here.
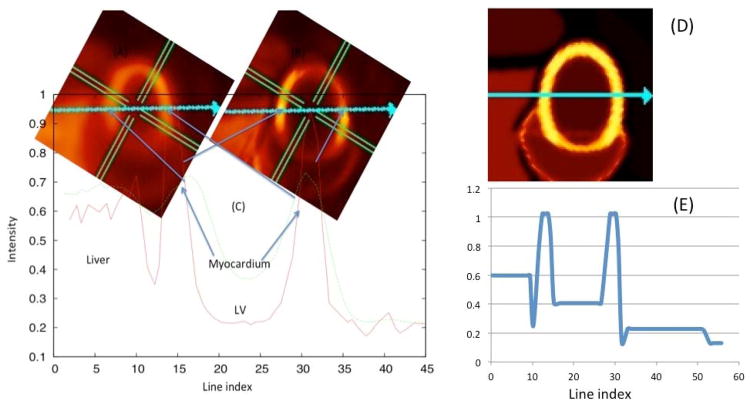
Figure 13 compares the quality of the 4D and the 6D reconstructions. The simulated dynamic projection data were respiratory-cardiac gated. In the 4D reconstruction, the only basis functions used were cubic B-splines that approximately captured the temporal behavior of the radiotracer. For the 6D reconstruction the temporal as well as the cardiac-respiratory motion was modeled using the tensor product of the cubic B-splines and Gaussian basis functions. Both the image quality and contrast are superior in the 6D reconstruction. The line profile through the myocardium also shows sharper peaks in the 6D reconstruction compared to spatiotemporal 4D reconstruction.
Fig. 13.
4D (spatiotemporal) reconstruction compared with 6D (temporal, cardiac, respiratory) reconstruction. The insets show the reconstructed images 4 min after tracer injection with the 4D reconstruction (A) and the 6D reconstruction (B) algorithm. (C) The line profile of myocardium intensity distribution along the line (shown by arrow) for 4D and 6D. (Right) The ground truth image (D) and corresponding line profile (E).
C. Performance Evaluation with Statistical Noise
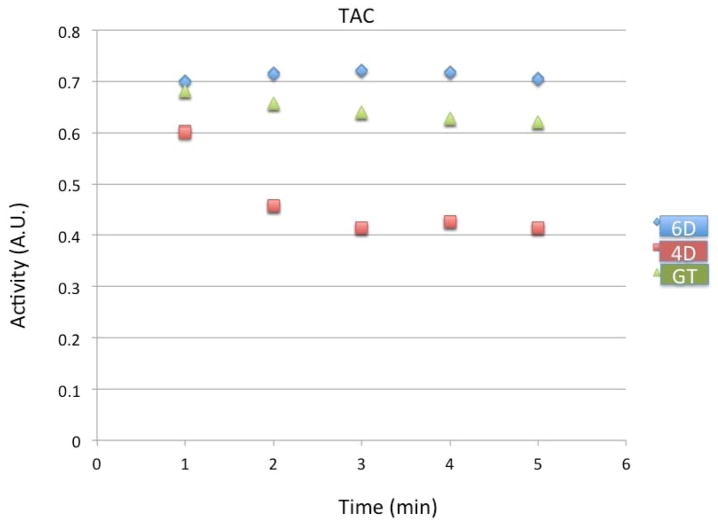
In Fig. 14 we show the time activity curves in the myocardium for the fully 6D reconstruction without noise compared with the conventional spatiotemporal 4D reconstruction and the ground truth. The reconstructed results were averaged over all cardiac and respiratory gates and over time. The data shown here are for the first to the fifth minute after tracer injection. Notice that the 6D reconstruction slightly overestimates the true tracer activity whereas the 4D reconstruction greatly underestimates the true tracer activity.
Fig. 14.
Time activity of the tracer in the myocardium for the fully 6D reconstruction (diamond, blue) compared with the conventional 4D reconstruction (square, red) and the ground truth (triangle, green). Simulation results are reconstructions 360 views per rotation from the first to the fifth minutes after injection. All activities were averaged over cardiac and respiratory gates in the static ROI over each minute.
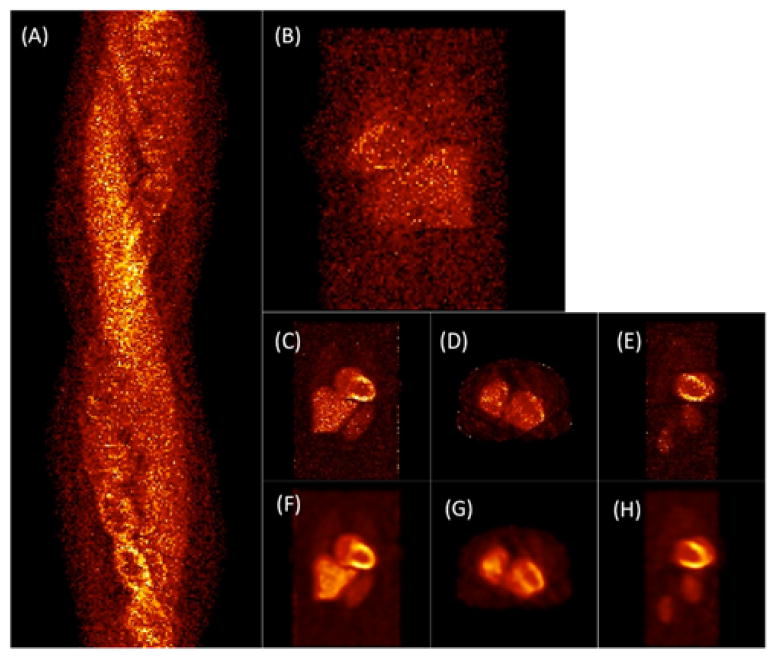
In Fig. 15 we show the noisy projection data (noise level η = 1024) and the corresponding reconstruction results. Figure 15 (A) and (B) show the sinogram and a coronal (90°-projection) view of the 6D noisy data for approximately 3 minutes after the tracer injection. Fig. 15 (C), (D) and (E) are the reconstructed images in three different orthogonal views while (F), (G), (H) are the corresponding filtered images.
Fig. 15.
Reconstruction of the projection data with Poisson noise. (A) Noisy sonogram (noise level η = 1024) for one complete camera rotation approximately 3 minutes after tracer injection; (B) A coronal view (projection) at the 90° detector position; (C) Coronal, (D) Transverse, (E) Sagittal views of the 6D reconstructed images; (F), (G), (H) Same with the 3D Gaussian filter.
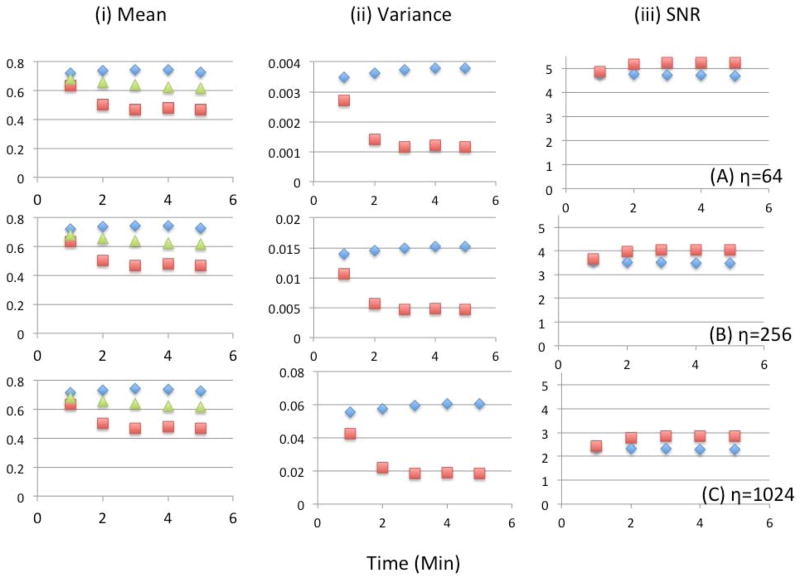
Figure 16 shows the detailed results of the statistical analysis in the fully 6D reconstruction for 3 different noise levels and compares with the conventional 4D reconstruction. The mean activities per voxel in the myocardium were calculated as the average of the 10 noise realizations over all cardiac and respiratory gates for one minute. In the 6D reconstruction variances were higher as compared to the 4D reconstruction; consequently the SNR was reduced slightly. Notice that the differences in the SNR between the 6D and the 4D reconstructions are nearly the same for all noise levels.
Fig. 16.
Statistical analysis for the 6D reconstruction (diamond, blue) compared with the conventional 4D reconstruction (square, red) as a function of time (minutes) after injection. Shown here are the (i) mean number of counts, (ii) variance, and (iii) SNR for 10 noise realizations for three different noise levels (A) η=64, (B) η=256 and (C) η=1024. The mean activity averaged over cardiac and respiratory gates of the ground truth (green triangle) is also shown.
By increasing the number of gates, the counts for each gate becomes less in the 6D reconstruction compared to the ungated 4D reconstruction for the same total number of counts. One would therefore expect the variance and hence the SNR to decrease. However, the SNR in 6D reconstruction did not suffer too much with the values only 11.2%, 14.7% and 18.3% smaller than the conventional 4D method for noise levels η=64, η=256 and η=1024, respectively. We believed that our approach of using Gaussian basis functions in the reconstruction provided an alternative method of regularization (Cabello and Rafecas, 2012).
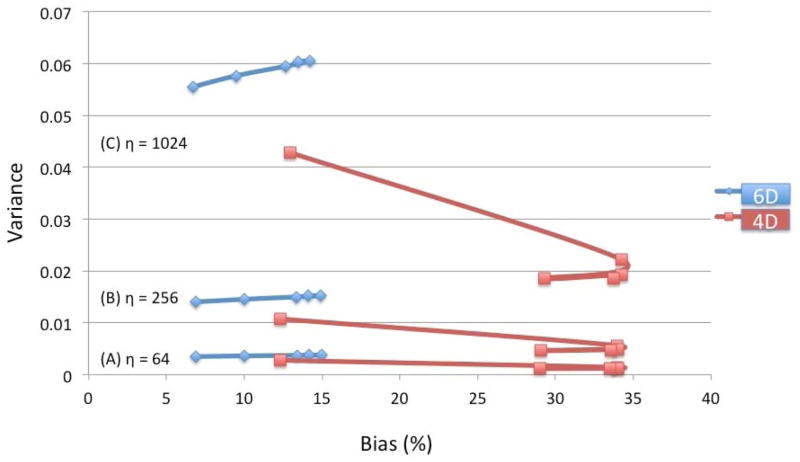
Figure 17 shows the comparison of the bias versus variance relationship for the fully 6D and conventional 4D reconstruction for different noise levels. The bias is presented in percentage. Each data point was averaged over one minute and was plotted for 1, 2, 3, 4, and 5 minutes after the tracer injection. Although the variance was better for the 4D reconstruction, the bias performance was clearly superior for the 6D reconstruction. For 4D reconstruction there was a significant contamination coming from blood pool due to the cardiac and respiratory motion, and consequently more counts were registered in the myocardial ROI in the first minute. This is probably why the bias was better in 4D in the first minute after tracer injection.
Fig. 17.
Bias versus variance relationship at different noise levels for the fully 6-D reconstruction (diamond, blue) compared with the conventional 4D reconstruction (square, red). The series of five data points represent the average taken over each minute at 1, 2, 3, 4, and 5 minutes after tracer injection. For 6D, the variance curves increase slightly with increase in bias from 1 to 5 minutes, whereas for 4D the variance decreases with increase in bias from 1 to 2 minutes then the variance and bias both decrease slightly from 2 to 5 minutes.
V. DISCUSSION
In this study, we proposed a multidimensional image reconstruction method for dynamic SPECT using a tensor product of basis functions that estimates the activity distribution in each physical voxel of the object space as the object itself deformed and moved due to internal and external motion. The method is unique in that it proposes to solve simultaneously the problem of cardiac respiratory and deformative motion (cardiac beating) as well as a time varying tracer concentration in a 3D space with the additional difficulty of tomographically modeling these dynamics using data acquired with a slowly rotating SPECT camera. The solution to this 6D problem involves the use of a tensor product of basis functions that provides a continuous regularized model of the motion of tracer dynamics and cardiac motion.
Conventional methods for cardiac motion compensation are based on the assumption that the activity in a given voxel does not change in time. This is a valid assumption if one neglects the effect of concentration changes during uptake and washout of the radiotracer. However, the wash-in and washout rates for commonly available PET and SPECT tracers such as ammonia (13NH3) [49] or 99mTc-tetrofosmin vary significantly. Therefore, one needs to incorporate the temporal changes of the activity along with the motion to obtain more accurate kinetic model parameters and estimation of wall motion abnormalities. The reconstruction in higher dimensions using a tensor product of basis functions may provide an alternative approach for imaging deformed and moving organs when the radiotracer concentration changes with time. Specifically, 5D tomography refers to the approach of estimating the tracer dynamics from projections by modeling the deformation of the organ as well as the change of the concentration of the tracer as a function of time in terms of a tensor product of spatial, temporal, and deformation basis functions. The 6D tensor product reconstruction considers space, tracer concentration variation, and deformation, in addition to displacement of the organ due to respiration and may yield better image quality that can be intrinsically free from motion artifacts without losing the kinetic and dynamic information of the radiotracer.
In our evaluation we compared our 6D method with a 4D method where time was modeled without cardiac and respiratory motion showing bias versus variance plots. The variance is higher and the SNR is lower for 6D compared to 4D. Although we have not employed regularization explicitly in our calculation, and one would argue that the estimated parameter might be inaccurate without proper regularization, our approach, however, does provide an alternative method of regularization in the form of the implemented basis functions. We believe that the use of basis functions in the reconstruction performed some sort of regularization (Cabello and Rafecas, 2012) as the difference in SNR in 6D and 4D was not high for all noise levels. While a comparison of 6D with independent 4D reconstructions of cardiac and respiratory gates would be interesting, the biases are expected to be almost equal with a bias a little better with gating, whereas, the regularization due to the Gaussian basis functions would provide better SNR with 6D. In comparing 6D and 4D, time was modeled in each case whereas in a previous paper (Winant et al., 2012) 4D was compared with 3D reconstructed time frames with data acquired with the same slowly rotating camera setup as was simulated in this paper, demonstrating that 4D modeling of the data acquisition still produced better bias and noise characteristics.
The theory presented in this work is general for the purpose of selecting basis functions appropriate for the dynamic cardiac SPECT imaging problem. There are many different possible spatial and temporal basis functions that one could select. Voxels were used for the spatial basis functions, splines for the temporal dimension, and Gaussian functions for cardiac deformation and respiratory motion. This set of basis functions does not provide spatial regularization, but does provide appropriate regularization in the temporal and in the cardiac deformation and respiratory motion dimensions. Instead of voxels, B-splines or Gaussians could have also been used for the spatial basis functions. In the past, we have used FADs for the temporal basis functions (Sitek et al., 2000), but FADS present several problems relative to non-uniqueness. Using splines, we have found that the non-uniqueness greatly improves, and we have used this for initialization of the FADS solution (Abdalah et al., 2015). Another possibility is to use discrete wavelet basis functions that have been used in biomedical image reconstruction and signal processing (Turkheimer et al., 2000).
Another regularization approach is the use of constraints in the form of a Bayesian prior. The information from cardiac and respiratory gating provides constraints that are necessary for our method to be plausible, however, we did not include rigorous constraints as to the motion of the heart in the present formulation. We felt for this application the best regularization would be the basis functions themselves, because not knowing the correct motion of the heart it then becomes difficult to know a priori what prior to implement. However, efforts are being pursued to better model motion for improved imaging results (Lee and Tsui, 2015). Since the heart is primarily incompressible, the velocity field must satisfy incompressibility or divergence-free constraints (Liu et al., 2012), which could be very useful in constraining possible solutions. Previously, our group has used the incompressibility constraint in post processing algorithms to improve the noise in gated (non-dynamic) cardiac SPECT images. In addition, we have been pursuing the use of finite element (FE) mechanical models (Veress et al., 2015; Veress et al., 2013; Veress et al., 2011) to constrain solutions. However, one can argue that in the case of disease this may be difficult to model accurately in order to provide valid constraints for cardiac contraction. To overcome this problem, estimation of exact motion fields for compensation of irregular motion is needed. Applying motion fields after reconstruction of each gate has shown to provide motion-corrected gated reconstructions.
With the advent of new dual modality PET-MR technology (Judenhofer and Cherry, 2013), (Wehrl et al., 2014) there has been significant excitement and promises in the direction of the estimation of motion fields for cardiac motion correction in the PET images. The simultaneous use of PET-MRI not only corrects the rigid body movement but also non-rigid respiration motion. Our method of using spatiotemporal and deformative basis functions could be used in the PET-MRI application. It may improve the detection of motion abnormalities over that of pure gating because it models the continuous motion between gates instead of reconstructing only a discrete image for each gate and could also include motion field information. One can argue that modeling cardiac motion provides too many degrees of freedom and thus requires constraints to penalize impossible kinds of movements.
Although very promising, our method has some limitations. For example, the method requires a sufficient number of cardiac-respiratory gates as well as a large number of tomographic views per gate to obtain good image quality, which can be difficult with a slow rotating two-headed SPECT system. A small number of gates may increase the tomographic views per gate but it results in blurring due to insufficient number of cardiac-respiratory phases leading to poor motional resolution. On the other hand, while a larger number of gates may delineate the continuity of the myocardium deformation and its displacement due to respiratory motion, it reduces the number of tomographic views per cardiac-respiratory state. Therefore, increasing the number of gates by keeping the number of views per state relatively large would definitely provide improvement in the image quality, however, it would require faster rotation speeds of the camera, thus lowering the counts per view, or require more detector heads surrounding the patient, such as the GE 570c (GE Healthcare), thus improving the count sensitivity and temporal resolution. Also, the size of the system matrix, and the computational cost increases exponentially. At the present our 6D reconstruction takes about 2 weeks of CPU time in a single core machine to obtain a result. Although this approach is computationally challenging, the advent of faster modern technology using GPU reconstruction or parallel computation can be exploited to reduce the computational time significantly.
We were not able to test our method with real (clinical) data from existing SPECT systems in our institution because it does not provide gating information during a dynamic acquisition. Future modifications will be necessary for clinical SPECT systems to be able to acquire dynamic cardiac and respiratory-gated data. Another limitation is the implementation of time-dependent system matrix while implementing the attenuation in higher dimension. It is always desired to simulate projection data using a more accurate (time-dependent) system matrix and to perform reconstruction with the same time-dependent system matrix. Creating projection data with time-varying attenuation rather than using its approximate average value may be computationally very fast, and could be a more exact attenuation model. However, doing reconstruction with time-dependent system matrix is computationally very costly. One can also argue on creating a more accurate projection data with the time-dependent system matrix and perform the reconstruction with the approximate (time-independent) system matrix. But we believe that, with the level of approximation we employed in the reconstruction, the accuracy would not improve much until and unless we use the time-dependent system matrix in the reconstruction as well.
Last but not least, we assumed that the respiratory motion was synchronized with the cardiac gating in all simulations to ease our calculation. However, this is not the case in real clinical MPI. We expect that the use of basis functions would smooth the asynchrony and we believe this would provide an average estimation of parameter values in the unsynchronized MPI studies. We are working on how to incorporate asynchrony in the model to represent the more realistic case. Furthermore, in our model we used a constant frequency periodic (sinusoidal) respiratory cycle. We believe that incorporating priors in the reconstruction (such as based on a mechanical model (Lee et al., 1995)) would improve the variable frequency (non-sinusoidal) model for respiration, and will be a subject of future publication.
VI. CONCLUSION
We have developed a method for 6-D reconstruction and simulated the temporal dynamics of the radiotracer in a deforming myocardium displaced by respiration for data acquired using a slowly rotating SPECT camera. A higher-dimensional multiresolution spatiotemporal parameterization of the gated cardiac and respiratory data delineated the changes in the deformation of the heart as well as changes in the intensity of the signal caused by uptake and washout of the radiopharmaceutical in the myocardium. Our approach permits direct measure of the tracer distributions in moving organs and thus an accurate estimation of the parameter values that one can derive from the projection data set. Verification of our method was performed with the simulation of data acquired with a commonly available SPECT camera in the clinic. Modifications to present clinical SPECT systems are necessary to enable acquisition of dynamic cardiac- and respiratory-gated data. However, the methods developed here are appropriate for cardiac PET applications and can be implemented on present clinical systems.
Acknowledgments
The authors would like to thank W. P. Segars and B. M. W. Tsui for letting use of their MCAT phantom, and R. Butchko and M. Defrise for fruitful discussions during the Fully 3D meeting in 2013 at Lake Tahoe, California.
APPENDIX: Maximum Likelihood Expectation Maximization (ML-EM) Algorithm in 6D
It is assumed that the detection of photons at each detector bin for a given angular position θ(t) is governed by a Poisson distribution. Let pi be the projection measurement for bin I during the measurement interval [tk, tk + Δtk]. Let cim be the probably that a photon leaving voxel basis function m reaches the ith projection, and λimnqr be the random number of photons detected in bin I that comes from voxel basis function Sm, temporal basis function Vn, gate basis function Wq, and respiratory basis function Rr during the measurement interval [tk, tk + Δtk]. The mean of λimnqr is
| (A.1) |
where amnqr are the coefficients of basis functions to be determined.
The random number of photons recorded in projection bin i is
where pi and λimnqr are Poisson distributed random variables. The mean of λimnqr is given above in Equation (A.1), and the mean of pi is
| (A.2) |
Rewriting Equation (A.2) for the mean number of detected photons
| (A.3) |
where cim = amnqrUm(di(t), t)Vn(t)Wq(τ(t)), Rr(ζ(t)) is the probability that a photon emitted from a voxel basis function m, temporal basis function n, gate basis function q, and respiratory basis function r would be detected in the ith detector bin at time t. Hence, assuming the detection of photons from each voxel basis function is an independent process, the likelihood function is given by
Equivalently, one can write
| (A.4) |
From Equation (A.4), the log-likelihood function is
| (A.5) |
where
One can solve for the optimum A by maximizing this log-likelihood function. Instead, we seek to use the EM algorithm (Shepp and Vardi, 1982). For the E-step we need the complete data log-likelihood. To do this we introduce the complete data λimnqr which is the random number of photons detected in bin i that comes from voxel basis function m, temporal basis function n, gate basis function q, and respiratory basis function r during measurement interval [tk, tk + Δtk]. Substituting the expression for Bmnqr in Equation (A.1), the mean of λimnqr is
| (A.6) |
The complete data likelihood function of λ given A is
Expanding the product, the complete data log likelihood function of λ given A is
| (A.7) |
The E-step involves taking the expectation of the complete data log-likelihood function given the projection data p and the value of A at the iteration η:
| (A.8) |
where Aη is the value of A at iteration η. The random variables λimnqr are defined by a multinomial distribution given pi.
Therefore,
where
We can now write Eλ(lnℒλ(λ|A)|p, Aη) as
| (A.9) |
We ignore the last term because the optimum value for A in this expression is also the optimum value for the function without this term. Taking partial derivatives of that function and setting the expressions to zero, we have
| (A.10) |
Therefore solving for , we have the following algorithm for estimating amnqr
| (A.11) |
References
- Abdalah M, Boutchko R, Mitra D, Gullberg GT. Reconstruction of 4-D dynamic SPECT images from inconsistent projections using a Spline initialized FADS algorithm (SIFADS) IEEE Trans Med Imaging. 2015;34:216–28. doi: 10.1109/TMI.2014.2352033. [DOI] [PubMed] [Google Scholar]
- Alhassen F, Nguyen N, Bains S, Gould RG, Seo Y, Bacharach SL, Song X, Shao L, Gullberg GT, Aparici CM. Myocardial blood flow measurement with a conventional dual-head SPECT/CT with spatiotemporal iterative reconstructions - a clinical feasibility study. American journal of nuclear medicine and molecular imaging. 2013;4:53–9. [PMC free article] [PubMed] [Google Scholar]
- Alpert NM, Chesler DA, Correia JA, Ackerman RH, Chang JY, Finklestein S, Davis SM, Brownell GL, Taveras JM. Estimation of the local statistical noise in emission computed tomography. IEEE Trans Med Imaging. 1982;1:142–6. doi: 10.1109/TMI.1982.4307561. [DOI] [PubMed] [Google Scholar]
- Bai W, Brady M. Regularized B-spline deformable registration for respiratory motion correction in PET images. Phys Med Biol. 2009;54:2719–36. doi: 10.1088/0031-9155/54/9/008. [DOI] [PubMed] [Google Scholar]
- Beller GA, Heede RC. SPECT imaging for detecting coronary artery disease and determining prognosis by noninvasive assessment of myocardial perfusion and myocardial viability. Journal of cardiovascular translational research. 2011;4:416–24. doi: 10.1007/s12265-011-9290-2. [DOI] [PubMed] [Google Scholar]
- Boutchko R, Sitek A, Gullberg GT. Practical implementation of tetrahedral mesh reconstruction in emission tomography. Phys Med Biol. 2013;58:3001–22. doi: 10.1088/0031-9155/58/9/3001. [DOI] [PMC free article] [PubMed] [Google Scholar]
- Cabello J, Rafecas M. Comparison of basis functions for 3D PET reconstruction using a Monte Carlo system matrix. Phys Med Biol. 2012;57:1759–77. doi: 10.1088/0031-9155/57/7/1759. [DOI] [PubMed] [Google Scholar]
- Cremer P, Hachamovitch R, Tamarappoo B. Clinical decision making with myocardial perfusion imaging in patients with known or suspected coronary artery disease. Semin Nucl Med. 2014;44:320–9. doi: 10.1053/j.semnuclmed.2014.04.006. [DOI] [PMC free article] [PubMed] [Google Scholar]
- DePuey EG. Advances in SPECT camera software and hardware: currently available and new on the horizon. J Nucl Cardiol. 2012;19:551–81. doi: 10.1007/s12350-012-9544-7. quiz 85. [DOI] [PubMed] [Google Scholar]
- Di Carli M, Czernin J, Hoh CK, Gerbaudo VH, Brunken RC, Huang SC, Phelps ME, Schelbert HR. Relation among stenosis severity, myocardial blood flow, and flow reserve in patients with coronary artery disease. Circulation. 1995;91:1944–51. doi: 10.1161/01.cir.91.7.1944. [DOI] [PubMed] [Google Scholar]
- Gullberg GT, Huesman RH, Malko JA, Pelc NJ, Budinger TF. An attenuated projector-backprojector for iterative SPECT reconstruction. Phys Med Biol. 1985;30:799–816. doi: 10.1088/0031-9155/30/8/004. [DOI] [PubMed] [Google Scholar]
- Gullberg GT, Reutter BW, Sitek A, Maltz JS, Budinger TF. Dynamic single photon emission computed tomography--basic principles and cardiac applications. Phys Med Biol. 2010;55:R111–91. doi: 10.1088/0031-9155/55/20/R01. [DOI] [PMC free article] [PubMed] [Google Scholar]
- Higley B, Smith FW, Smith T, Gemmell HG, Das Gupta P, Gvozdanovic DV, Graham D, Hinge D, Davidson J, Lahiri A. Technetium-99m-1,2-bis[bis(2-ethoxyethyl) phosphino]ethane: human biodistribution, dosimetry and safety of a new myocardial perfusion imaging agent. J Nucl Med. 1993;34:30–8. [PubMed] [Google Scholar]
- Javanainen J, Shrestha U. Nonlinear phenomenology from quantum mechanics: soliton in a lattice. Phys Rev Lett. 2008;101:170405. doi: 10.1103/PhysRevLett.101.170405. [DOI] [PubMed] [Google Scholar]
- Jin M, Yang Y, King MA. Reconstruction of dynamic gated cardiac SPECT. Med Phys. 2006;33:4384–94. doi: 10.1118/1.2358201. [DOI] [PubMed] [Google Scholar]
- Judenhofer MS, Cherry SR. Applications for preclinical PET/MRI. Semin Nucl Med. 2013;43:19–29. doi: 10.1053/j.semnuclmed.2012.08.004. [DOI] [PubMed] [Google Scholar]
- Kovalski G, Israel O, Keidar Z, Frenkel A, Sachs J, Azhari H. Correction of heart motion due to respiration in clinical myocardial perfusion SPECT scans using respiratory gating. J Nucl Med. 2007;48:630–6. doi: 10.2967/jnumed.106.037390. [DOI] [PubMed] [Google Scholar]
- Kuhle WG, Porenta G, Huang SC, Buxton D, Gambhir SS, Hansen H, Phelps ME, Schelbert HR. Quantification of regional myocardial blood flow using 13N-ammonia and reoriented dynamic positron emission tomographic imaging. Circulation. 1992;86:1004–17. doi: 10.1161/01.cir.86.3.1004. [DOI] [PubMed] [Google Scholar]
- Lee SJ, Rangarajan A, Gindi G. Bayesian image reconstruction in SPECT using higher order mechanical models as priors. IEEE Trans Med Imaging. 1995;14:669–80. doi: 10.1109/42.476108. [DOI] [PubMed] [Google Scholar]
- Lee TS, Tsui BM. The development and initial evaluation of a realistic simulated SPECT dataset with simultaneous respiratory and cardiac motion for gated myocardial perfusion SPECT. Phys Med Biol. 2015;60:1399–413. doi: 10.1088/0031-9155/60/4/1399. [DOI] [PMC free article] [PubMed] [Google Scholar]
- Lewitt RM. Multidimensional digital image representations using generalized Kaiser-Bessel window functions. J Opt Soc Am A. 1990;7:1834–46. doi: 10.1364/josaa.7.001834. [DOI] [PubMed] [Google Scholar]
- Liu X, Abd-Elmoniem KZ, Stone M, Murano EZ, Zhuo J, Gullapalli RP, Prince JL. Incompressible deformation estimation algorithm (IDEA) from tagged MR images. IEEE Trans Med Imaging. 2012;31:326–40. doi: 10.1109/TMI.2011.2168825. [DOI] [PMC free article] [PubMed] [Google Scholar]
- Livieratos L, Stegger L, Bloomfield PM, Schafers K, Bailey DL, Camici PG. Rigid-body transformation of list-mode projection data for respiratory motion correction in cardiac PET. Phys Med Biol. 2005;50:3313–22. doi: 10.1088/0031-9155/50/14/008. [DOI] [PubMed] [Google Scholar]
- Maltz JS. Parsimonious basis selection in exponential spectral analysis. Phys Med Biol. 2002;47:2341–65. doi: 10.1088/0031-9155/47/13/311. [DOI] [PubMed] [Google Scholar]
- Matsumoto N, Berman DS, Kavanagh PB, Gerlach J, Hayes SW, Lewin HC, Friedman JD, Germano G. Quantitative assessment of motion artifacts and validation of a new motion-correction program for myocardial perfusion SPECT. J Nucl Med. 2001;42:687–94. [PubMed] [Google Scholar]
- Mukherjee JM, McNamara JE, Johnson KL, Dey J, King MA. Estimation of Rigid-Body and Respiratory Motion of the Heart From Marker-Tracking Data for SPECT Motion Correction. IEEE Trans Nucl Sci. 2009;56:147–55. doi: 10.1109/TNS.2008.2010319. [DOI] [PMC free article] [PubMed] [Google Scholar]
- Nam WH, Ahn IJ, Kim KM, Kim BI, Ra JB. Motion-compensated PET image reconstruction with respiratory-matched attenuation correction using two low-dose inhale and exhale CT images. Phys Med Biol. 2013;58:7355–74. doi: 10.1088/0031-9155/58/20/7355. [DOI] [PubMed] [Google Scholar]
- Nichols TE, Qi J, Asma E, Leahy RM. Spatiotemporal reconstruction of list-mode PET data. IEEE Trans Med Imaging. 2002;21:396–404. doi: 10.1109/TMI.2002.1000263. [DOI] [PubMed] [Google Scholar]
- Niu X, Yang Y, Jin M, Wernick MN, King MA. Regularized Fully 5D Reconstruction of Cardiac Gated Dynamic SPECT Images. IEEE Trans Nucl Sci. 2010;57:1085–95. doi: 10.1109/TNS.2010.2047731. [DOI] [PMC free article] [PubMed] [Google Scholar]
- Parker JG, Mair BA, Gilland DR. Respiratory motion correction in gated cardiac SPECT using quaternion-based, rigid-body registration. Med Phys. 2009;36:4742–54. doi: 10.1118/1.3215531. [DOI] [PMC free article] [PubMed] [Google Scholar]
- Picard Y, Thompson CJ. Motion correction of PET images using multiple acquisition frames. IEEE Trans Med Imaging. 1997;16:137–44. doi: 10.1109/42.563659. [DOI] [PubMed] [Google Scholar]
- Rahmim A, Tang J, Zaidi H. Four-dimensional (4D) image reconstruction strategies in dynamic PET: beyond conventional independent frame reconstruction. Med Phys. 2009;36:3654–70. doi: 10.1118/1.3160108. [DOI] [PubMed] [Google Scholar]
- Reutter BW, Gullberg GT, Huesman RH. Direct least-squares estimation of spatiotemporal distributions from dynamic SPECT projections using a spatial segmentation and temporal B-splines. IEEE Trans Med Imaging. 2000;19:434–50. doi: 10.1109/42.870254. [DOI] [PubMed] [Google Scholar]
- Seo Y, Mari C, Hasegawa BH. Technological development and advances in single-photon emission computed tomography/computed tomography. Semin Nucl Med. 2008;38:177–98. doi: 10.1053/j.semnuclmed.2008.01.001. [DOI] [PMC free article] [PubMed] [Google Scholar]
- Shepp LA, Vardi Y. Maximum likelihood reconstruction for emission tomography. IEEE Trans Med Imaging. 1982;1:113–22. doi: 10.1109/TMI.1982.4307558. [DOI] [PubMed] [Google Scholar]
- Shimizu S, Shirato H, Ogura S, Akita-Dosaka H, Kitamura K, Nishioka T, Kagei K, Nishimura M, Miyasaka K. Detection of lung tumor movement in real-time tumor-tracking radiotherapy. International journal of radiation oncology, biology, physics. 2001;51:304–10. doi: 10.1016/s0360-3016(01)01641-8. [DOI] [PubMed] [Google Scholar]
- Siddon RL. Fast calculation of the exact radiological path for a three-dimensional CT array. Med Phys. 1985;12:252–5. doi: 10.1118/1.595715. [DOI] [PubMed] [Google Scholar]
- Sitek A, Di Bella EV, Gullberg GT. Factor analysis with a priori knowledge--application in dynamic cardiac SPECT. Phys Med Biol. 2000;45:2619–38. doi: 10.1088/0031-9155/45/9/314. [DOI] [PubMed] [Google Scholar]
- Sitek A, Huesman RH, Gullberg GT. Tomographic reconstruction using an adaptive tetrahedral mesh defined by a point cloud. IEEE Trans Med Imaging. 2006;25:1172–9. doi: 10.1109/tmi.2006.879319. [DOI] [PubMed] [Google Scholar]
- Turkheimer FE, Banati RB, Visvikis D, Aston JA, Gunn RN, Cunningham VJ. Modeling dynamic PET-SPECT studies in the wavelet domain. Journal of cerebral blood flow and metabolism: official journal of the International Society of Cerebral Blood Flow and Metabolism. 2000;20:879–93. doi: 10.1097/00004647-200005000-00015. [DOI] [PubMed] [Google Scholar]
- Veress AI, Fung GS, Lee TS, Tsui BM, Kicska GA, Paul Segars W, Gullberg GT. The direct incorporation of perfusion defect information to define ischemia and infarction in a finite element model of the left ventricle. Journal of biomechanical engineering. 2015;137 doi: 10.1115/1.4028989. [DOI] [PMC free article] [PubMed] [Google Scholar]
- Veress AI, Raymond GM, Gullberg GT, Bassingthwaighte JB. Left ventricular finite element model bounded by a systemic circulation model. Journal of biomechanical engineering. 2013;135:54502. doi: 10.1115/1.4023697. [DOI] [PMC free article] [PubMed] [Google Scholar]
- Veress AI, Segars WP, Tsui BM, Gullberg GT. Incorporation of a left ventricle finite element model defining infarction into the XCAT imaging phantom. IEEE Trans Med Imaging. 2011;30:915–27. doi: 10.1109/TMI.2010.2089801. [DOI] [PMC free article] [PubMed] [Google Scholar]
- Verhaeghe J, D’Asseler Y, Staelens S, Vandenberghe S, Lemahieu I. Reconstruction for gated dynamic cardiac PET imaging using a tensor product spline basis. Ieee T Nucl Sci. 2007;54:80–91. [Google Scholar]
- Wehrl HF, Wiehr S, Divine MR, Gatidis S, Gullberg GT, Maier FC, Rolle AM, Schwenck J, Thaiss WM, Pichler BJ. Preclinical and Translational PET/MR Imaging. J Nucl Med. 2014;55:11S–8S. doi: 10.2967/jnumed.113.129221. [DOI] [PubMed] [Google Scholar]
- Winant CD, Aparici CM, Zelnik YR, Reutter BW, Sitek A, Bacharach SL, Gullberg GT. Investigation of dynamic SPECT measurements of the arterial input function in human subjects using simulation, phantom and human studies. Phys Med Biol. 2012;57:375–93. doi: 10.1088/0031-9155/57/2/375. [DOI] [PMC free article] [PubMed] [Google Scholar]
- Zeng GL, Gullberg GT. Iterative and analytical reconstruction algorithms for varying-focal-length cone-beam projections. Phys Med Biol. 1998;43:811–21. doi: 10.1088/0031-9155/43/4/010. [DOI] [PubMed] [Google Scholar]


