Abstract
Dielectric spectroscopy (DS) is an important technique for scientific and technological investigations in various areas. DS sensitivity and operating frequency ranges are critical for many applications, including lab-on-chip development where sample volumes are small with a wide range of dynamic processes to probe. In this work, we present the design and operation considerations of radio-frequency (RF) interferometers that are based on power-dividers (PDs) and quadrature-hybrids (QHs). Such interferometers are proposed to address the sensitivity and frequency tuning challenges of current DS techniques. Verified algorithms together with mathematical models are presented to quantify material properties from scattering parameters for three common transmission line sensing structures, i.e., coplanar waveguides (CPWs), conductor-backed CPWs, and microstrip lines. A high-sensitivity and stable QH-based interferometer is demonstrated by measuring glucose–water solution at a concentration level that is ten times lower than some recent RF sensors while our sample volume is ~1 nL. Composition analysis of ternary mixture solutions are also demonstrated with a PD-based interferometer. Further work is needed to address issues like system automation, model improvement at high frequencies, and interferometer scaling.
Index Terms: Dielectric spectroscopy, microfluidics, microwave sensor, permittivity
I. Introduction
Dielectric spectroscopy (DS) measures the complex permittivity of materials over a broad frequency range. It is a powerful technique for scientific investigations and technological developments in various areas, including chemistry, biology and micro-total-analysis systems (μ-TAS) [1]. For chemistry, DS between 102 and 107 Hz has been developed to obtain mobile ion concentration level and ion mobility, which are of great interest for developing secondary ion batteries and fuel-cell membranes [2]. DS between 1 MHz and 20 GHz has been used to determine the dielectric constants of imidazolium-based ionic liquids [3], which are developed as environmentally benign solvents. The dielectric constant values are important for solvent behavior modeling, which often depends on the dielectric continuum models of the solvent. Furthermore, dielectric spectroscopy can investigate the relaxation processes occurring in aqueous solutions in an extremely wide time range. Thus, it is one of the most important methods for the study of polyelectrolyte-solution structure and dynamics [4], such as the molecular structures of aqueous urea solutions [5]. For biology, dielectric spectroscopy has been used to study the relaxation of DNA aqueous solutions [6], to investigate the collective vibrational modes of proteins, DNAs and oligonucleotides (from 60 GHz to 2 THz) [7], to help understand protein folding and unfolding processes [8], to explore the dynamic processes at the protein-solvent interface (from 300 kHz to 20 GHz) [9], to quantitatively assess the Debye dielectric model of membrane lipid bi-layers [10] and to characterize tissues [11]. For μ-TAS development, such as electronic flow-cytometers [12] for single cell detection and identification [13], [14], DS is promising to be a label-free method.
Sensitivity is critical for these applications. The strong interest in minimizing the volume and concentration level of chemical and biomedical samples has further emphasized the need for high-sensitivity operations. Small volumes save materials. This is especially important for studying minute amounts of precious samples. Low concentration levels avoid the interactions among analyte molecules, which is important for potentially label-free molecular identifications [15] without using additional recognition molecules. Different approaches have been explored to improve sensitivities, including differential measurements of signals from electrode pairs [12] and the development of nanometer electrodes. Among the efforts, resonance-based methods achieved higher sensitivities. Examples include the recent planar resonator for single-cell capture and measurement [16], the resonant circuit for single particle detection and counting [17] the resonant filters for biological and chemical sensing [18], the resonant structure for femtomolar DNA detection [19], the cavity-enabled microwave imaging for DNA sensing [20], and the whispering gallery-mode resonator for aqueous solution measurement [21]. Nevertheless, these devices are still limited in sensitivity since their quality factors are modest except for the whispering gallery-mode resonators, which have an unloaded Q as high as ~1.1 × 10⁵ [21]. However, the Q values degrade significantly when a lossy sample, e.g., water solutions, are introduced. In addition, dielectric resonators need sophisticated fabrication processes and more complicated liquid-handling procedures. As a result, it is of great interest to develop new and highly sensitive DS techniques.
Broadband measurements are also essential for many applications, such as those discussed in the first paragraph. Additionally, the potential resonant absorption of microwaves by molecules and viruses [22], [23], the potential electrical identification of individual cells [15], and the development of microwave microdosimetry [24] need broadband RF measurements. Straight transmission lines are very broadband, but with relatively low sensitivity [25]; tunable RF resonators [11], [26], [27], harmonic-frequency/multimode resonators, and whispering gallery-mode resonators [28] can operate at a wide frequency range, but their sensitivities are still limited, as discussed above.
Recently, we proposed and demonstrated an interference-based approach for high-sensitivity DS measurements over a wide frequency range [29]. A quadrature-hybrid (QH)-based implementation is also presented [30] and used in the detection and analysis of DNA solutions [31]. It is shown that the interferometers are convenient for introducing test samples and highly flexible for choosing sensing electrode structures. In this work, we further analyze the design and operation of the interferometers, introduce corresponding algorithms to quantify material-under-test (MUT) properties from measured scattering parameters, and improve interferometer stable operation sensitivity while presenting high-sensitivity measurement results of glucose solutions as well as the detection and identification of molecular components of ternary aqueous solutions.
This paper is arranged as follows. Section II presents the design and analysis of the interferometers. Section III describes the measurement results of glucose–water solutions and composition analysis of aqueous samples. Section IV concludes the paper.
II. Interferometer Design and Analysis
Basic interference principles, which use a reference branch and a MUT branch, have been exploited for measuring material properties, such as the dielectric properties of water with directional couplers and isolators [32]. Microwave bridges that are commonly used in electron-spin resonance (ESR) spectrometers also resemble such an approach even though a resonator is usually included in the MUT branch [33]. In these previous efforts, sample volumes are often large and/or analyte concentration levels are high. Thus, MUT effects, e.g., loss, are significant. As a result, probing signals in the MUT branch and reference branch can be significantly different. For small MUT volume and low analyte concentration levels, however, MUT effects are minimal. Therefore, the use of interference principles and their implementations need to be reevaluated for high-sensitivity and broadband operations, as indicated in [29]. Furthermore, models need to be established to obtain MUT properties from scattering parameters. The models should include micro- and nano-fluidic channels, which are often convenient choices to introduce MUT to the sensing zones.
A. Power-Divider-Based RF Interferometers
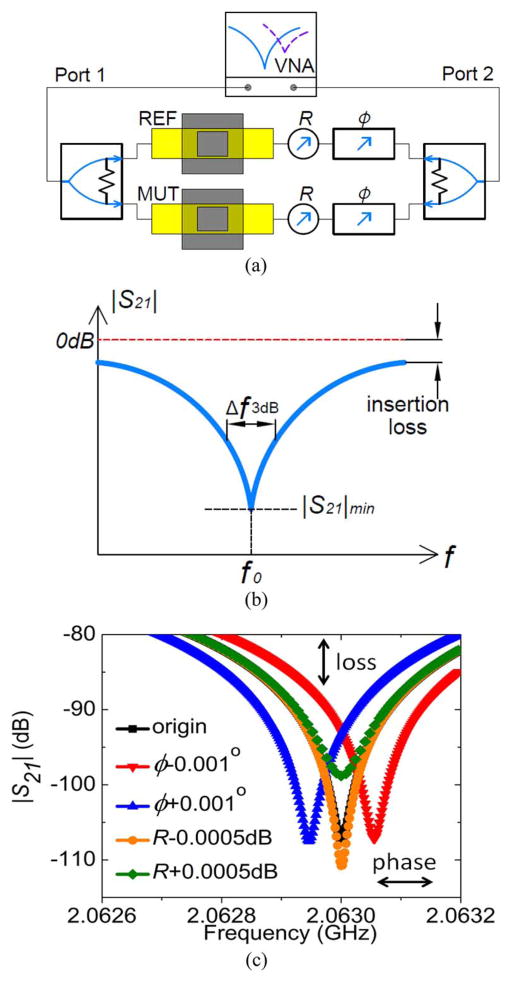
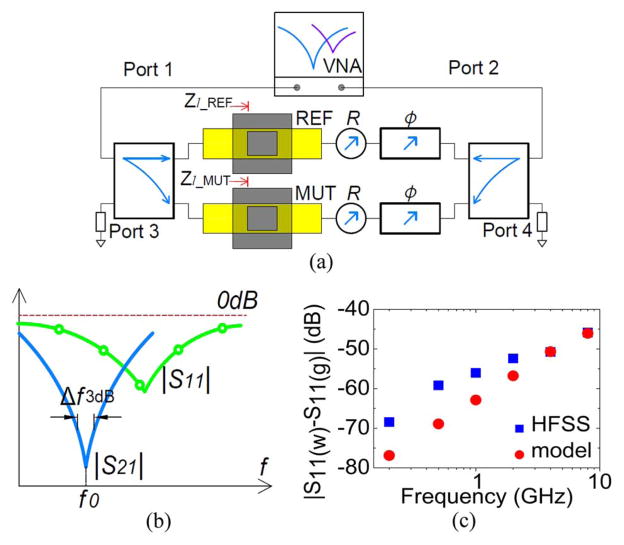
Fig. 1(a) shows the schematic of an RF interferometer that is based on broadband 3-dB power dividers (PD). Fig. 1(b) illustrates the magnitude of transmission scattering parameters. The tunable phase shifters (Φ) are used to tune the operating frequencies, f0, at which the probing signals from the reference branch and the MUT branch have destructive interference, i.e., 180° phase difference. The tunable attenuators (R) are used to tune the signal balance between the two branches. Thus, the sensitivity of the interferometer is also tunable, as shown in Fig. 1(c). In the analysis, the MUT and REF TL sections in Fig. 1(a) are first simulated with High Frequency Structural Simulator (HFSS) to obtain their scattering parameters. Then the S-parameters are imported into the whole system in Fig. 1(a) modeled with Advanced Design System (ADS). Adjusting the phase shifter and attenuator modules in ADS, an |S21|min of ~−106 dB, origin in Fig. 1(c), is obtained. The tuning in Fig. 1(c) is obtained by changing the value of only one phase shifter or attenuator. The TLs used in the HFSS simulations are conductor-backed coplanar waveguides (GCPWs) with the cross section illustrated in Fig. 4. The dimensions are 1/2/1 mm for g/s/g with 787-μm-thick Duroid 5870 substrate, which has a relative dielectric constant of 2.33. Copper thickness is 17 μm. The MUT zone has PDMS wells that are 3 mm high and 3 mm long to hold liquids. The power dividers in Fig. 1(a) should provide isolations between their two output ports, i.e., between the MUT branch and the REF branch in Fig. 1(a). Hence, Wilkinson power dividers are convenient choices. The use of two phase shifters and two attenuators, instead of only one attenuator and one phase shifter that are necessary for the interferometer, adds more tuning flexibilities.
Fig. 1.
(a) Schematic of a power-divider-based RF interferometer, which includes a network analyzer for probing signal generation and detection. The yellow rectangles indicate TLs. (b) Diagram of transmission scattering parameter |S21| indicating the operating frequency f0. (c) Tuning of sensor sensitivity with R and operating frequency with Φ in (a).
Fig. 4.
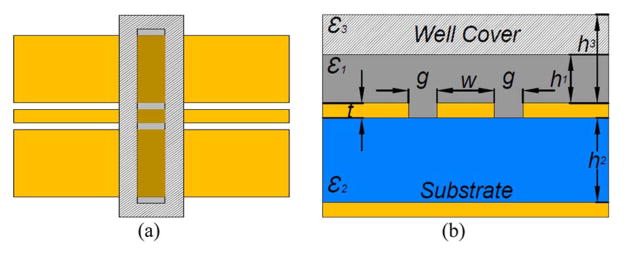
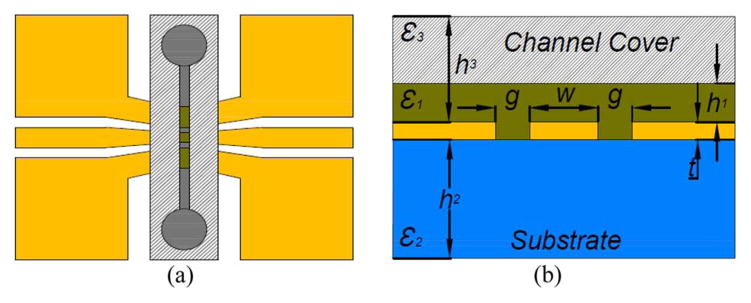
(a) Top view and (b) cross section view of the GCPW MUT section.
In Fig. 1(a), different transmission lines (TLs), such as coplanar waveguides (CPWs), GCPWs, and microstrip lines, can be used to transmit RF probing fields. Simple TLs introduce less insertion loss, enable broadband operations, and simplify system design, fabrication, as well as data processing. Additionally, micro- and nano-fluidic channels can be easily integrated with planar TLs.
The sensitivity of the interferometer is determined by the insertion loss (IL) of the circuit components and the achievable |S21|min, i.e., the effective quality factor Qeff = f0/Δf3dB, as illustrated in Fig. 1(b). Thus, the use of two-way 3-dB power dividers yields high sensitivity when compared with other power-division ratios since no additional attenuation is needed to balance the two branches if MUT and reference materials (REFs) are identical. The insertion loss argument also indicates that the arrangement in Fig. 1(a) has higher sensitivity than previous systems [32].
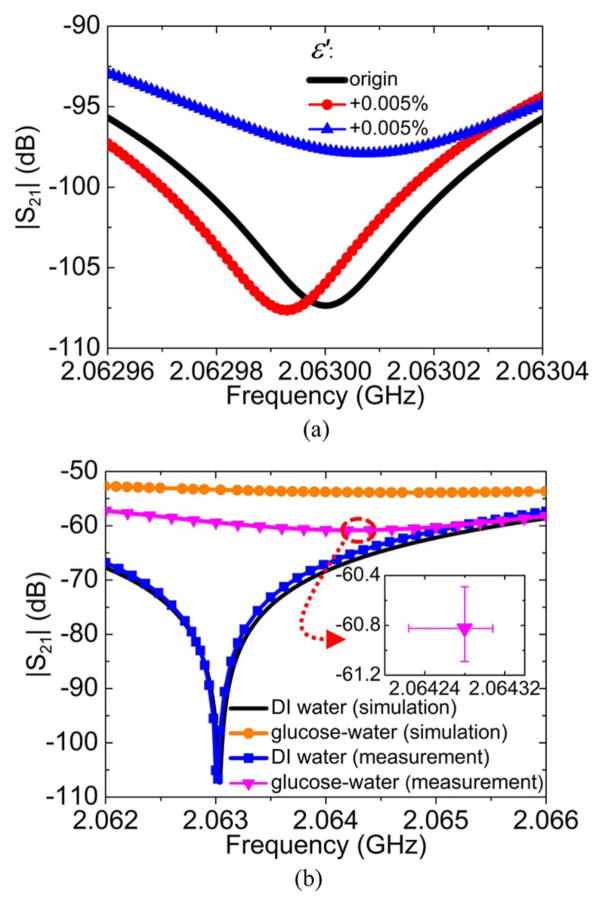
The VNA in Fig. 1 can often generates low-phase-noise RF probing signals, i.e., highly coherent probing signals. The VNA also detects the probing signals over a large dynamic range. Thus, Qefff can be very high, higher than 106 with lossy water as MUT though stability is an issue therein [29]. Such Qeff value is comparable with that of the highly sensitive optical microresonators [34] and enables the measurement of minute changes of MUT properties (ε = ε′ − jε″ = ε′(1 − tanδ)), as indicated in Fig. 2(a) and (b). The results are obtained with the TLs for Fig. 1(c) and through HFSS and ADS simulations.
Fig. 2.
(a) Simulation analysis of the interferometer in Fig. 1 when ε′ changes by 0.005% while tanδ = 0.0975. (b) Simulated and measured results of glucose–water mixture with glucose concentration at 0.1 mol/L. To test measurement repeatability, i.e., to obtain the error bar in (b), inset, multiple measurements are conducted. In each group, we first use DI water as MUT and tune |S21|min to a given point. Then glucose–water solution is measured to obtain sensor responses.
A few observations can be made. First, Fig. 2(a) shows that a change of Δε′/ε′ ≈ 5 × 10⁻⁵ while keeping tanδ constant causes significant changes of |S21|min and f0. Such changes are easily measurable, as further indicated by the measured results in Fig. 2(b), where Δε′/ε′ ≈ 1%. Thus, the RF interferometer has a sensitivity comparable or better than the backscattering interferometry, which can measure Δn/n ≈ 10−9 and are developed for single molecule studies [35]. The nonsymmetric effects of +Δε′/ε′ and −Δε′/ε′ in Fig. 2(a) are related to the initial balance between the REF and MUT branches. When Δε′/ε′ = 0, an ideal balance would yield |S21|min → −∞. The finite |S21|min value and subsequent changes in Fig. 2(a) indicate that MUT branch has somewhat higher loss than the REF branch. It can be shown that when Δtanδ/tanδ = ±0.005% while keeping ε′ constant causes both |S21|min and f0 changes, but at much smaller, yet detectable, values. Second, unlike Δε, minute tuning of phase shifters or attenuators in Fig. 1 only induces f0 shift or|S21|min value change, as shown in Fig. 1(c) since R and Φ are decoupled. Third, the simulated |S21|min change in Fig. 2(b) agrees with measured results reasonably well, where an error bar is also drawn to indicated the uncertainty of measured |S21|min. The number of repeated measurements is five here and hereafter, i.e., Figs. 10–12. In the simulation and measurement, DI water and glucose-water solution (at 0.1-mol/L concentration level with ε = 76.79 − j7.49) are used in MUT section. The agreement helps validate the simulation analysis in Fig. 2(a)–(b).
Fig. 10.
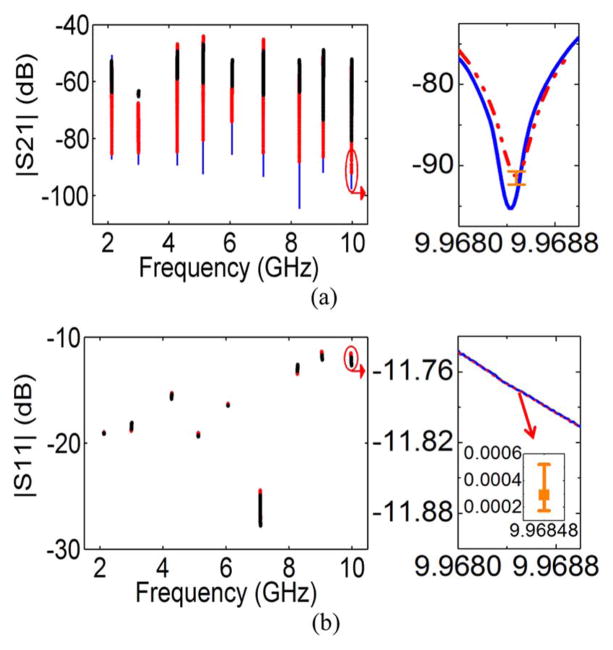
Measured (a) S21 and (b) S11 from ~2– ~10 GHz and a zoom-in view at ~10 GHz (blue solid line, I: DI water; red dashed line, II: glucose-water; black circles: methanol-water). The error bar in (b) shows the range of |S11| difference for water (w) and glucose-water (g) at the frequency f0, i.e., |S11|w − |S11|g (dB).
Fig. 12.
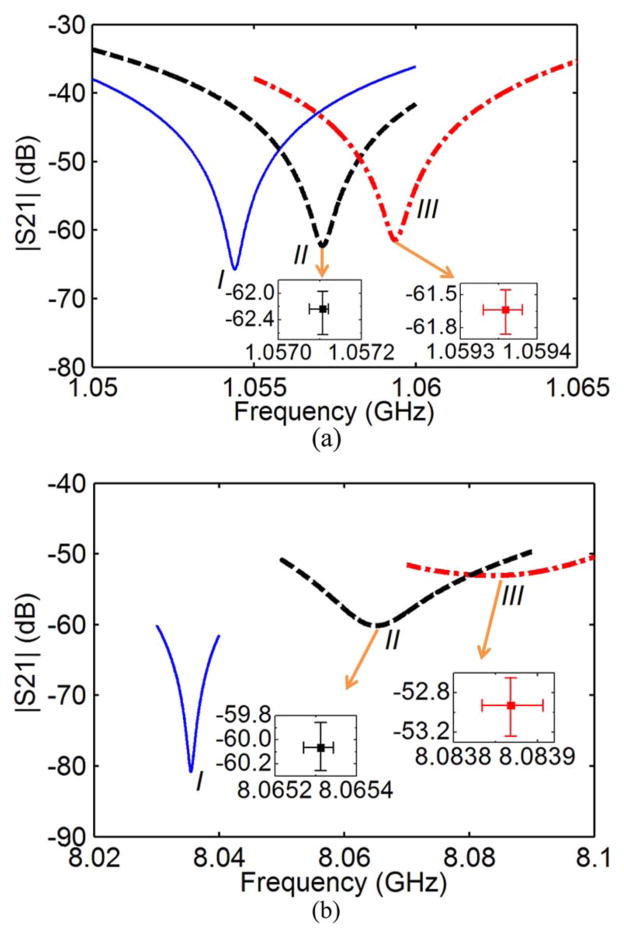
S21 measurement result (m: 0.01; p: 0.01) at (a) ~1 GHz and (b) ~8 GHz (blue solid line, I: DI water; black dashed line, II: 2-propanol-water; red dash-dot line, III: methanol-2-propanol-water).
The tuning range of f0 is determined by the bandwidth of the circuit components in Fig. 1(a). Thus, tuning f0 over a decade is achievable since a decade bandwidth is fairly common for broadband circuit components. For wider f0 tuning range, switches can be used to combine multiple RF interferometers, as shown in [29]. Thus, highly sensitive and broadband interferometers can be easily designed and built.
From the obtained |S21|min and the corresponding f0, the signal propagation constant γMUT = (αc + αd) + jβ of the MUT TL section can be obtained through the following considerations. First, the obtained S21(MUT) can be described as
| (1) |
where coefficients K1 and K2 include the signal transfer functions of all of the components in MUT and REF branches, respectively, except for the MUT and REF TL sections. Since the attenuators and phase shifters often do not have accurate and high-resolution readings, then two additional calibration liquids have to be used to eliminate the coefficients K1 and K2 for data processing. Accordingly, we have S21(cal1) and S21(cal2) by replacing γMUT with γcal1 and γcal2, respectively, where subscripts cal1 and cal2 are for two different calibration liquids. Now the coefficients K1 and K2 can be eliminated to give
| (2) |
As a result, γMUT is obtained from S-parameter measurements since γcal1,2, and lMUT are known.
The above analysis ignored the effects of mismatches between MUT/REF section and their adjacent 50-Ω sections. For S11, the reflection is partly absorbed by the power dividers. For S12, mismatch effects are included in its accurate expression [36]
| (3) |
where Z is the characteristic impedance of the Reference/MUT section. A constant ratio of S21(branch)/exp(−γl) for CAL and MUT indicates that reflection can be ignored. For calibration liquids and MUT with close permittivity values in this work, e.g., DI water, methanol-water and 2-propanol-water both with 0.005 and 0.01 mole fractions, respectively, the ratio at 6 GHz is (1.54 ~ 1.58)√(−0.04 ~ −0.03), which can be considered to be a constant. Consequently, the calibration process and the use of the simplified S21 in (2) can be used for simplified extraction of extract MUT permittivity. However, for large permittivity differences, better matched REF/MUT lines should be considered or (3) should be used. As a result, data processing is a lot more involved.
The next step is to obtain MUT dielectric properties, ε = ε′ − jε″, from γMUT as long as the relationship between these parameters are established. In the following subsections, we identify such relationships for the most commonly used CPWs, GCPWs, and microstrip lines. Micro- and nano-fluidic channels are also included.
a) CPW-Based MUT Sections
Fig. 3 shows the top and cross-sectional views of CPW-based MUT TL section together with a microfluidic channel. The capacitance of a uniform CPW with the cross section in Fig. 3(b) can be written as the superposition of four partial capacitances [37]
Fig. 3.
(a) Top view and (b) cross section of a CPW MUT section.
| (4) |
The configurations for the calculation of these partial capacitances are similar to those in [37]. The expressions of C0 ~ C3 are [37]
| (5) |
| (6) |
| (7) |
| (8) |
where , k′ = (1 − k2)0.5, K(k) is the complete elliptic integrals of the first kind with modulus k0 = w/(w + 2g), ki(i = 1, 2, 3), and
| (9) |
The effective permittivity of the CPW is
| (10) |
where the real and imaginary parts of the permittivity are [38]
| (11) |
| (12) |
where filling factors q0 = (2a0 − a2 − a3)/(2a0), q1 = a1/(2a0), q2 = a2/(2a0), and q3 = (a3 − a1/(2a0).
The dielectric loss αd is determined by the substrate, MUT liquids, and the channel cover material
| (13) |
The conductor loss αc of the center signal line and the ground planes can also be calculated. But its effects will be cancelled out in (2).
For phase constant β, it depends on the relative effective dielectric constant εr,eff
| (14) |
Thus, MUT permittivity ε = ε′ − jε″ can be obtained from with γMUT = (αc + αd) + jβ (13) and (14).
b) GCPW-Based MUT Sections
For the GCPW-based MUT TL section, shown in Fig. 4, the total capacitance is similar to (4).
The expressions of C1 and C3 have the same forms as (6) and (8). However, C0 and C2 have to be changed to include back conductor. The derivation for them in [39] can be applied to our case with the assumption that the height of upper shielding is much larger than w and g, shown as follows:
| (15) |
| (16) |
where ai(i = 0, 2) can be found in [29]. Then, (11) and (12) can be used to calculate the real and imaginary parts of the effective permittivity, where q0 = (a0 − a1 − a3)/(a0 + a2), qi = ai/(a0 + a2) (i = 1, 2, 3). Equations (13) and (14) can be used to extract MUT permittivity.
c) Microstrip Line-Based MUT Sections
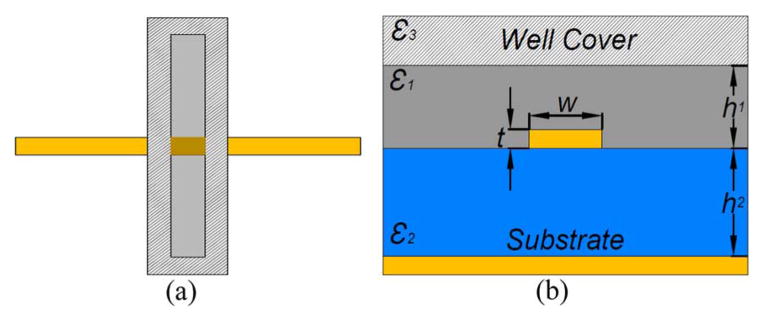
For microstrip line-based MUT TL sections, shown in Fig. 5, the effective permittivity can be solved by using the conformal mapping method [40], [41].
Fig. 5.
(a) Top view and (b) cross section of the microstrip-line MUT section.
Then, we have
| (17) |
| (18) |
where for w/h2 ≥ 1, filling factors q1 ~ q3 can be written as
| (19) |
| (20) |
| (21) |
where the effective line width is
| (22) |
and the quantity is
| (23) |
for w/h2 ≥ 1, q1 ~ q3 can be also found in [41].
With the assumption of , (18) is an empirical expression we proposed to evaluate the imaginary effective permittivity. The dielectric loss αd can be determined by
| (24) |
The phase constant β is described with (14).
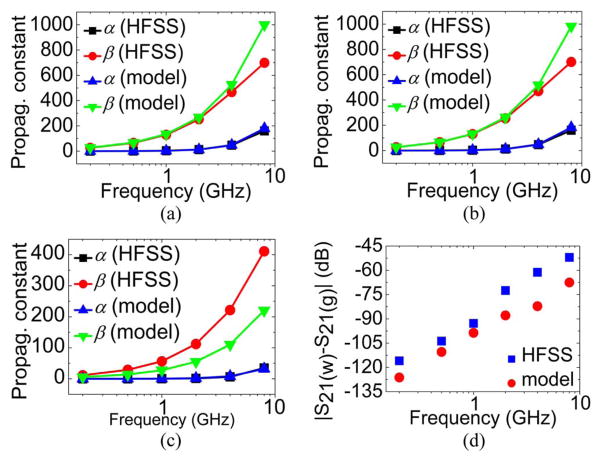
These models have been partially verified in [37]–[39] even though the dimensions used therein are quite different from those of on-chip TLs. Here we use HFSS simulations to further substantiate the models for our targeted applications. The dimensions of the simulated GCPW, CPW and microstrip line are listed in Table I. Polydimethylsiloxane (PDMS, ε = 2.3) channels, which are used in our experiment in Section III-A, are considered as sample holders. Frequency-dependent PDMS loss is ignored, i.e., , since no reported data are available and the loss does not affect the discussions below. The effective permittivity values of MUT (i.e., DI water and glucose-water mixture with 0.1 mol/L) can be found in [42]–[44]. Then, the calculated (modeled) and simulated (HFSS) propagation constants for the CPW, GCPW and microstrip line MUT sections are shown in Fig. 6(a)–(c). The results show that models agree with simulations at low frequencies, below ~4 GHz for CPW and GCPW lines, but below ~1 GHz for microstrip lines. At higher frequencies, large discrepancies occur, especially for the model of microstrip lines. The discrepancies are probably inherent to the conformal mapping techniques used to obtain the models since conformal mapping is for dc analysis. Additionally, the partial capacitance method assumes that the electric field lines are parallel to the surface of each dielectric layer [37]. Such approximation is less accurate at high frequencies.
TABLE I.
Parameters Used for Model Verification
| Parameter | Symbol | Value |
|---|---|---|
| Thickness of metal layer | t | 0.5 μm |
| Thickness of substrate | h2 | 1 mm |
| Relative dielectric constant of substrate | ε2 | 3.75 |
| Length of MUT zone | lMUT | 0.5 mm |
| Height of MUT zone | hl | 50 μm |
| Dimension of CPW | g/w/g | 7.2/6/7.2 μm |
| Dimension of GCPW | g/w/g | 7.2/6/7.2 μm |
| Dimension of microstrip line | w | 6 μm |
Fig. 6.
Calculated and simulated propagation constants for sensing electrode. (a) CPW. (b) GCPW. (c) Microstrip line. (d) S21 magnitude differences of the CPW-based MUT TL line.
To predict the sensitivity level needed for MUT characterization in Fig. 1(a), Fig. 6(d) shows the S21 magnitude differences when the CPW TL in Table I is used for MUT and REF sections. It is obtained with the calculated and simulated propagation constants in Fig. 6(a) through
| (25) |
where lREF is equal to lMUT. DI-water is used as reference and glucose-water mixture (0.1 mol/L) as MUT. The results indicate reasonable agreement between simulations and models. They also indicate the anticipated interferometer output level, as shown in (1) where the magnitudes of K1 and K2 are close to 1 for a reasonably designed system. Therefore, Fig. 6 shows that the models in this section are reasonable for interferometer performance prediction.
Fig. 7(a) summarizes the algorithm for extracting material property ε = ε′ − jε″ = ε′(1 − tanδ) from scattering parameters. Fig. 7(b) and (c) shows the liquid permittivity versus frequency obtained from simulated |S21|min by use of the algorithm with the CPW used to obtain Fig. 6 and the procedures used for Fig. 1(c). Additionally, in ADS analysis, |S21|min of ~ −90 to ~−100 dB is used. The cal1 and cal2 are DI water and 2-propanol-water solution at 0.01 mole fraction concentration level, respectively. MUT is glucose-water solution at 0.1 mol/L concentration level. The complex permittivity of these solutions can be found in [42] and [44]. The reasonable agreement between given permittivity values and calculated permittivity values indicates the validity of the proposed models, procedures, and algorithms for material property extraction.
Fig. 7.
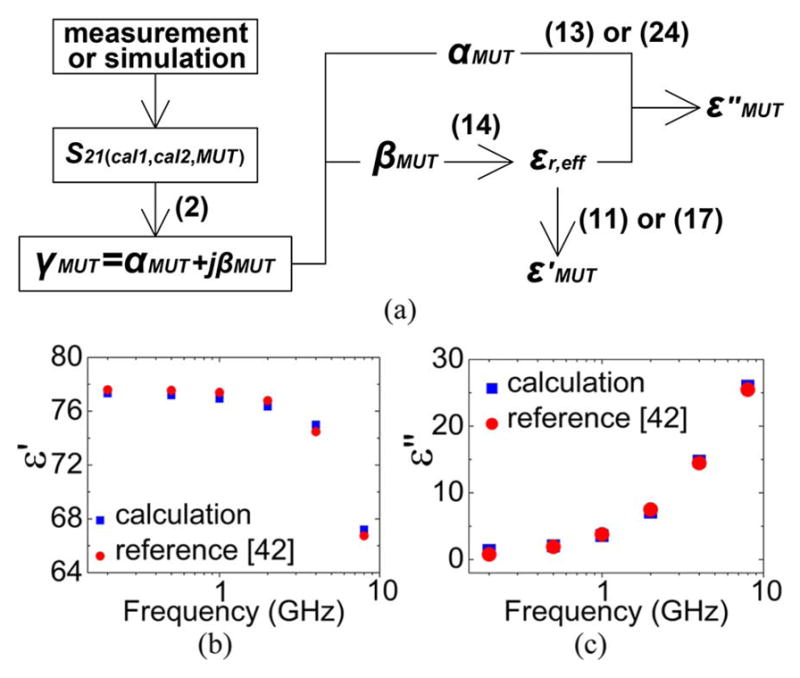
(a) Algorithm to obtain MUT permittivity values from S-parameters. (b), (c) Calculated glucose–water permittivity from S21,min, which is obtained with HFSS and ADS simulations. The CPW-based MUT TL lines are used in the calculation.
B. Quadrature-Hybrid (QH)-Based RF Interferometers
Power dividers in Fig. 1(a) can be replaced with broadband QHs, as shown in Fig. 8(a). Compared with power-divider implementation, the QH implementation enables the use of reflected RF probing signals, e.g., S11 in Fig. 8(b) [30], in addition to transmission signal S21. The use of S11 also helps to address the uncertainties that appear in obtaining phase constant βMUT from propagation constant [30]. The use of S21 will not be repeated below.
Fig. 8.
(a) Schematic of an interferometer that is based on QHs. (b) Diagram of |S21| and |S11|. (c) |S11| differences of a CPW-based MUT TL.
To use S11to obtain MUT properties, it is easy to show
| (26) |
where ZL(MUT) is the impedance looking towards attenuators and phase shifters at the MUT branch [30]. Matching consideration is assumed between adjacent circuit components except the MUT TL section, which has a characteristic impedance of ZMUT. For CPW and GCPW, it can be written as [37]
| (27) |
For microstrip line, the following expression can be used [40]:
| (28) |
which is valid for w/h2 ≥ 1, and the expression for w/h2 ≥ 1 is also given in [40].
The obtained scattering parameters S11 and S21 can be combined to obtain MUT permittivity [30]. The use of S11 for MUT detection is also highly sensitive even though the measured S11 does not yield an effective Q that is nearly as high as that from |S21|min. The high sensitivity is enabled by the differential nature of the reflections from MUT and REF branch in Fig. 8(a). The differential operation of S11 in (26) removes reflections from mismatches occurred mainly at quadrature-hybrid connections. These reflections are part of the measured S11 data for each individual measurement and cause much higher |S11| values (e.g., −20 dB) than |S21|min values (e.g., −100 dB). Thus, the smallest |S11| change measured by VNA determines S11-related sensitivity. Typical long term measurement uncertainty of |S11| is better than 0.005 for commercial VNAs. For our measurements at each frequency point, we observed that S11 is stable at the fifth digit, which corresponds to a level of −100 dB. It implies that our differential S11 measurement has the potential to achieve a sensitivity that is comparable to that of |S21|min.
Fig. 6(d) shows the changes of S21 for the given CPW MUT TL sections. The changes of S11 of the same TL sections are shown in Fig. 8(c). Similar S11 and S21 changes in Figs. 6(d) and 8(c) suggest that both approaches may yield similar sensitivity levels though the changes depend on factors like lMUT. Therefore, S11 and S21 can be combined together for data processing. Furthermore, if a four-port network analyzer is used, then S31 and S41 in Fig. 8(a) provide information about RF energy absorbed by the MUT. Such information is important in chemistry and biology studies, e.g., in the study of potentially resonant absorption by molecules and viruses [22], [23].
III. High Sensitivity Interferometer Operation and Composition Analysis of Ternary Aqueous Samples
The operating principles of the two types of interferometers in Figs. 1(a) and 8(a) have been demonstrated [29], [30]. In this work, the QH-based interferometer is further improved for stable operations at much higher sensitivity levels. The improved performance is demonstrated by measuring glucose solutions at a concentration level ten times lower than that in [45]. At the same time, the effective MUT volume is only ~1 nL. We further demonstrate the analysis of molecular compositions of ternary solutions with a power-divider based interferometer. Such capabilities may lead to some interesting applications, including non-invasive, label-free detection and identification of molecules [15].
A. High-Sensitivity Measurements: Glucose–Water Solution
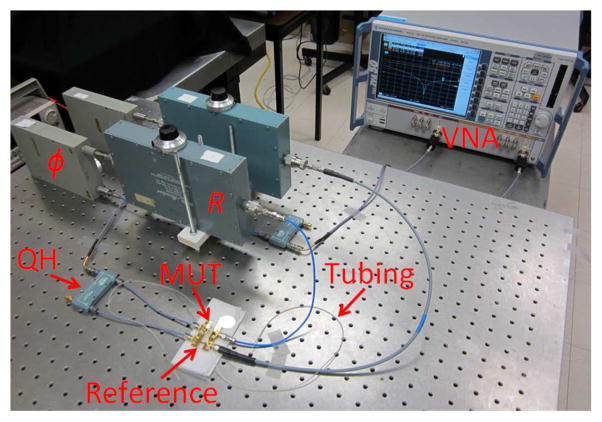
The CPW TL MUT section is fabricated with standard microfabrication techniques on 1-mm-thick fused silica substrate. A 500-nm-thick gold film on top of a 10-nm-thick Ti adhesion layer is deposited as CPW sensing electrode. Microfluidic channels, 500 μm wide and 50 μm high, are incorporated with the CPW for MUT handling. HFSS simulation indicates that the channel has an insertion loss of 0.54 dB at 6 GHz with water as MUT. The small loss does affect measurement sensitivity, but negligible in our measurements. Fig. 9 shows the measurement setup, where VNA, phase shifters and attenuators are marked, for glucose–water solution measurements. The CPW lines for MUT and references are covered with thick PDMS slabs to eliminate deposition of micro-particles from the measurement environment onto CPW surfaces. These particles and the mechanical stability of the cables and connections in Fig. 9 affect achievable |S21|min, which is improved by 15–20 dB in this work when compared with that in [30]. The Qeff magnitude is improved from ~104 to ~105. The micro-particles are mainly from air in the measuring environment. Fig. 9 shows measured S21 and S11 of glucose-water solution at 5 mg/dL (~0.0002 mol/L) from ~2 – ~10 GHz. The concentration level is ten times lower than that in [45], which aims at non-invasive measurements of glucose in blood vessels. DI water and methanol-water solution (at 0.005 mole fraction) are used as calibration liquids for this measurement.
Fig. 9.
High-sensitivity interferometer measurement setup.
The liquid volume that is directly above the CPW signal line and signal-ground gaps for test in Fig. 8(a) is ~0.51 nL. Therefore, the effective MUT volume is ~1 nL in our measurements. The insets in Fig. 10 show that even smaller MUT volumes and lower glucose concentration levels can be accurately measured.
For our measurement |S21| level, the uncertainty is <0.3 dB (from −75 to −100 dB). No data are available for |S21| < −100 dB. But we assume the measurement accuracy is better than 5%. Furthermore, the reported uncertainty is for long term operations and a temperature change from 18°C to 28°C. Thus, for our short term measurements, the uncertainty level should be much smaller. Moreover, using (2) and (26), the long-term uncertainty components occurred in each scattering parameter can be partly cancelled.
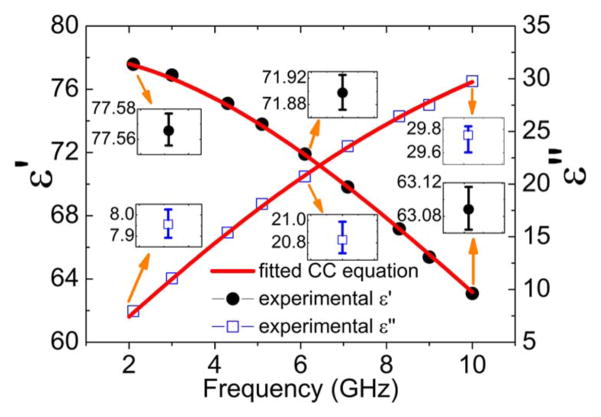
Fig. 11 shows the calculated permittivity of glucose-water solution by following the algorithm in Fig. 7(a). Based on the calculated results, the Cole-Cole (CC) equation in [42] can be fitted through a least-square fitting approach, also drawn in the same figure. Table II lists all fitting parameters in the CC equation. The uncertainty of the reference material property also propagates to the extracted MUT properties. For instance, the calculated 5 mg/dL glucose–water permittivity value is 77.57 – j7.96 at ~2 GHz if the permittivity of the calibration liquid methanol-water (at 0.005 mole fraction) is 77.02 – j8.10 [43]. A +1% uncertainty, i.e., a deviation of 0.77 – j0.08 of methanol-water permittivity, induces a +1% shift of glucose-water solution permittivity to 78.30 – j8.04. If we repeat the same process again at ~10 GHz, the permittivity changes from 63.10 – j29.66 to 63.18 – j29.75, which is smaller than 1% shift. The larger uncertainty at relatively lower frequency point is caused by closer permittivity values among calibration liquids 1 and 2 and MUT.
Fig. 11.
Permittivity, ε = ε′ − jε″, of glucose–water solution at 5 mg/dL.
TABLE II.
Fitting Parameters for Glucose–Water Solution at Different Concentrations
| Parameter | Fitting values
|
|||
|---|---|---|---|---|
| 0.0002 mol/L | 0.001 mol/L | 0.01 mol/L | 0.1 mol/L | |
| ε0 | 78.36 | 78.52 | 77.9 | 77.6 |
| τ1 | 8.15 ps | 8.21 ps | 8.18 ps | 7.57 ps |
| τ2 | 8.17 ps | 9.79 ps | 9.50 ps | 11.8 ps |
| a1 | 72.1 | 71.7 | 70.4 | 64.5 |
| a2 | 1.1 | 2.02 | 2.6 | 10.1 |
Glucose–water solutions of different concentration levels are also measured with their permittivity values at each frequency point obtained. Part of the results is summarized in Table II with their fitting parameter values. It shows that the techniques can be applied to measure solutions with wide range concentration variations. The parameters also show two types of Debye processes (high-frequency process: subscript 1; low-frequency process: subscript 2) contribute to the dielectric spectrum of glucose–water solution [42]. With the concentration level increased, the fitting parameters a1 and a2 change in opposite directions, which suggest that the low frequency process is more significant. Parameters τ1 and τ2 also demonstrate such a trend. The change trend of ε0 suggests that the static permittivity decreases with the increase of glucose molecules due to the glucose related low frequency processes. The non-monotonic variations of ε0, τ1 and τ2 versus concentration level are probably due to measurement errors.
When the MUT (e.g., ethanol–water mixture) permittivity is changed significantly from that of the calibration materials (e.g., an ε′ change of ~30), MUT causes large frequency shift and |S21|min change. As a result, the extracted permittivity values deviate from previously published values significantly. The main reason for the discrepancy is the “nonlinear” response of the interferometer. Further investigation is needed about this issue.
For the 0.0002-mol/L solution, if we assume that a glucose molecule is 1 nm long [46], and the glucose is uniformly dispersed in DI water, then, the distance between two adjacent glucose molecules is 17.16 nm. The obtained results show that the RF interferometers with nanometer sensing electrodes are promising for measuring the properties of single glucose molecules in solutions.
B. Composition Analysis of Aqueous Samples
The GCPW TLs for Fig. 2(b) and the power divider-based measurement setup in Fig. 1(a) are used here. PDMS wells with a 3-mm lMUT are attached to the GCPWs to hold REF and MUT solutions, which has a volume of 200 μL. The HFSS simulation indicates that the GCPW section has an insertion loss of 1.75 dB at 6 GHz with water as MUT.
Three solution samples, methanol, 2-propanol, and water, are used for measurements. The mole fractions of the mixtures are listed in column 1 of Table III. Fig. 12 shows measurement results for methanol-2-propanol-water solution (m: 0.01; p: 0.01) at ~1 GHz and ~8 GHz. DI water and 2-propanol-water mixture solution with a mole fraction of 0.01 are used as calibration liquids. The measurement setup is similar to that in Fig. 9.
TABLE III.
Composition Analysis of Methanol-2-Propanol-Water Solutions With Different Mole Fractions
| Sample (m&p) | Measurement result
|
|
|---|---|---|
| Permittivity (1 GHz&8 GHz) | mole fraction | |
| 0.01&0.01 | 76.71&66.02 | 0.0130&0.0130 |
| 0.005&0.01 | 77.17&66.31 | 0.0032&0.0139 |
| 0.01&0.005 | 77.07&65.93 | 0.0156&0.0069 |
The permittivity of the solutions can be obtained with the algorithm described in Fig. 7(a) and are shown in column 2 of Table III.
One way to identify the concentration levels of the solution components is to exploit the relative dielectric constant expression [47], [48]
| (29) |
where and are relative dielectric constants of pure methanol and 2-propanol. Factors x and y are the mole fraction of methanol and 2-propanol, respectively. The excess function εE has been eliminated since the interactions between different molecules are expected to be weak under low mole fractions, as described in [47], [48].
Substituting these data and the corresponding permittivities of pure water, methanol and 2-propanol [43], [44] into (29), x and y can be found as 0.0130 and 0.0130, respectively. Table III also summarizes the results for the other two samples. These results indicate that the obtained solution composition levels are reasonable even though further work is needed to improve the accuracies.
In addition to sensitivity and frequency coverage range, measurement uncertainty (δεMUT) is also an important consideration in practical applications [10], [49]. The factors that affect δεMUT include the accuracy of the VNA (δVNA), the uncertainty of the reference liquid properties (δεCal) and the measurement procedures. The cascaded calibration-liquid and MUT measurement process at each frequency point significantly reduce the effects of δVNA since any long-term drifting of VNA is removed. Such drifting is a VNA accuracy limiting factor even though commercial VNA accuracies are often better than 1%. As a result, δεCal is the main factor of δεMUT. It can be shown that δεMUT is comparable to δεCal in our measurements. However, the issue of analyzing and minimizing δεMUT, including the choice of calibration liquids and repeatable handling of liquids which contribute to the errors in Table II, needs further investigations.
Currently, the interferometers are operated manually. It can be time consuming for broadband measurements. Therefore, automating the processes is highly desirable. In addition to automated fluid handling, the use of high-resolution, electronically controllable attenuators and phase shifters help address this issue. Furthermore, time domain measurements will help reduce the measurement time. It is also desirable to further improve the sensitivity of the interferometers. However, stable, high resolution, and tunable attenuators and phase shifters, as indicated in Fig. 1(c), need to be developed.
The interferometers in Figs. 1 and 8 are passive systems. Therefore, they are scalable in both frequency and transmission-line dimensions. At terahertz (THz) frequency, such an interferometer can help improve the sensitivity of current THz dielectric spectroscopy techniques even though THz circuit components need to be developed and improved. The components include broadband power dividers, hybrids, tunable attenuators and phase shifters. Additionally, with nanometer MUT TLs, the interferometers are expected to be applicable for label-free investigations of nano-particles and single molecules. These issues, including further improvement of modeling accuracies, will need more work.
IV. Conclusion
The design and operation consideration of highly sensitive and tunable interferometers are presented in this work. Power-dividers and quadrature-hybrids are two of several possible approaches to implement the interferometers. Mathematical models for extracting quantitative MUT properties from scattering parameters are introduced for commonly used CPW, GCPW, and microstrip line sensing structures. Microfluidic channels are also included in the considerations. Results from modeling, simulation and measurement agree reasonably well. Furthermore, a QH-based interferometer is demonstrated to measure glucose solutions at a concentration level that is ten times lower than that in [45] by improving |S21|min for 15–20 dB compared with that in [29] and [30]. As a result, the Qeff magnitude is also improved from ~104 to ~105 while the sample volume is reduced to ~1 nL. Composition analysis of ternary mixtures is also demonstrated through high-sensitivity measurements with a power divider-based system. These results show that the proposed interferometers have wide application potentials in many scientific and technological areas even though more work is needed to address many unresolved issues.
Acknowledgments
This work was supported in part by the National Science Foundation ECCS under Grant 0925424 and the National Institutes of Health under Grant 1K25GM100480-01A1.
Biography

Yan Cui (S’14) received the B.S. degree from Changchun University of Science and Technology, Changchun, China, in 2007, and the M.S. degree from Southeast University, Nanjing, China, in 2010, respectively, both in electrical engineering. He is currently working toward the Ph.D. degree with a focus on high-frequency biological sensors at Clemson University, Clemson, SC, USA.
Footnotes
Pingshan Wang, photograph and biography not available at the time of publication.
Color versions of one or more of the figures in this paper are available online at http://ieeexplore.ieee.org.
References
- 1.Kremer F, Schoönhals A. Broadband Dielectric Spectroscopy. New York, NY, USA: Springer; 2003. pp. 35–37. [Google Scholar]
- 2.Klein RJ, Zhang S, Dou S, Jones BH, Colby RH, Runt J. Modeling electrode polarization in dielectric spectroscopy: Ion mobility and mobile ion concentration of single-ion polymer electrolytes. J Chem Phys. 2006 Apr;124(14):144903. doi: 10.1063/1.2186638. [DOI] [PubMed] [Google Scholar]
- 3.Wakai C, Oleinikova A, Ott M, Weingartner H. How polar are ionic liquids? Determination of the static dielectric constant of an imidazolium-based ionic liquid by microwave dielectric spectroscopy. J Phys Chem B. 2005 Aug;109(36):17028–17030. doi: 10.1021/jp053946+. [DOI] [PubMed] [Google Scholar]
- 4.Bordi F, Cametti C, Colby RH. Dielectric spectroscopy and conductivity of polyelectrolyte solutions. J Phys: Condens Matter. 2004 Nov;16(49):R1423–R1463. [Google Scholar]
- 5.Hayashi Y, Katsumoto Y, Omori S, Kishii N, Yasuda A. Liquid structure of the urea-water system studied by dielectric spectroscopy. J Phys Chem B. 2007 Jan;111(5):1076–1080. doi: 10.1021/jp065291y. [DOI] [PubMed] [Google Scholar]
- 6.Tomić S, Babić SD, Vuletić T, Krča S, Ivanković D, Griparić L, Podgornik R. Dielectric relaxation of DNA aqueous solutions. Phys Rev E. 2007 Feb;75(2):021905. doi: 10.1103/PhysRevE.75.021905. [DOI] [PubMed] [Google Scholar]
- 7.Markelz AG, Roitberg A, Heilweil EJ. Pulsed terahertz spectroscopy of DNA, bovine serum albumin and collagen between 0.1 and 2.0 THz. Chem Phys Lett. 2000 Mar;320(1):42–48. [Google Scholar]
- 8.Taylor KM, van der Weide DW. Ultra-sensitive detection of protein thermal unfolding and refolding using near-zone microwaves. IEEE Trans Microw Theory Techn. 2005 May;53(5):1576–1586. [Google Scholar]
- 9.Oleinikova A, Sasisanker P, Weingertner H. What can really be learned from dielectric spectroscopy of protein solutions? A case study of ribonuclease A. J Phys Chem B. 2004 May;108(24):8467–8474. [Google Scholar]
- 10.Merla C, Liberti M, Apollonio F, D’Inzeo G. Quantitative assessment of dielectric parameters for membrane lipid bi-layers from RF permittivity measurements. Bioelectromagnetics. 2009 May;30(4):286–298. doi: 10.1002/bem.20476. [DOI] [PubMed] [Google Scholar]
- 11.Popovic D, McCartney L, Beasley C, Lazebnik M, Okoniewski M, Hagness SC, Booske JH. Precision open-ended coaxial probes for in vivo and ex vivo dielectric spectroscopy of biological tissues at microwave frequencies. IEEE Trans Microw Theory Techn. 2005 May;53(5):1713–1722. [Google Scholar]
- 12.Gawad S, Schild L, Renaud P. Micromachined impedance spectroscopy flow cytometer for cell analysis and particle sizing. Lab Chip. 2001 Aug;1(1):76–82. doi: 10.1039/b103933b. [DOI] [PubMed] [Google Scholar]
- 13.Morgan H, Sun T, Holmes D, Gawad S, Green NG. Single cell dielectric spectroscopy. J Phys D: Appl Phys. 2007 Jan;40(1):61–70. [Google Scholar]
- 14.Vykoukal DM, Gascoyne PRC, Vykoukal J. Dielectric characterization of complete mononuclear and polymorphonuclear blood cell subpopulations for label-free discrimination. Integr Biol. 2009 Jun;1(7):477–484. doi: 10.1039/b906137a. [DOI] [PubMed] [Google Scholar]
- 15.Basey-Fisher TH, Hanham SM, Andresen H, Maier SA, Stevens MM, Alford NM, Klein N. Microwave Debye relaxation analysis of dissolved proteins: Towards free-solution biosensing. Appl Phys Lett. 2011 Dec;99(23):Art. ID 233703. [Google Scholar]
- 16.Chretiennot T, Dubuc D, Grenier K. A Microwave and microfluidic planar resonator for efficient and accurate complex permittivity characterization of aqueous solutions. IEEE Trans Microw Theory Techn. 2013 Feb;61(2):972–978. [Google Scholar]
- 17.Dalmay C, Cheray M, Pothier A, Lalloué F, Jauberteau MO, Blondy P. Ultra sensitive biosensor based on impedance spectroscopy at microwave frequencies for cell scale analysis. Sens Actuators A. 2010 Aug;162(2):189–197. [Google Scholar]
- 18.Costa F, Amabile C, Monorchio A, Prati E. Waveguide dielectric permittivity measurement technique based on resonant FSS filters. IEEE Microw Wireless Compon Lett. 2011 May;21(5):273–275. [Google Scholar]
- 19.Nagel M, Bolivar PH, Brucherseifer M, Kurz H, Bosserhoff A, Büttner R. Integrated planar terahertz resonators for femtomolar sensitivity label-free detection of DNA hybridization. Appl Opt. 2002 Apr;41(10):2074–2078. doi: 10.1364/ao.41.002074. [DOI] [PubMed] [Google Scholar]
- 20.Friedman B, Gaspar MA, Kalachikov S, Lee K, Levicky R, Shen G, Yoo H. Sensitive, label-free DNA diagnostics based on near-field microwave imaging. J Amer Chem Soc. 2005 Jun;127(27):9666–9667. doi: 10.1021/ja051760i. [DOI] [PubMed] [Google Scholar]
- 21.Shaforost EN, Klein N, Vitusevich SA, Barannik AA, Cherpak NT. High sensitivity microwave characterization of organic molecule solutions of nanoliter volume. Appl Phys Lett. 2009 Mar;94(11):Art. ID 112901. [Google Scholar]
- 22.Liu T-M, Chen H-P, Wang L-T, Wang J-R, Luo T-N, Chen Y-J, Liu S-I, Sun C-K. Microwave resonant absorption of viruses through dipolar coupling with confined acoustic vibrations. Appl Phys Lett. 2009 Jan;94(4):Art. ID 043902. [Google Scholar]
- 23.Adair RK. Vibrational resonances in biological systems at microwave frequencies. Biophy J. 2002 Mar;82(3):1147–1152. doi: 10.1016/S0006-3495(02)75473-8. [DOI] [PMC free article] [PubMed] [Google Scholar]
- 24.Merla C, Liberti M, Apollonio F, Nervi C, D’Inzeo G. A 3-D microdosimetric study on blood cells: A permittivity model of cell membrane and stochastic electromagnetic analysis. IEEE Trans Microw Theory Techn. 2010 Mar;58(3):691–698. [Google Scholar]
- 25.Booth JC, Orloff ND, Mateu J, Janezic M, Rinehart M, Beall JA. Quantitative permittivity measurements of nanoliter liquid volumes in microfluidic channels to 40 GHz. IEEE Trans Instrum Meas. 2010 Dec;59(12):3279–3288. [Google Scholar]
- 26.Findikoglu AT, Jia QX, Campbell IH, Wu XD, Reagor D, Mombourquette CB, McMurry D. Electrically tunable coplanar transmission line resonators using YBaCuO/SrTiO bilayers. Appl Phys Lett. 1995 Jun;66(26):3674–3676. [Google Scholar]
- 27.Liu X, Katehi LPB, Chappell WJ, Peroulis D. High-Q tunable microwave cavity resonators and filters using SOI-based RF MEMS tuners. J Microelectromech Syst. 2010 Aug;19(4):774–784. [Google Scholar]
- 28.Annino G, Bertolini D, Cassettari M, Fittipaldi M, Longo I, Martinelli M. Dielectric properties of materials using whispering gallery dielectric resonators: Experiments and perspectives of ultra-wideband characterization. J Chem Phys. 2000 Feb;112(5):2308–2314. [Google Scholar]
- 29.Cui Y, Sun J, He Y, Wang Z, Wang P. A simple, tunable and highly sensitive radio-frequency sensor. Appl Phys Lett. 2013 Aug;103(6):Art. ID 062906. doi: 10.1063/1.4818122. [DOI] [PMC free article] [PubMed] [Google Scholar]
- 30.Cui Y, He Y, Wang P. A quadrature-based tunable radio-frequency sensor for the detection and analysis of aqueous solutions. IEEE Microw Wireless Compon Lett. 2014 Jul;24(7):490–492. doi: 10.1109/LMWC.2014.2316235. [DOI] [PMC free article] [PubMed] [Google Scholar]
- 31.Cui Y, Li J, Cao W, Wang P. Highly sensitive RF detection and analysis of DNA solutions. IEEE MTT-S Int Microw Symp Dig. 2014:1–4. [Google Scholar]
- 32.Kaatze U. Complex permittivity of water as a function of frequency and temperature. J Chem Eng Data. 1989 Oct;34(4):371–374. [Google Scholar]
- 33.Weil JA, Bolton JR. Electron Paramagnetic Resonance: Elementary Theory and Practical Applications. Hoboken, NJ, USA: Wiley; 2007. p. 6. [Google Scholar]
- 34.Zhu J, Ozdemir SK, Xiao Y-F, Li L, He L, Chen D-R, Yang L. On-chip single nanoparticle detection and sizing by mode splitting in an ultrahigh-Q microresonator. Nat Photon. 2010 Jan;4:46–49. [Google Scholar]
- 35.Tinnefeld P. Single-molecule detection: Breaking the concentration barrier. Nat Nanotechnol. 2013 Jun;8:480–482. doi: 10.1038/nnano.2013.122. [DOI] [PubMed] [Google Scholar]
- 36.Gupta KC, Grag R, Chada R. Computer Aided Design of Microwave Circuits. Dedham, MA, USA: Artech House; 1981. pp. 25–43. [Google Scholar]
- 37.Chen E, Chou SY. Characteristics of coplanar transmission lines on multilayer substrates: Modeling and experiments. IEEE Trans Microw Theory Techn. 1997 Jun;45(6):939–945. [Google Scholar]
- 38.Kang B, Jeiwon C, Changyul C, Youngwoo K. Nondestructive measurement of complex permittivity and permeability using multilayered coplanar waveguide structures. IEEE Microw Wireless Compon Lett. 2005 May;15(5):381–383. [Google Scholar]
- 39.Ghione G, Naldi CU. Coplanar waveguides for MMIC applications: Effect of upper shielding, conductor backing, finite-extent ground planes, line-to-line coupling. IEEE Trans Microw Theory Techn. 1987 Mar;35(3):260–267. [Google Scholar]
- 40.Svacina J. Analysis of multilayer microstrip lines by a conformal mapping method. IEEE Trans Microw Theory Techn. 1992 Apr;40(4):769–772. [Google Scholar]
- 41.Svacina J. A simple quasi-static determination of basic parameters of multilayer microstrip and coplanar waveguide. IEEE Microw Guided Wave Lett. 1992 Oct;2(10):385–387. [Google Scholar]
- 42.Weingärtner H, Knocks A, Boresch S, Hochtl P, Steinhauser O. Dielectric spectroscopy in aqueous solutions of oligosaccharides: Experiment meets simulation. J Chem Phys. 2001 Jul;115(3):1463–1472. [Google Scholar]
- 43.Sato T, Chiba A, Nozaki R. Hydrophobic hydration and molecular association in methanol-water mixtures studied by microwave dielectric analysis. J Chem Phys. 2000 Feb;112(6):2924–2932. [Google Scholar]
- 44.Sato T, Buchner R. The cooperative dynamics of the H-bond system in 2-propanol/water mixtures: Steric hindrance effects of non-polar head group. J Chem Phys. 2003 Nov;119(20):10789–10800. [Google Scholar]
- 45.Hofmann M, Fischer G, Weigel R, Kissinger D. Microwave-based noninvasive concentration measurements for biomedical applications. IEEE Trans Microw Theory Techn. 2013 May;61(5):2195–2204. [Google Scholar]
- 46.Hobbie RK, Roth BJ. Intermediate Physics for Medicine and Biology. New York, NY, USA: Springer; 2007. p. 3. [Google Scholar]
- 47.Payne R, Theodorou IE. Dielectric properties and relaxation in ethylene carbonate and propylene carbonate. J Phys Chem. 1972 Sep;76(20):2892–2900. [Google Scholar]
- 48.Franchini GC, Marchetti A, Tagliazucchi M, Tassi L, Tosi G. Ethane-1, 2-diol-2-methoxyethanol solvent system. Dependence of the relative permittivity and refractive index on the temperature and composition of the binary mixture. J Chem Soc, Faraday Trans. 1991 Aug;87(16):2583–2588. [Google Scholar]
- 49.Piuzzi E, Merla C, Cannazza G, Zambotti A, Apollonio F, Cataldo A, D’Atanasio P, Benedetto ED, Liberti M. A comparative analysis between customized and commercial systems for complex permittivity measurements on liquid samples at microwave frequencies. IEEE Trans Instrum Meas. 2013 May;62(5):1034–1046. [Google Scholar]


