Abstract
Acute injury severity, altered joint kinematics, and joint incongruity are three important mechanical factors linked to post-traumatic osteoarthritis (PTOA). Finite element analysis (FEA) was previously used to assess the influence of increased contact stress due to joint incongruity on PTOA development. While promising agreement with PTOA development was seen, the inherent complexities of contact FEA limited the numbers of subjects that could be analyzed. Discrete element analysis (DEA) is a simplified methodology for contact stress computation, which idealizes contact surfaces as a bed of independent linear springs. In this study, DEA was explored as an expedited alternative to FEA contact stress exposure computation. DEA was compared to FEA using results from a previously completed validation study of two cadaveric human ankles, as well as a previous study of post-operative contact stress exposure in 11 patients with tibial plafond fracture. DEA-computed maximum contact stresses were within 19% of those experimentally measured, with 90% of the contact area having computed contact stress values within 1 MPa of those measured. In the 11 fractured ankles, maximum contact stress and contact area differences between DEA and FEA were 0.85±0.64 MPa and 22.5±11.5 mm2. As a predictive measure for PTOA development, both DEA and FEA had 100% concordance with presence of OA (KL grade ≥ 2) and >95% concordance with KL grade at 2 years. These results support DEA as a reasonable alternative to FEA for computing contact stress exposures following surgical reduction of a tibial plafond fracture.
Keywords: contact stress, posttraumatic osteoarthritis, ankle, finite element, discrete element
INTRODUCTION
Post-traumatic osteoarthritis (PTOA) is a common and all too predictable outcome of intra-articular fractures (McKinley et al., 2010). Despite decades of effort toward improving surgical procedures to precisely restore the fractured articular surface, debilitating PTOA remains a serious concern. Although the pathogenesis and etiology of PTOA is not fully understood, chronic elevated contact stress exposure due to residual articular surface incongruity has been implicated as an important mechanical factor. The ability to individually quantify contact stress, amongst other factors, is critical to understanding its influence on the development of PTOA (Buckwalter and Brown, 2004; Marsh et al., 2010).
In prior work, CT studies from a cohort of 11 patients with tibial plafond fractures were used to develop methods to quantify chronic pathological loading. Patient-specific finite element analysis (FEA) was used to quantify and compare contact stress-time exposures from fractured and intact contralateral ankles (Anderson et al., 2010). It was found that elevated contact stress-time exposure had a strong correlation with the development of radiographic PTOA two years post-operatively (Anderson et al., 2011). It remains unclear, however, whether poor articular reduction is inextricably linked with injury severity or if precise restoration of the articular surface can improve long-term patient outcomes. Understanding these relationships will require the analysis of a much larger number of subjects to provide the requisite statistical power.
Despite improvements that have been made in patient-specific FEA, the modeling of articular contact remains a challenge. This is especially true in the face of residual articular surface incongruity, where accurate mesh generation requires a substantial amount of time and effort. Contact FEA runs can take hours to complete, with the legitimate possibility of failure due to an inability to achieve numerical convergence. This presents a particular problem in the context of idiosyncratic surface incongruity. When FEA runs fail, the judicious adjustment of modeling parameters is required, and subsequent analysis runs do not guarantee success. In our experience, for some cases a FEA solution simply cannot be obtained. These inherent complexities of patient-specific FEA tend to lead to situations in which certain cases must be overly smoothed or excluded from analysis. Taken together, these challenges effectively render patient-specific FEA of large numbers of joints (on the order of hundreds) an intractable task. Simply put, an alternative computational stress analysis methodology is required for this application.
An interesting alternative to performing patient-specific modeling is the development of surrogate statistical models, in which only a subset of representative FEA models is computed and subsequent results are interpolated. Surrogate models, however, are reliant on a training dataset that thoroughly represents modes of variation within the subject cohort. In clinical fracture cases this method is likely unsuitable due to the highly idiosyncratic nature of fractures.
Chao and colleagues popularized discrete element analysis (DEA) in biomechanics as a framework for expedited modeling of articular contact (An et al., 1990; Blankevoort et al., 1991; Chao et al., 2010). DEA involves treating cartilage as an array of compressive-only springs that are distributed over an implicit rigid bony surface. Variations of the DEA methodology have been expanded to fully 3D subject- or patient-specific geometries and have been integrated into commercial multi-body dynamics software (Abraham et al., 2013; Elias et al., 2004; Fregly et al., 2003). Previous comparisons between the results of DEA and deformable contact FEA have been reported (Fregly et al., 2003; Halloran et al., 2005). However, these comparisons have generally involved artificial joints, usually metal on UHMWPE, with smooth and regular surfaces. To the best of our knowledge, DEA has not been compared to deformable contact FEA in cases with the irregular contact surfaces typical of a fractured, operatively repaired joint.
In this study, implementation of a DEA methodology for computation of contact stress in both intact and fractured human ankles is reported. The DEA-computed contact stresses were validated using data from a previously performed human cadaveric validation study. Next, FEA- and DEA-computed contact stress values were compared across 11 fractured ankles and their intact contralateral counterparts. Finally, the utility of DEA in place of FEA for computing PTOA risk resulting from residual incongruity was evaluated.
METHODS
Model Generation
A series of patients with tibial plafond fractures were obtained from a previous FEA study for analysis. Patient ages ranged from 20 to 57 years (mean±SD = 33.5±11.4 years) and axial helical CT scans of each patient’s intact and fractured ankles were obtained following surgical reduction (CT slice thickness 0.2–0.5mm and in-plane resolution 0.25–0.5mm) (Li et al., 2008).
The bony subchondral surfaces of the tibia and talus had been previously segmented from CT using iso-surfacing (OsiriX software, www.osirixviewer.com) and were repaired and smoothed within Geomagic Studio (Geomagic Studio; Geomagic, Research Triangle Park, NC) (Li et al., 2008). CT arthrographic contrast-enhanced imaging was unable to reliably provide cartilage visualization in these patients (Thomas et al., 2009), and the large volume of metal present in the injured limb precluded MRI of the ankles. This necessitated the assumption of a uniform 1.7-mm cartilage layer (El-Khoury et al., 2004), modeled by extrusion from the subchondral bone surfaces along surface normal directions. From this previous study, finite element meshes consisting of ~30,000 eight-noded linear hexahedral elements (where each cartilage layer was 4 elements thick) were obtained (Li et al., 2008).
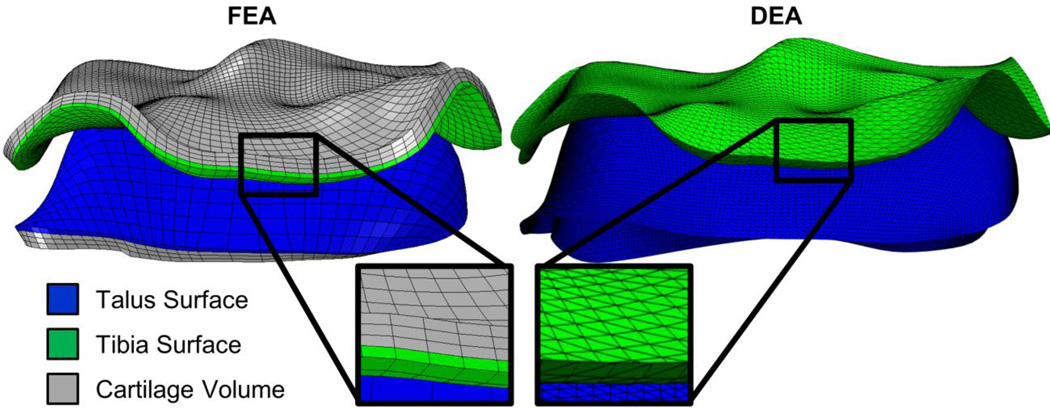
These finite element meshes were adapted for DEA to allow for direct point-to-point comparisons of the two analysis methodologies while maintaining identical surface morphology (Figure 1). The articular and subchondral surfaces were extracted from the FEA mesh and each element was bisected diagonally to form a shell of triangular elements, which served as geometric input for the DEA model.
Figure 1.
FEA (left) and DEA (right) models are shown side-by-side. The articular cartilage surfaces from the tibia (green) and talus (blue) are extracted from the FEA mesh and bisected to form triangular shell elements. This allows direct spatial comparison between DEA and FEA results
Discrete Element Analysis
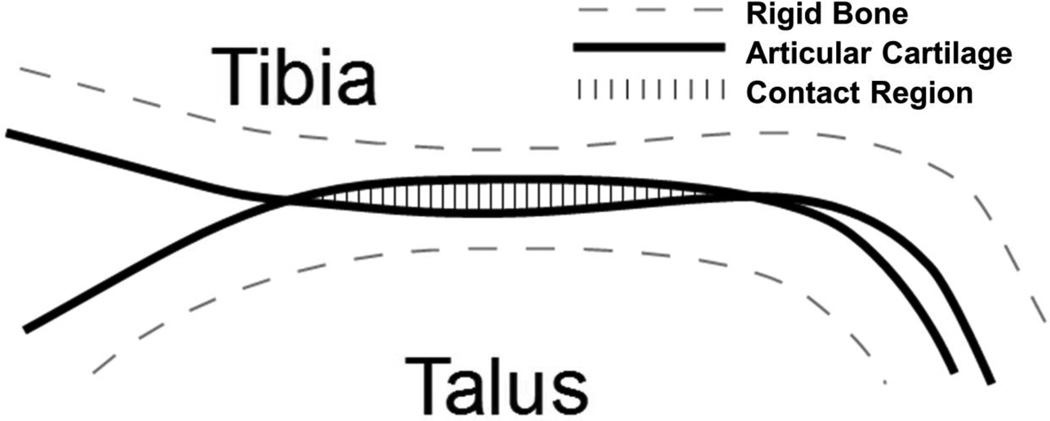
In the DEA algorithm a compressive-only spring was associated with each triangular shell element over the contact surface oriented along its surface normal, with an un-deformed length equal to the associated cartilage thickness. The cartilage surface was treated as a bed of compressive springs, spanning from the articular surface to an implicit underlying rigid subchondral bone surface. Contact was defined where the two apposed cartilage surfaces intersect (Figure 2). Within these regions of intersection, compound springs were created from apposing cartilage surfaces and span the total cartilage thickness of the joint. Each spring had an un-deformed length, l, which is the sum of the two cartilage thicknesses and a deformation, d, the local depth of penetration between the surfaces. Each spring was compressible-only and responds in a linear-elastic manner according to Hooke’s law. (Abraham et al., 2013; Bei and Fregly, 2004)
where f is the force exerted by the spring along its direction, d is the deformation of the spring, and k is the spring constant, which is a function of the cartilage Young’s Modulus, E, Poisson’s ratio, v, and the area of the spring’s associated surface polygon, a (Abraham et al., 2013; An et al., 1990; Blankevoort et al., 1991).
Values for the Young’s Modulus and Poisson’s ratio of cartilage were selected as 12 MPa and 0.42, respectively, to replicate the previously performed FEA study (Li et al., 2008). Finally, the force in each spring was converted to a contact stress value by dividing the force by the area over which it effectively acts. The sum of these spring forces was balanced using Newton’s method, where the position of each contact surface was varied such as to minimize the residual difference between applied forces and the resultant spring forces (Abraham et al., 2013).
Figure 2.
Illustration of DEA implementation. Subchondral bone is treated as rigid and articular cartilage is treated as isotropic – linear elastic and frictionless. Springs representing the cartilage are generated from the apparent penetration of the two articular cartilage surfaces.
Boundary conditions for the DEA model replicated those used in the original FEA study (Li et al., 2008). In summary, the stance phase of gait was simulated using 13 quasi-static steps in which the ankle undergoes a flexion-extension arc ranging from 5° of plantar-flexion to 9° of dorsiflexion. The tibia, loaded axially according to the step in the gait cycle and proportional to subject bodyweight, was constrained in all directions except for translation along its long axis. Talus rotations were free except for flexion-extension, which was constrained to maintain appropriate position for that stage in the gait cycle. Talus translations were allowed in all directions except superior-inferior, to resist the force applied to the tibia. In each step of the simulation the prescribed flexion-extension of the talus beneath the tibia was dictated by its current pose in gait. To emulate the ankle mortise, fibular restraint was modeled as a linear spring acting laterally on the talus, resisting medial-lateral translation from the initial position of the talus (spring constant = 100N/mm) (Li et al., 2008).
The DEA modeling approach was implemented within a custom MATLAB 2012a (Mathworks, Natick, MA) routine. Contact stress was computed on eleven fractured and eleven intact limbs using the same model geometries and starting poses as in the previous FEA study, to allow a direct comparison between the FEA and DEA results.
Physical Validation
Data available from a previous cadaveric study included contact stress distributions measured (using Tekscan pressure sensors) in two loaded human cadaveric ankles (Anderson et al., 2007). These data were used to validate the DEA ankle model by comparing computed contact stress distributions with those measured in the laboratory. As in the previous section, the FEA models previously used for validation were adapted for DEA. The boundary conditions of the physical experiment were replicated with a 600 N inferiorly-directed load placed on the tibia, and the tibia and talus constrained against translations/rotations.
Data Analysis
Differences in the contact stress distributions for equivalent FEA and DEA models were examined by both global average and on a point-by-point basis. Discrepancies between FEA and DEA were also examined with respect to their position in the contact patch. The periphery of contact was defined as any node with non-zero contact stress adjacent to a node with zero contact stress. From this the percentage of contact area where FEA and DEA differed >1MPa was quantified in terms of distance from the periphery.
In addition to establishing the correspondence between FEA- and DEA-computed contact stress results, it was also important to establish agreement of DEA-computed contact stress with radiographically assessed PTOA development. The radiographic assessments were based on the Kellgren and Lawrence (KL) grading scale (Kellgren and Lawrence, 1957). The KL grade is an ordinal scale ranging from 0 to 4 where 0 represents no visible signs of OA and 4 represents severe end-stage OA signified by presence of osteophytes, joint-space narrowing, bony deformity and sclerotic regions. A joint with a KL-grade ≥ 2 was considered to have OA. As no KL-grade readings were available for models of intact contralateral limbs and the prevalence of primary OA in the ankle is extremely low (Valderrabano et al., 2009), it was assumed that the KL grade was zero for all intact models. KL-grades were available for 10 of the patients evaluated with FEA (1 patient was lost to follow-up).
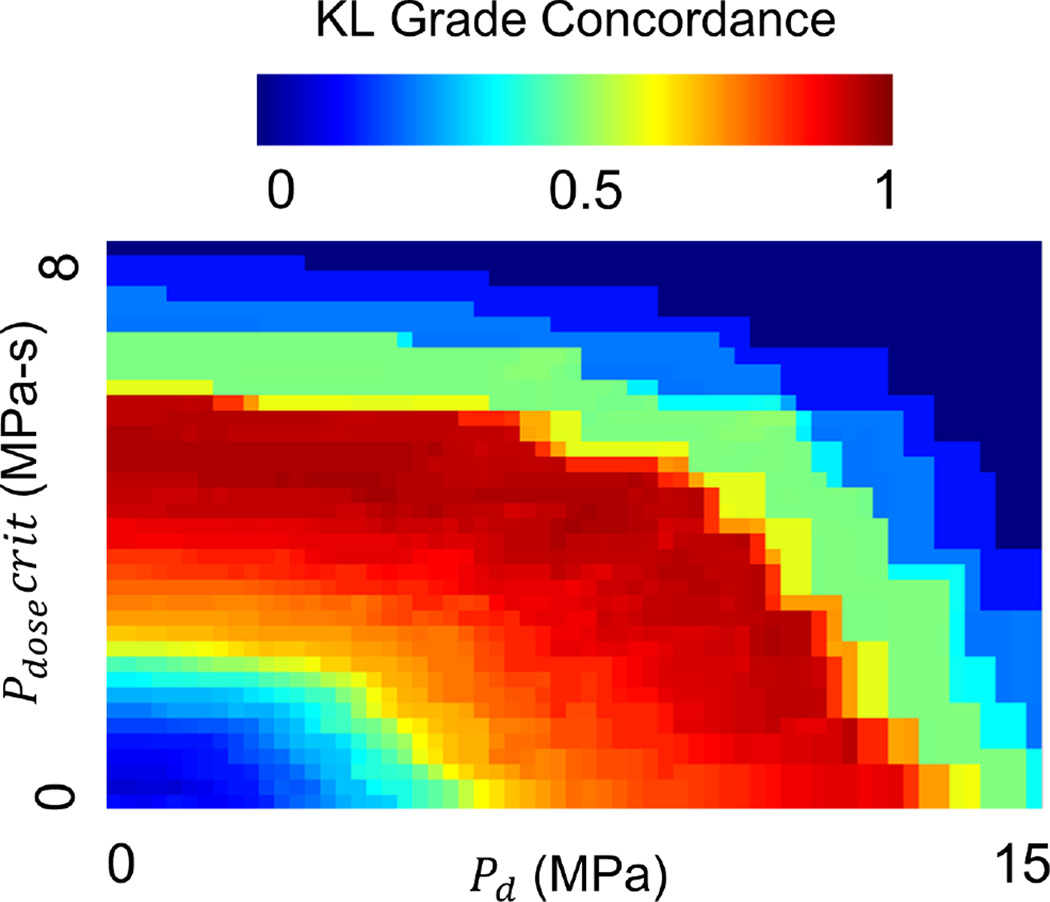
The spatial distributions of computed contact stress were processed into a final contact stress exposure metric for each model. Contact stress exposure was computed using the metric introduced by Anderson et al. 2010, which quantifies the percentage of contact area above a contact stress damage threshold (Pd, MPa) that also exceeds a critical contact stress-time dose (Pdosecrit, MPa-s). Two sets of values for Pd and Pdosecrit were used, with the first set (Pd = 4.5MPa and Pdosecrit = 3MPa-s) arising from the prior FEA results for the same cohort of subjects (Anderson et al., 2010). A second set of values was computed ad hoc, from the DEA contact stress results by sampling the entire space of values (Pd: 0–15 MPa, Pdosecrit: 0–10 MPa-s) and selecting the pair which maximized agreement with KL grade and OA status.
Concordance was chosen to assess statistical agreement between contact stress exposure and KL grade/OA as both were treated as ranking scales for the severity and prevalence of OA (Harrell, 2001). This is an estimate of the probability that if two ankles differed on their KL grade, then their contact stress exposure metrics would differ in the same direction (concordance values range from 0 – 1 with 0.5 being random chance and 1 being perfect positive agreement) (Anderson et al., 2010). Concordance was calculated using pairings of ankles which were not necessarily from the same subject.
RESULTS
Physical Validation
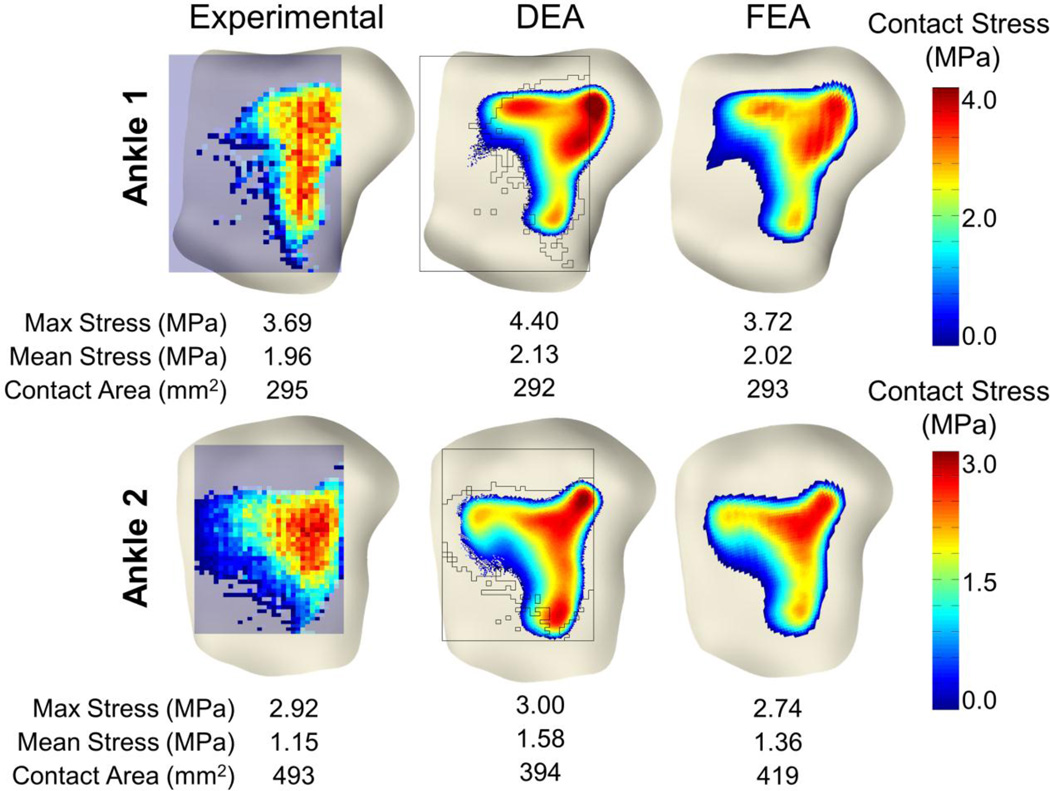
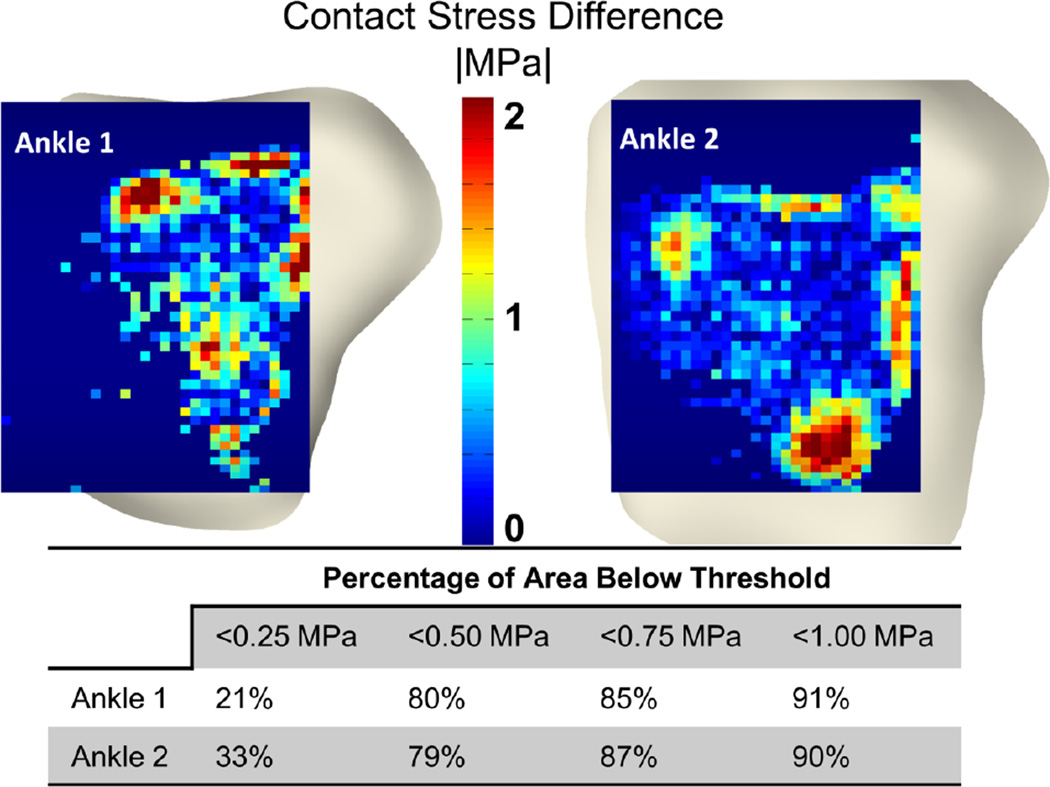
The DEA model replicated the validation experimental results to within 19% percent of the maximum contact stress and 20% of the contact area on each of the two validation ankles. Qualitatively, DEA-computed contact stresses interpolated onto experimental contact stress distributions showed high agreement centrally, but larger discrepancies were observed near the periphery of contact (Figures 3 and 4). Fully 85% of the total contact area with >1MPa discrepancy between Tekscan and DEA was within 5mm of the periphery of contact. Globally, the difference between maximum contact stress was 0.71 and 0.08 MPa for ankles one and two, respectively. Mean contact stress differences were 0.17 and 0.43 MPa. Contact area difference between DEA and the validation was 3 and 99 mm2 for ankles 1 and 2. Local discrepancies between Tekscan and DEA showed that 90% of the common contact area exhibited a difference of < 1 MPa, and 79% had a difference of less than 0.5 MPa (Figure 4).
Figure 3.
Comparison of physical Tekscan (left) (Anderson et al., 2007) with DEA (center) and FEA (right) contact stress results. Contact stress distributions and magnitudes compared well with both the FEA and physical testing results. The black silhouette overlaid on the DEA results represents the Tekscan sensor and the boundary of the measured contact region.
Figure 4.
Spatial comparison between DEA and physical Tekscan measurements (top). Contact stress between the Tekscan and the DEA were similar with 90% of the contact area having < 1 MPa difference.
FEA-to-DEA Comparison
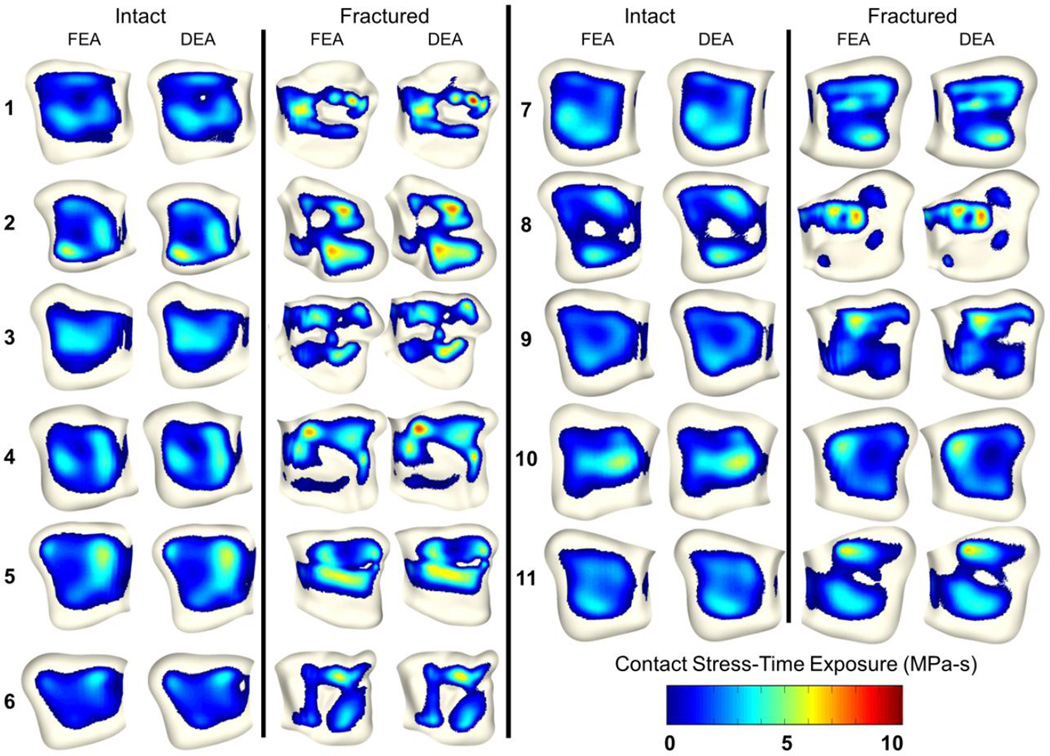
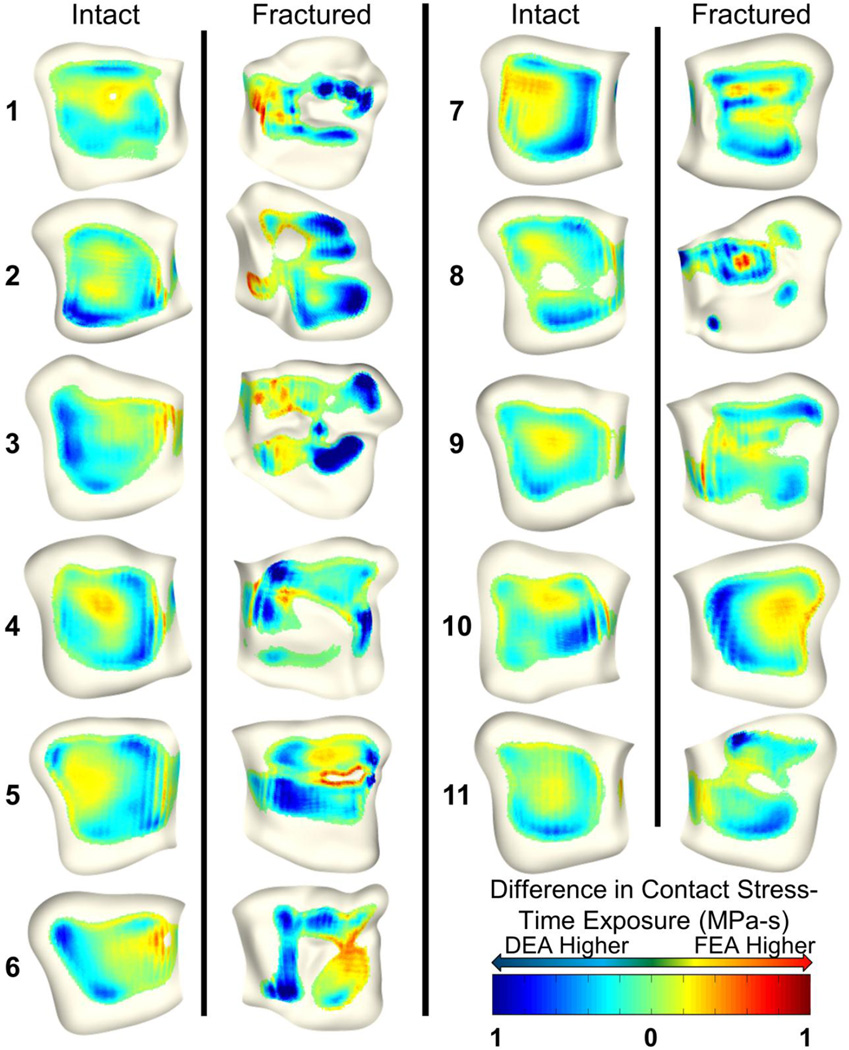
Visual comparison between FEA- and DEA-computed contact stresses in the cohort of 11 patients showed that they agreed well (Figure 5). During the peak loading step maximum contact stress values differed by 0.85±0.64 MPa and 0.32±0.21 MPa of the corresponding FEA models for fractured and intact cases, respectively. Case-by-case the maximum difference between maximum contact and mean contact stress was 17% and 12%, respectively. On a point-to-point basis, contact stress differed by 0.66±0.57 MPa and 0.44±0.38 MPa in fractured and intact cases. Fully, 90% (for intact) and 78% (for fractured) of the contact areas had DEA contact stress values that were within ±1 MPa of the FEA results (Figure 6). Total contact area difference between FEA and DEA was 22.5±11.5 mm2 and 22.9±13.8 mm2 for fractured and intact cases. Over 84% of the >1MPa discrepancy between FEA and DEA occurred within 5 mm of the contact periphery. Nine additional cases (3 fractured, 6 intact) which were unable to be solved using FEA were run successfully using DEA. Run time for the DEA cases were approximately 3 minutes per case for a full gait cycle simulation, which represents a 99% decrease in job execution time compared to prior (successful) FEA runs.
Figure 5.
Comparison of FEA (Li et al., 2008) and DEA contact stress-time exposure (MPa-s), computed over a normative 13-step gait cycle. Contact stress distributions and magnitudes compare well with FEA.
Figure 6.
Spatial distributions of contact stress-time exposure (MPa-s) differences between FEA and DEA. Blue colors indicate higher DEA contact stress and red colors indicate higher FEA contact stress. While overall discrepancies appear low, FEA tends to compute higher contact stress around the borders of contact and DEA to compute higher stress around focal stress concentrations.
PTOA Prediction
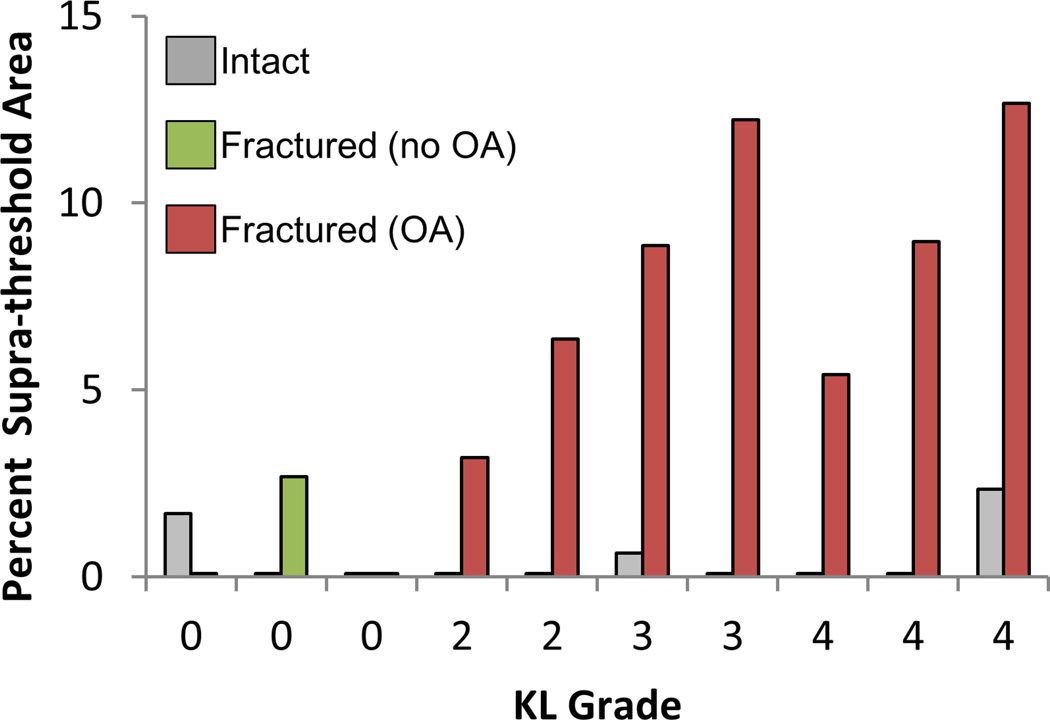
DEA contact stress overexposure had a 93% concordance with KL grade and a 96% concordance with OA status (KL<2 vs. KL ≥ 2) using parameters that had previously been optimized for FEA (4.5 MPa, 3.0 MPa-s). The contact stress damage threshold and critical contact stress-time exposure values for DEA found to be most predictive of PTOA outcome were 4.0 MPa and 5.5 MPa-s, respectively. These thresholds provided a 96% concordance with KL grade and a 100% concordance with OA status, showing a marked difference between cases with OA and without OA (Figure 7).
Figure 7.
Contact stress overexposure (% of total contact area exceeding Pd, 4.0 MPa also exceeding Pdosecrit, 5.5 MPa-s) computed on DEA contact stress values. The particular values for these parameters were selected to maximize the gap between intact cases (grey), fractured cases with no radiographic OA (green) and fractured cases with OA (red). This represents a one set of a variety of different parameters that may by viable for comparing contact stress overexposure to OA.
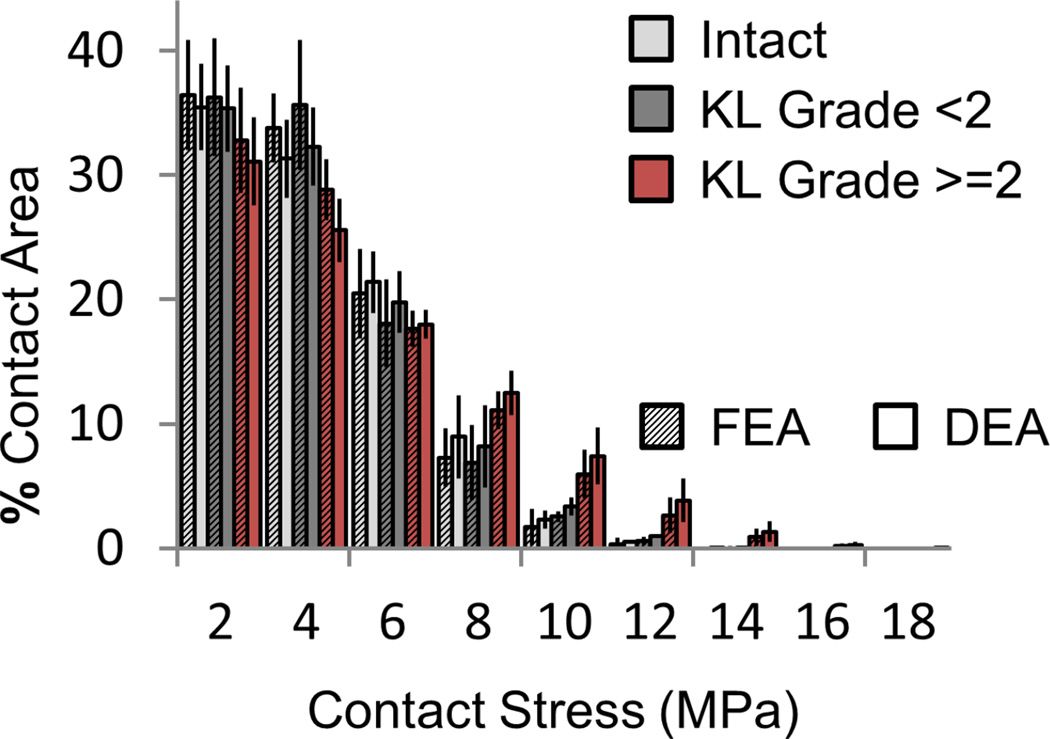
Both DEA and FEA exhibited similar trends in contact-stress engagement across patients subdivided by intact vs fractured and OA vs no-OA status (Figure 8). Cases with OA had larger percentages of their contact area engaged at higher contact stress. DEA exaggerated this effect compared to FEA. FEA- and DEA-derived measures were nearly indistinguishable in their capacity to predict PTOA development. Although only two sets of contact stress over-exposure parameters were analyzed, a wide array of potentially viable Pd and Pdosecrit thresholds exist (Figure 9).
Figure 8.
Contact stress (MPa) area engagement histogram for FEA (textured) and DEA (solid). Both intact (light gray) and fractured (dark gray) cases that did not show radiographic OA (KL score < 2 at two year follow-up) have lower areas of engagement at high contact stress levels than fractured cases that did develop radiographic OA (red).
Figure 9.
Ad-hoc computation of Pd and Pdosecrit obtained by sampling the entire feasible space of parameters. Parameters are shown vs. KL grade concordance to demonstrate that there are a number of possible exposure metrics. Further experimentation with additional cases is required to find which parameters are most predictive.
DISCUSSION
Physical Validation
Agreement between DEA and Tekscan results overall were promising. Visual and numerical comparisons of both FEA and DEA with physical validation suggest that both of these methods are capable of producing a reasonably accurate representation of contact stress in the human ankle. DEA-computed contact stress biases towards higher magnitudes than either FEA or Tekscan, with up to 19% higher maximum contact stress and 20% lower contact area. Rigid geometries in DEA negate the expansion of contact area with loading compared to deformable FEA and physical experimentation, which may explain the discrepancy between DEA and experimental findings.
Physical limitations of the Tekscan sensor may contribute to the observed discrepancies. While the sensor is not explicitly modeled within the FEA or DEA, it has a finite thickness (0.08mm) that may affect the contact interface, possibly increasing contact area. In addition, the individual Tekscan sensing elements are larger than the characteristic DEA model element size. This could easily increase the reported contact area on the Tekscan sensor along the periphery of contact, where only a fraction of a sensel is contacted. The high proportion of contact stress discrepancy along the periphery of contact could also be explained by this effect.
FEA-to-DEA Comparison
Strong overall agreement was seen between FEA- and DEA-computed contact stresses for the cohort of eleven tibial plafond fracture patients. The DEA models predicted higher peak contact stresses with lower contact areas than did equivalent FEA models. While this bias was consistent, it was relatively small in the majority of cases; maximum contact stress was increased 6.4±5.1% and contact area reduced 3.2±1.9%, compared to FEA at maximum loading. Using a DEA formulation in a subject-specific native hip model, Abraham et al. (2013) found a similar contact distribution to FEA, but DEA under-estimated contact area by up to 9.7% and over-estimated contact stress by up to 43% when compared to FEA. The cause of the higher discrepancy in maximum contact stress that they reported, relative to the discrepancies that we observed, is unclear.
In general, discrepancies in DEA- and FEA-computed contact stress likely reflect the fact that each spring within DEA acts independently of its neighboring springs, precluding modeling lateral deformation within the cartilage. This fundamental difference between FEA and DEA likely moderates contact stress seen in the FEA, by allowing Poisson’s effect and shearing to be modeled within the cartilage volume (Abraham et al., 2013).
Areas of larger (> 1 MPa) discrepancy were seen primarily at the periphery of contact and at fracture discontinuities. Much of this discrepancy is attributable to slight mismatches in the actual edge of contact on the mating surfaces, causing areas of high contact stress to be slightly translated across the surface.
PTOA Prediction
DEA’s utility as a predictive tool for PTOA development was established using a previously developed cumulative contact stress-time exposure metric. There were minor differences between the most discriminative contact stress exposure thresholds derived from FEA and DEA. Likely, DEA’s bias towards higher contact stress, especially in regions of high incongruity, results in a greater disparity between severely fractured models and models that are of intact or lower severity fractured joints. Conclusive selection of these parameters relies upon further study with additional subjects.
While FEA offers a more technically rigorous contact stress modeling capability, its increased complexity may not be required to differentiate between two populations in a larger-scale setting. In fact, the pursuit of more complex modeling techniques may be counter-productive in the context of large cohorts, limiting the numbers of subjects for which analysis may be completed. This is evidenced by the lack of larger scale (i.e., hundreds of subjects) subject-specific FEA modeling studies, where the burdens of mesh construction and validation present substantial barriers to their execution. While FEA mesh creation and contact definition capabilities have improved greatly in recent years, large scale studies are still not feasible using subject-specific FEA models.
Limitations
There are several limitations to this work that warrant further discussion. First is the treatment of cartilage with a linear elastic material model in both the FEA and DEA. While the mechanical behavior of cartilage is non-linear and bi-phasic, these effects were deemed negligible for the loadings and time-scales considered (Ateshian et al., 2007).
The use of KL grade to assess PTOA could be a substantial limitation in evaluating the efficacy of contact stress over-exposure as a predictor of PTOA. It is however a commonly used scale that is familiar to clinicians and radiologists, allowing for comparison between studies and relatively easy access to qualified raters.
Another limitation of this work was the assumption of uniform thickness cartilage. While undesirable, it was deemed necessary due to the presence of metallic fixation hardware precluding reliable MRI assessments near the articular surface. CT arthrographic assessments were also inconsistently successful in a similar cohort of subjects (Thomas et al., 2009). A more faithful representation of the patient-specific variations in cartilage thickness for clinical fracture patients is unlikely to be achieved in the short term for these reasons. Future work could utilize atlas-based normative cartilage thickness distributions projected onto the fracture fragments or improved MRI metal artifact reduction algorithms to overcome some of these limitations.
DEA computations only provide contact stress predictions, while FEA is capable of computing stress fields throughout the cartilage/bone volume. However, in addition to having been shown to be a very useful metric in its own right (Hadley et al. 1990; Maxian et al. 1995), contact stress also closely correlates with shear stress at the osteochondral junction and with other important stress measures under functional loading (Li et al. 2008).
CONCLUSION
Although DEA is a fundamentally simplified methodology, it is a reasonable alternative when applied judiciously in cases where FEA: (1) is too labor-intensive owing to the number of subjects to be studied, (2) takes too long to be used clinically in pre-operative planning, and/or (3) presents too great of a challenge in terms of meshing constraints. Relative to both physical measurements and FEA, DEA yielded contact stress values that were greater in areas of higher spatial discontinuity and overall lower contact areas. When utilized as a predictive measure for PTOA risk attributable to chronic contact stress exposure, DEA was shown to be equally effective as FEA.
ACKNOWLEDGMENTS
Research reported in this paper was supported by the National Institute of Arthritis and Musculoskeletal and Skin Diseases of the National Institutes of Health under award numbers R01AR46601, P50AR48939, and P50AR055533. The content is solely the responsibility of the authors and does not necessarily represent the official views of the National Institutes of Health. Additional funding was provided by the Orthopaedic Research and Education Foundation and the Arthritis Foundation.
Footnotes
Publisher's Disclaimer: This is a PDF file of an unedited manuscript that has been accepted for publication. As a service to our customers we are providing this early version of the manuscript. The manuscript will undergo copyediting, typesetting, and review of the resulting proof before it is published in its final citable form. Please note that during the production process errors may be discovered which could affect the content, and all legal disclaimers that apply to the journal pertain.
Conflict of Interest Statement: None
REFERENCES
- Abraham CL, Maas SA, Weiss JA, Ellis BJ, Peters CL, Anderson AE. A new discrete element analysis method for predicting hip joint contact stresses. J Biomech. 2013;46:1121–1127. doi: 10.1016/j.jbiomech.2013.01.012. [DOI] [PMC free article] [PubMed] [Google Scholar]
- An KN, Himeno S, Tsumura H, Kawai T, Chao EY. Pressure distribution on articular surfaces: application to joint stability evaluation. J Biomech. 1990;23:1013–1020. doi: 10.1016/0021-9290(90)90316-u. [DOI] [PubMed] [Google Scholar]
- Anderson DD, Chubinskaya S, Guilak F, Martin JA, Oegema TR, Olson SA, Buckwalter JA. Post-traumatic osteoarthritis: improved understanding and opportunities for early intervention. J Orthop Res. 2011;29:802–809. doi: 10.1002/jor.21359. [DOI] [PMC free article] [PubMed] [Google Scholar]
- Anderson DD, Goldsworthy JK, Li W, Rudert MJ, Tochigi Y, Brown TD. Physical validation of a patient-specific contact finite element model of the ankle. J Biomech. 2007;40:1662–1669. doi: 10.1016/j.jbiomech.2007.01.024. [DOI] [PMC free article] [PubMed] [Google Scholar]
- Anderson DD, Van Hofwegen C, Marsh JL, Brown TD. Is elevated contact stress predictive of post-traumatic osteoarthritis for imprecisely reduced tibial plafond fractures? J Orthop Res. 2010;29:33–39. doi: 10.1002/jor.21202. [DOI] [PMC free article] [PubMed] [Google Scholar]
- Ateshian GA, Ellis BJ, Weiss JA. Equivalence between short-time biphasic and incompressible elastic material responses. J Biomech Eng. 2007;129(3):405–412. doi: 10.1115/1.2720918. [DOI] [PMC free article] [PubMed] [Google Scholar]
- Bei Y, Fregly BJ. Multibody dynamic simulation of knee contact mechanics. Med Eng Phys. 2004;26:777–789. doi: 10.1016/j.medengphy.2004.07.004. [DOI] [PMC free article] [PubMed] [Google Scholar]
- Blankevoort L, Kuiper JH, Huiskes R, Grootenboer HJ. Articular contact in a three-dimensional model of the knee. J Biomech. 1991;24:1019–1031. doi: 10.1016/0021-9290(91)90019-j. [DOI] [PubMed] [Google Scholar]
- Buckwalter JA, Brown TD. Joint injury, repair, and remodeling: roles in post-traumatic osteoarthritis. Clin Orthop Relat Res. 2004;423:7–16. [PubMed] [Google Scholar]
- Chao EY, Volokh KY, Yoshida H, Shiba N, Ide T. Discrete element analysis in musculoskeletal biomechanics. Mol Cell Biomech. 2010;7:175–192. [PubMed] [Google Scholar]
- El-Khoury GY, Alliman KJ, Lundberg HJ, Rudert MJ, Brown TD, Saltzman CL. Cartilage thickness in cadaveric ankles: measurement with double-contrast multi-detector row CT arthrography versus MR imaging. Radiology. 2004;233:768–773. doi: 10.1148/radiol.2333031921. [DOI] [PubMed] [Google Scholar]
- Elias JJ, Wilson DR, Adamson R, Cosgarea AJ. Evaluation of a computational model used to predict the patellofemoral contact pressure distribution. J Biomech. 2004;37:295–302. doi: 10.1016/s0021-9290(03)00306-3. [DOI] [PubMed] [Google Scholar]
- Fregly BJ, Bei Y, Sylvester ME. Experimental evaluation of an elastic foundation model to predict contact pressures in knee replacements. J Biomech. 2003;36:1659–1668. doi: 10.1016/s0021-9290(03)00176-3. [DOI] [PubMed] [Google Scholar]
- Hadley NA, Brown TD, Weinstein SL. The effects of contact pressure elevations and aseptic necrosis on the long-term outcome of congenital hip dislocation. J Orthop Res. 1990;8(4):504–513. doi: 10.1002/jor.1100080406. [DOI] [PubMed] [Google Scholar]
- Halloran JP, Easley SK, Petrella AJ, Rullkoetter PJ. Comparison of deformable and elastic foundation finite element simulations for predicting knee replacement mechanics. J Biomech Eng. 2005;127:813–818. doi: 10.1115/1.1992522. [DOI] [PubMed] [Google Scholar]
- Harrell FE. Regression modeling strategies: with applications to linear models, logistic regression, and survival analysis. New York: Springer; 2001. [Google Scholar]
- Kellgren JH, Lawrence JS. Radiological assessment of osteo-arthrosis. Ann Rheum Dis. 1957;16:494–502. doi: 10.1136/ard.16.4.494. [DOI] [PMC free article] [PubMed] [Google Scholar]
- Li W, Anderson DD, Goldsworthy JK, Marsh JL, Brown TD. Patient-specific finite element analysis of chronic contact stress exposure after intraarticular fracture of the tibial plafond. J Orthop Res. 2008;26:1039–1045. doi: 10.1002/jor.20642. [DOI] [PMC free article] [PubMed] [Google Scholar]
- Marsh JL, McKinley T, Dirschl D, Pick A, Haft G, Anderson DD, Brown TD. The sequential recovery of health status after tibial plafond fractures. J Orthop Trauma. 2010;24:499–504. doi: 10.1097/BOT.0b013e3181c8ad52. [DOI] [PMC free article] [PubMed] [Google Scholar]
- Maxian TA, Brown TD, Weinstein SL. Chronic stress tolerance levels for human articular cartilage: two nonuniform contact models applied to long-term follow-up of CDH. J Biomech. 1995;28(2):159–166. doi: 10.1016/0021-9290(94)00054-8. [DOI] [PubMed] [Google Scholar]
- McKinley TO, Borrelli J, Jr, D'Lima DD, Furman BD, Giannoudis PV. Basic science of intra-articular fractures and posttraumatic osteoarthritis. J Orthop Trauma. 2010;24(9):567–570. doi: 10.1097/BOT.0b013e3181ed298d. [DOI] [PMC free article] [PubMed] [Google Scholar]
- Thomas TP, Anderson DD, Mosqueda TV, Van Hofwegen CJ, Hillis SL, Marsh JL, Brown TD. Objective CT-based metrics of articular fracture severity to assess risk for posttraumatic osteoarthritis. J Orthop Trauma. 2010;24:764–769. doi: 10.1097/BOT.0b013e3181d7a0aa. [DOI] [PMC free article] [PubMed] [Google Scholar]
- Thomas TP, Van Hofwegen CJ, Anderson DD, Brown TD, Marsh JL. Utility of double-contrast multi-detector CT scans to assess cartilage thickness after tibial plafond fracture. Orthop Res Rev. 2009;2009:23–29. doi: 10.2147/orr.s7387. [DOI] [PMC free article] [PubMed] [Google Scholar]
- Valderrabano V, Horisberger M, Russell I, Dougall H, Hintermann B. Etiology of Ankle Osteoarthritis. Clin Orthop Relat Res. 2009;467(7):1800–1806. doi: 10.1007/s11999-008-0543-6. [DOI] [PMC free article] [PubMed] [Google Scholar]


