Abstract
Purpose
MRS of hyperpolarized [2-13C]pyruvate can be used to assess multiple metabolic pathways within mitochondria as the 13C label is not lost with the conversion of pyruvate to acetyl-CoA. This study presents the first MR spectroscopic imaging of hyperpolarized [2-13C]pyruvate in glioma-bearing brain.
Methods
Spiral chemical shift imaging with spectrally under-sampling scheme (1,042 Hz) and a hard-pulse excitation was exploited to simultaneously image [2-13C]pyruvate, [2-13C]lactate, and [5-13C]glutamate, the metabolites known to be produced in brain after an injection of hyperpolarized [2-13C]pyruvate, without chemical shift displacement artifacts. A separate under-sampling scheme (890 Hz) was also used to image [1-13C]acetyl-carnitine. Healthy and C6 glioma-implanted rat brains were imaged at baseline and after dichloroacetate administration, a drug that modulates pyruvate dehydrogenase kinase activity.
Results
The baseline metabolite maps showed higher lactate and lower glutamate in tumor as compared to normal-appearing brain. Dichloroacetate led to an increase in glutamate in both tumor and normal-appearing brain. Dichloroacetate-induced %-decrease of lactate/glutamate was comparable to the lactate/bicarbonate decrease from hyperpolarized [1-13C]pyruvate studies. Acetyl-carnitine was observed in the muscle/fat tissue surrounding the brain.
Conclusion
Robust volumetric imaging with hyperpolarized [2-13C]pyruvate and downstream products was performed in glioma-bearing rat brains, demonstrating changes in mitochondrial metabolism with dichloroacetate.
Keywords: hyperpolarized 13C, [2-13C]pyruvate, mitochondrial metabolism, brain, glioma, cancer
Introduction
Altered brain energy utilization is an important phenotype for diagnosis and therapeutic targeting in multiple pathologies including tumor and neurodegenerative diseases. Hyperpolarized 13C magnetic resonance spectroscopy (MRS) using dynamic nuclear polarization (DNP) is an emerging technique to non-invasively investigate energy metabolism of intact organisms in real-time by amplifying MR signal intensity of targeted 13C-labeled substrates1.
[1-13C]pyruvate has been one of the most successful substrates for hyperpolarized 13C MRS due to its important role in cellular energy metabolism, positioned at a key nodal point connecting glycolysis and multiple metabolic pathways1,2. [1-13C]lactate, a metabolic product of [1-13C]pyruvate, has been a useful biomarker to characterize altered metabolism of various metabolic diseases3-6. In particular, hyperpolarized MRS using [1-13C]pyruvate detects up-regulated lactic acid production in cancer, known as Warburg effect7,8, leading to the first clinical trial of this technology for assessing prostate cancer patients9. Another important metabolic product of [1-13C]pyruvate is bicarbonate (HCO3-), which is in equilibrium with CO2, the 13C-labeled byproduct generated when pyruvate is converted to acetyl coenzyme A (CoA) within mitochondria. Bicarbonate is a promising biomarker for measuring pyruvate dehydrogenase (PDH) activity10-12. Several metabolic diseases including cancer show reduced bicarbonate labeling as compared to normal, indicating suppressed mitochondrial metabolism and possibly low oxidative phosphorylation11,12. The lactate-to-bicarbonate ratio has been also proposed as a surrogate biomarker for the imbalance of aerobic glycolysis and oxidative phosphorylation in brain tumor11, but it has a potential problem of over-estimating oxidative phosphorylation since the acetyl CoA can follow alternative downstream metabolic pathways other than into the tricarboxylic acid (TCA) cycle. Moreover, many cancers, including glioma, are known to have upregulated levels of fatty-acid synthase and significant endogenous fatty-acid synthesis for tumorigenesis13-15.
[2-13C]pyruvate, as a hyperpolarized substrate, extends the traceable metabolic pathways deeper into mitochondrial function such as fatty-acid metabolism and ketogenesis as well as the TCA cycle, while retaining the ability to measure the conversion of pyruvate to lactate and alanine16. To date, hyperpolarized [2-13C]pyruvate has been primarily investigated in cardiac applications16-18. A recent study observed [5-13C]glutamate in healthy rat brain following the bolus injection of hyperpolarized [2-13C]pyruvate, potentially serving as a metric for the brain TCA cycle activity19. Moreover, [1-13C]acetyl-carnitine production can serve as a biomarker for fatty-acid metabolism although its dominant source was from tissue outside of the brain19. However, imaging [2-13C]pyruvate is technically challenging due to the widely dispersed chemical shifts of the [2-13C]pyruvate products18,19 and severe chemical shift displacement artifacts (CSDAs) have been reported using conventional slice-selective imaging methods19.
In this study, we acquired volumetric in vivo images of [2-13C]pyruvate, [2-13C]lactate, and [5-13C]glutamate in a single acquisition from normal and C6 glioma-implanted rat brains. To investigate fatty acids metabolism in glioma, [1-13C]acetyl-carnitine production from fatty-acid metabolism was also measured in a separate acquisition. A spectrally under-sampled acquisition strategy20 was exploited along with a hard pulse excitation and a radiofrequency (RF) surface coil to overcome the CSDA. Metabolic changes in brain, as modulated by dichloroacetate (DCA), were also measured and compared with the hyperpolarized [1-13C]pyruvate results in literature11.
Methods
Substrate and Polarization
A mixture of 14-M [2-13C]-labeled pyruvic acid (Sigma-Aldrich Co., St. Louis, MO, USA) and 15-mM trityl radical OX063 (Oxford Instruments, UK) was polarized using a HyperSense DNP polarizer (Oxford Instruments, UK) by irradiating the sample with microwaves (94.076 GHz) at ∼1.4 K. When the solid-state polarization reached more than 98% of the estimated maximum polarization level, the sample was dissolved with a buffer solution (40 mM tris[hydoroxymethyl]aminomethane, 125 mM NaOH, 100 mg/L ethylenediaminetetraacetic acid (EDTA) and 50 mM NaCl), resulting in a 125-mM solution of [2-13C]pyruvate with pH ∼7.5.
Hardware and Animal Preparation
All imaging experiments were performed using a clinical 3T Signa® MR scanner (GE Healthcare, Waukesha, WI, USA) equipped with a high-performance insert gradient coil (maximum amplitude = 500 mT/m, slew rate = 1865 mT/m/ms)21. A custom-built quadrature proton birdcage coil (Øinner = 80 mm) and a single-loop 13C surface coil (Øinner = 28 mm) operating at 127.7 MHz and 32.1 MHz, respectively, were used for both RF excitation and signal reception.
Four healthy (287 – 315 g) and five tumor-implanted (200 – 242 g) male Wistar rats were used in the in vivo 13C MRS imaging experiments. For tumor-implanted rats, approximately one million cells of N-methyl-N-nitrosourea-induced C6 glioma22 were implanted into the right striatum of the brain 10 days prior to imaging. All animals were anesthetized with 1.5 – 3.0% isoflurane in ∼1.5 L/min oxygen and catheterized in tail vein for intravenous administration of the hyperpolarized substrate. Rats were first placed in the 1H volume coil with the 13C surface coil positioned on the top of the skull centered over the brain and then move into the MR scanner. A 2.5 – 3.7 mL of hyperpolarized [2-13C]pyruvate solution was injected as a bolus through the catheter at a rate of 0.25 mL/s with an overall dose of 1.56 mmol/kg body weight. Animal vital signs were monitored throughout the experiments and body temperature and respiration rate were maintained at ∼37 °C and 50-60 breaths/min, respectively.
PDH activity was modulated by injecting 200 mg/kg body weight of sodium DCA, which suppresses the activity of pyruvate dehydrogenase kinase, a PDH inhibitor23. DCA was dissolved in saline (30 mg/mL) and injected through the tail vein catheter as a 0.5-mL bolus followed by an infusion of the remaining volume at a rate of 0.1 mL/3 min.
1H MR protocol
Two-dimensional single-shot fast spin echo (FSE) images of up to 47 slices were acquired for anatomical reference in axial, sagittal, and coronal planes (repetition time (TR)/echo time (TE) = 1492/38.6 ms, in-plane resolution = 0.47 × 0.47 mm2, slice thickness = 2 mm). Tumor-bearing rats were scanned additionally using a dual-echo T2-weighted FSE sequence (TR/TE1/TE2=5000/11.3/56.7 ms, in-plane resolution = 0.25 × 0.25 mm2, slice thickness = 1 mm, echo train length = 8) to identify the slice with the tumor. The line-width of water signal from a point-resolved spectroscopy sequence was minimized using the linear shim currents to reduce the B0 field inhomogeneity over the targeted brain region for 13C imaging. For tumor-implanted animals, contrast-enhanced T1-weighted 2D spin-echo images (TR/TE = 700/12 ms, 25 slices, slice thickness = 1 mm) were acquired with an injection of a 1:2 mixture of gadopentetate dimeglumine (Magnevist®, Bayer Healthcare, Whippany, NJ, USA) and saline at the end of the imaging session to confirm the tumor location and size.
13C MR protocol: 3D spiral CSI
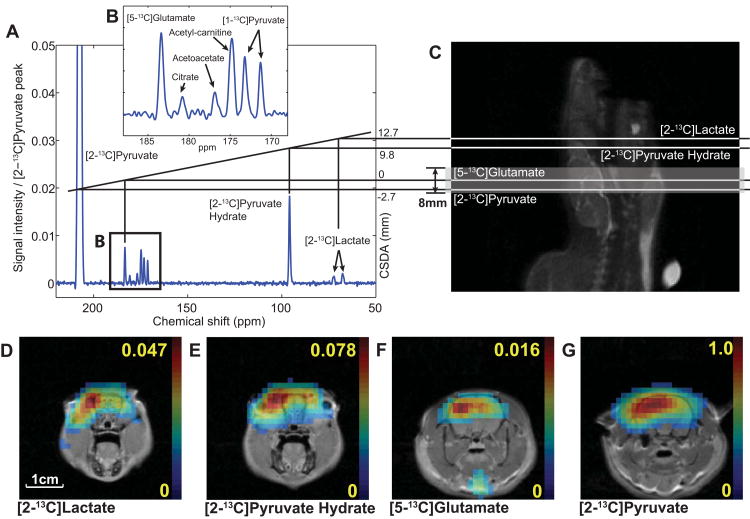
Using a slice-selective RF pulse creates substantial slice mismatch for the individual metabolites due to the large dispersion of the chemical shifts of [2-13C]pyruvate and metabolic products, e.g., the chemical shift difference between the C2 resonances of pyruvate and lactate corresponds to ∼4,390 Hz at 3T. Figure 1A-B shows a spectral distribution at 3T of 13C-labeled metabolite peaks averaged over the entire image, acquired with a standard slice-selective (spectral bandwidth = 2.3 kHz, center frequency on the resonance frequency of [5-13C]glutamate) free induction decay (FID) chemical shift imaging (CSI) sequence from a healthy rat brain after an injection of 125-mM [2-13C]pyruvate19. DCA was injected into the animal 1 hr prior to the imaging to increase the signal-to-noise ratio (SNR) of mitochondrial metabolites by increasing PDH flux. The [5-13C]glutamate and [1-13C]citrate peaks indicate that some of the 13C-label enters the TCA cycle, whereas [1-13C]acetyl-carnitine and [1-13C]acetoacetate represent fatty-acid and ketone-body metabolism, respectively. The [1-13C]pyruvate doublet peaks are from natural abundance (∼1%) of 13C in the C1 position of the injected hyperpolarized [2-13C]pyruvate. Figure 1C shows the target (shaded) slice, axially prescribed in a rat brain at the [5-13C]glutamate resonance frequency, and the corresponding slice locations for [2-13C]pyruvate, [2-13C]pyruvate hydrate, and [2-13C]lactate at 3T due to the CSDA, resulting in acquisition of slice-mismatched metabolite maps (fig. 1D-G). In particular, the mismatch between [2-13C]-labeled pyruvate and pyruvate hydrate maps demonstrates the severity of the CSDA.
Figure 1. Chemical shift displacement artifacts.
(A) An averaged spectrum measured from a rat brain in vivo using a 2D slice-selective FID CSI after a bolus injection of 125-mM hyperpolarized [2-13C]pyruvate (post-DCA) at 3T. (B) Zoomed region containing most of mitochondrial metabolite peaks. (C) Shifted slice excitation profiles, shown on sagittal 1H image of the rat brain, for [2-13C]lactate, [2-13C]pyruvate hydrate, [5-13C]glutamate, and [2-13C]pyruvate due to the wide spectral distribution of the metabolites when an 8-mm slice (shaded region) is prescribed at the resonance frequency of [5-13C]glutamate. Reconstructed metabolite maps of (D) [2-13C]lactate, (E) [2-13C]pyruvate hydrate, (F) [5-13C]glutamate, and (G) [2-13C]pyruvate, overlaid on 1H MR images at the corresponding slice locations.
Although several metabolites are detected in the averaged spectrum (fig. 1A), [2-13C]lactate and [5-13C]glutamate in addition to [2-13C]pyruvate are the major targets of interest in imaging cerebral metabolism since most [1-13C]acetyl-carnitine and [2-13C]alanine peaks are from peripheral muscle/fat tissue19,24 and the other metabolites such as [1-13C]acetoacetate and [1-13C]citrate were below the noise level in the CSI voxels. In particular, [5-13C]glutamate and [2-13C]lactate are key metabolites for differentiating tumor from normal metabolism. The pulse sequence parameters were therefore set to resolve the [2-13C]pyruvate, [2-13C]lactate, and [5-13C]glutamate resonances.
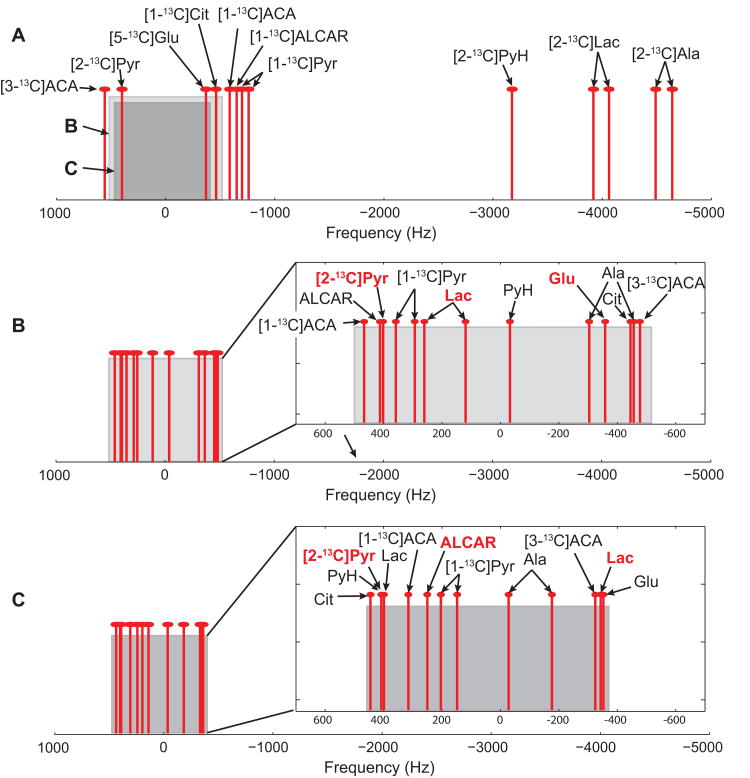
To overcome the problem of CSDA, a non-selective hard pulse (pulse width = 56 μs, flip-angle = 9.8°) was used for RF excitation followed by 3D spiral CSI data acquisition. Spectral under-sampling20 was applied by exploiting spectral sparsity to reduce the number of spatial interleaves while avoiding spectral overlap for the resonances of interest. The spiral readout gradient waveforms and the number of interleaves were designed for a receive spectral bandwidth optimized to resolve [2-13C]pyruvate, [2-13C]lactate, and [5-13C]glutamate peaks (scheme 1), which are the primary intracranial metabolite peaks19. For scheme 1, five spatial interleaves with spiral waveforms of duration 0.96 ms (corresponding to a 1,042 Hz spectral width) with 96 echoes were used to encode a 43.5 × 43.5 × 64.8 mm3 field of view (FOV, matrix size = 16 × 16 × 12), resulting in acquisition time (Tacq) of 5.6 s. The actual spatial resolution was estimated as 3.6 × 3.6 mm2 in-plane and 7.1 mm along the z-encode direction, calculated by integration of simulated CSI point spread functions (PSFs), taking k-space sampling, apodization, and zero-filling into account from a 3D fast Fourier transform (FFT) of the sampling functions25. However, the exact quantification of the voxel size is hampered by the inhomogeneous RF excitation profile of the surface coil and the time-varying intensities of the measured metabolites. The overall 3D spiral CSI sequence diagram is shown in figure 2. A centric encoding scheme was used for phase encoding in the z-direction26. The spiral interleaves were acquired as a group before moving onto the next z-phase encode to maximize the signal intensities at the center of k-space (in combination with the centric encoding scheme) and to reduce signal variation between interleaves. When scheme 1 is applied to the full in vivo metabolite distribution of hyperpolarized [2-13C]pyruvate and its downstream products (fig. 3A) the expected spectral aliasing pattern is as shown in figure 3B. The [2-13C]pyruvate peak at 207.6 ppm and [5-13C]glutamate at 183.8 ppm are detectable within the acquired spectral window without aliasing when the imaging resonance frequency is centered between [2-13C]pyruvate and [5-13C]glutamate. [2-13C]lactate doublets at 68.8 ppm and 73.3 ppm are also resolvable in the target spectral window while being aliased four times. The spectral bandwidth was designed such that [2-13C]pyruvate hydrate at 96.5 ppm (aliased three times) did not overlap with the metabolite peaks of interest. [1-13C]acetyl-carnitine at 175.0 ppm overlaps with the large [2-13C]pyruvate peak. [1-13C]acetoacetate at 177.3 ppm and [3-13C]acetoacetate at 212.7 ppm are aliased once. The flip angle was calibrated using a reference phantom (diameter = 8.7 mm, length = 10 mm) containing an 8-M solution of 13C-urea in 80:20 w/w water:glycerol and 3 ml/ml Gd-chelate, placed 5-10 mm under the surface coil before in vivo experiments.
Figure 2. Pulse sequence diagram.
The 3D spiral chemical shift imaging pulse sequence used in the study.
Figure 3. Spectral under-sampling schemes.
(A) Full spectral distribution of [2-13C]pyruvate and expected metabolic products. Gray and dark gray boxes indicate spectral windows designed for under-sampling scheme 1 and 2, respectively. Expected spectral aliasing patterns of the metabolite peaks when (B) under-sampling scheme 1 (spectral width = 1,042 Hz) and (C) scheme 2 (890 Hz) are used. Pyr = pyruvate; PyH = [2-13C]pyruvate hydrate; Lac = [2-13C]lactate; Ala = [2-13C]alanine; Glu = [5-13C]glutamate; Cit = [1-13C]citrate; ALCAR = [1-13C]acetyl-carnitine; ACA = acetoacetate.
The second set of parameters (scheme 2, fig. 3C, spectral width = 890 Hz, 96 echoes, FOV = 43.5 × 43.5 × 64.8 mm3, matrix size = 16 × 16 × 12, 4 spatial interleaves, Tacq = 5.2 s) was used for imaging [1-13C]acetyl-carnitine. Acetyl-carnitine is clearly resolved from other larger metabolite peaks. One of the [2-13C]lactate peaks (aliased 4 times) at 68.8 ppm is well-separated but the other lactate peak overlaps with both the large [2-13C]pyruvate (no aliasing) and [2-13C]pyruvate hydrate (aliased 3 times) peaks.
Separate groups of animals were imaged using CSI scheme 1 (three healthy and four glioma rats) and scheme 2 (one healthy and one glioma rat). For both schemes, single time-point CSI data were acquired 25 s after the start of each pyruvate injection to maximize the glutamate and acetyl-carnitine signal detection19. Two baseline and two post-DCA (at 1 hr- and 2.5 hr-post) data sets were acquired per animal to improve signal-to-noise ratios (SNR).
Image Processing and Analysis
All 13C data were post-processed using MATLAB (Mathworks, Natick, MA, USA). The two respective pre- and post-DCA data sets were averaged in k-space prior to the reconstruction. After apodization by a 10-Hz Gaussian filter, k-space data were zero-filled in spectral and spatial (in-plane) dimensions by a factor of 4 and 2, respectively, followed by a FFT in time domain. Before gridding onto Cartesian coordinates and applying a 3D spatial FFT, the chemical shift artifacts along the readout direction were removed. For tumor-bearing animals, the data were multiplied by additional linear phase term along the z-encoding direction to center the slice on the tumor, reducing potential partial volume effects. Separate reconstructions were performed for aliased resonances20. Volumetric metabolite maps were then estimated by integrating the corresponding metabolite peaks in the absorption mode spectra, and normalized to the maximum [2-13C]pyruvate signal. The final axial metabolite maps were overlaid on the corresponding 1H MRI for anatomical reference.
For quantitative assessment of each brain metabolite, spectra were averaged over selected regions of interest (ROIs) before integrating individual peaks. Full width at a half maximum was measured to estimate the line-width of individual metabolite for both under-sampling schemes 1 and 2. Two ROIs were selected for tumor-bearing rats; a glioma ROI was selected over the hyper-intense region shown on the contrast-enhanced T1-weighted spin echo images, and a normal-appearing brain ROI was drawn in the contralateral hemisphere. Each metabolite was separately reconstructed with the resonance frequency within the selected bandwidth (spectral tomosynthesis)27 and the first-order phase was corrected for display of the reconstructed spectra. Each metabolite was normalized to the sum of total 13C-labeled metabolite (tC) signal to compare glioma and normal-appearing brain as well as to assess metabolic change due to DCA. SNR of each metabolite map was calculated from the averaged signal in brain ROI divided by the square root of the sum of variances from the background region.
All values are reported as mean ± standard error. A paired Student's t-test with two-tailed analysis (α = 0.05) was used to assess statistical significance between glioma and normal-appearing brain and evaluate metabolic change due to DCA. Healthy brain of control rats and normal-appearing brain of glioma-implanted rats were compared using an unpaired Student's t-test with two-tailed analysis (α = 0.05).
Results
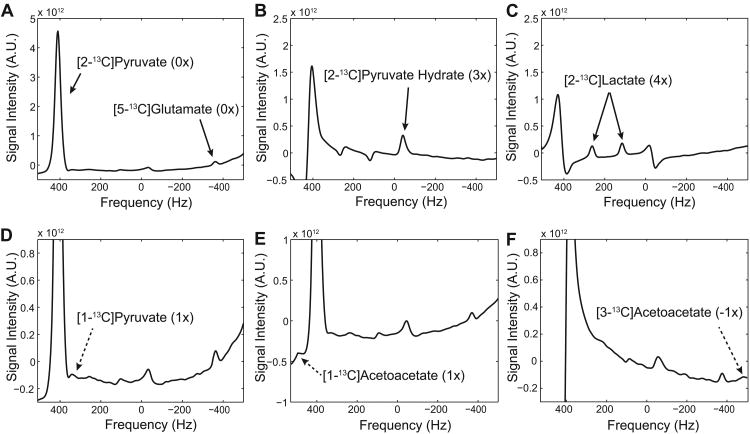
Figure 4 shows spectra averaged over the brain voxels, acquired from a representative healthy rat using the 3D spiral CSI with under-sampling scheme 1 (spectral width = 1,042 Hz) after an injection of hyperpolarized [2-13C]pyruvate (averaged 1-hr and 2.5-hr post-DCA data). The spectra were reconstructed separately for: [2-13C]pyruvate and [5-13C]glutamate (fig. 4A), [2-13C]pyruvate hydrate (fig. 4B), and [2-13C]lactate (fig. 4C). In addition to the targeted metabolites, one of the [1-13C]pyruvate peaks (natural abundance) could be resolved (fig. 4D) while the other [1-13C]pyruvate peak overlapped with the large [2-13C]pyruvate peak. [1-13C]acetyl-carnitine could not be resolved since it also overlapped with the dominating [2-13C]pyruvate peak. Small 13C-labeled acetoacetate peaks were also detected (fig. 4E-F) but [1-13C]citrate and [2-13C]alanine were below the noise level.
Figure 4. Spatially averaged brain spectra of healthy rat brain using scheme 1.
Post-DCA spectra averaged over the brain voxels and reconstructed separately for (A) [2-13C]pyruvate and [5-13C]glutamate, (B) [2-13C]pyruvate hydrate, and (C) [2-13C]lactate (D) A small [1-13C]pyruvate peak was detected while the other peak of the [1-13C]pyruvate doublet overlapped with the larger [2-13C]pyruvate peak. Small peaks of both (E) [1-13C]acetoacetate and (F) [3-13C]acetoacetate were also detected. The parentheses indicate the number of aliasing with a positive sign towards smaller chemical shifts.
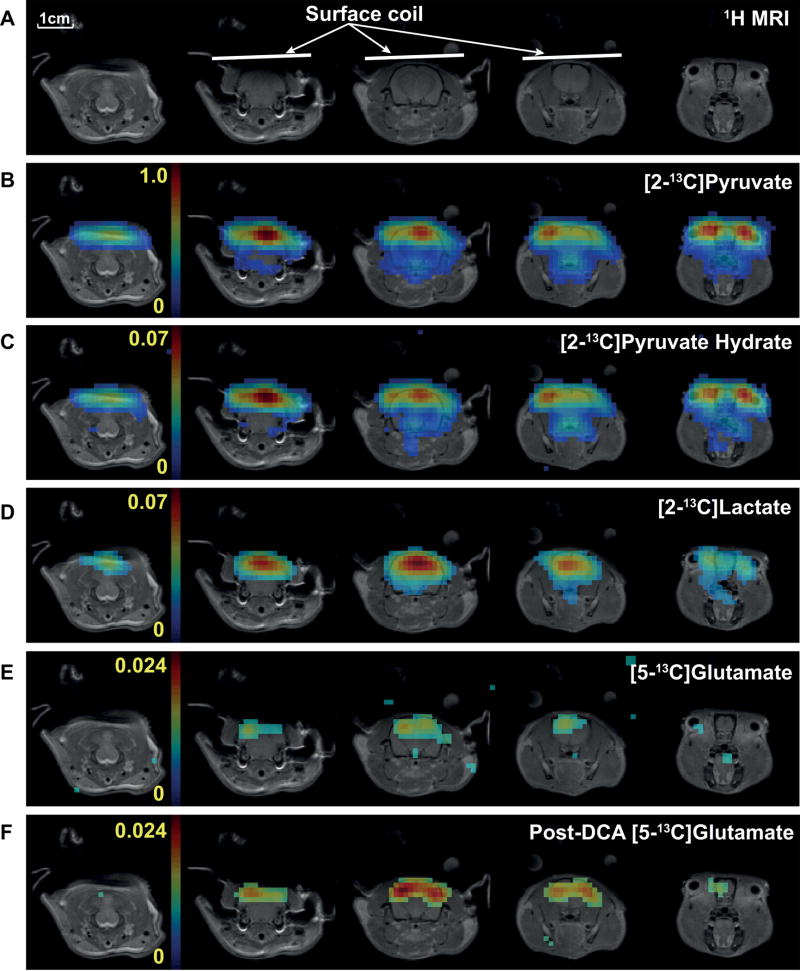
Proton MR images from multiple slices (fig. 5A) and corresponding 13C metabolite maps acquired from a representative healthy rat brain using the proposed 3D spiral chemical shift imaging sequence with spectral under-sampling (scheme 1) are shown in figure 5. Metabolite maps of [2-13C]pyruvate (fig. 5B), [2-13C]pyruvate hydrate (fig. 5C), [2-13C]lactate (fig. 5D) and [5-13C]glutamate (fig. 5E) could be reconstructed with sufficient SNR (table 1). Note that the background signal level in the pyruvate maps is dominated by artifact signal from inflowing pyruvate in the blood and the resulting inconsistencies in the k-space data from different interleaves. This leads to an apparent higher noise level. The sum of the cerebral lactate doublet normalized to tC, [2-13C]lactate/tC, was 0.081 ± 0.001 (N = 3), and did not change significantly after DCA infusion (table 1, 0.085 ± 0.002, P = 0.4). A larger change was detected for [5-13C]glutamate/tC (fig. 5F), which increased from 0.014 ± 0.002 at pre-DCA to 0.024 ± 0.002 at post-DCA (P < 0.01). The line-widths were 33.3 ± 0.6 Hz for the [2-13C]pyruvate, 26.5 ± 0.6 Hz for the each [2-13C]lactate peaks, and 25.8 ± 1.3 Hz for [5-13C]glutamate at baseline from the brain spectra obtained using the under-sampling scheme 1. The line-widths did not change significantly after DCA infusion (33.0 ± 0.5 Hz for pyruvate, 26.6 ± 0.4 Hz for lactate, and 24.6 ± 0.3 Hz for glutamate).
Figure 5. Metabolite maps of healthy rat brain.
(A) Proton MR images from multiple slices and corresponding 13C metabolite maps of (B) [2-13C]pyruvate, (C) [2-13C]pyruvate hydrate, (D) [2-13C]lactate, and (E) [5-13C]glutamate at baseline acquired from a representative healthy rat brain using the 3D spiral CSI sequence with spectral under-sampling scheme 1 (spectral width = 1,042 Hz) after an injection of hyperpolarized [2-13C]pyruvate. (F) Increased [5-13C]glutamate production was detected after DCA administration (averaged 1-hr and 2.5-hr post-DCA data).
Table 1. SNR and metabolite ratios of healthy rat brain.
Signal-to-noise ratios and metabolite ratios in brain (for pyruvate, pyruvate hydrate, lactate and glutamate) and muscle (for acetyl-carnitine) from the metabolite maps reconstructed from data of the four individual hyperpolarized [2-13C]pyruvate injections as well as from the combined data. Metabolite ratios are calculated as integrated metabolite peaks over the brain then normalized by the total 13C signal.
| Pre-DCA | Post-DCA | ||||||
|---|---|---|---|---|---|---|---|
| Injection1 | Injection2 | Combined (inj1&2) | Injection3 | Injection4 | Combined (inj3&4) | ||
| SNR | |||||||
| Scheme1 | [2-13C]pyruvate | 436.1 ± 8.2 | 448.7 ± 5.2 | 452.5 ± 8.3 | 429.5 ± 37.7 | 433.4 ± 19.4 | 443.9 ± 21.1 |
| [2-13C]pyruvate hydrate | 139.3 ± 25.9 | 122.5 ± 12.0 | 161.2 ± 14.4 | 102.2 ± 14.4 | 100.2 ± 24.5 | 134.4 ± 26.6 | |
| [2-13C]lactate | 124.7 ± 34.8 | 112.0 ± 20.4 | 153.2 ± 31.8 | 102.6 ± 17.2 | 121.6 ± 19.8 | 136.8 ± 18.6 | |
| [5-13C]glutamate | 33.7 ± 1.6 | 32.2 ± 2.8 | 41.0 ± 4.2 | 37.3 ± 5.8* | 45.5 ± 6.7* | 53.4 ± 10.0 | |
| Scheme2 | [2-13C]pyruvate | 428.6 | 414.3 | 443.1 | 411.8 | 393.3 | 425.5 |
| [2-13C]lactate | 99.6 | 97.6 | 125.9 | 88.7 | 97.2 | 120.5 | |
| [1-13C]ALCAR (muscle) | N.D. | N.D. | N.D. | 36.3 | 40.5 | 50.6 | |
| Metabolite Ratio | |||||||
| Scheme1 | [2-13C]lactate/tC | 0.081 ± 0.001 | 0.081 ± 0.002 | 0.081 ± 0.001 | 0.079 ± 0.002 | 0.084 ± 0.003 | 0.085 ± 0.002 |
| [2-13C]pyruvate hydrate/tC | 0.067 ± 0.002 | 0.065 ± 0.002 | 0.066 ± 0.001 | 0.067 ± 0.002 | 0.064 ± 0.001 | 0.065 ± 0.001 | |
| [5-13C]glutamate/tC | 0.014 ± 0.001 | 0.014 ± 0.002 | 0.014 ± 0.002 | 0.021 ± 0.002 | 0.026 ± 0.003 | 0.024 ± 0.002 | |
| Scheme2 | [2-13C]lactate | 0.051 | 0.04 | 0.045 | 0.032 | 0.044 | 0.038 |
| [1-13C]ALCAR (muscle) | N.D. | N.D. | N.D. | 0.011 | 0.014 | 0.012 | |
N = 4 for scheme 1 and N=1 for scheme 2.
ALCAR = acetyl-carnitine.
N.D. = not detected.
indicates significant difference between measurements from injection 3 and 4 (P < 0.05).
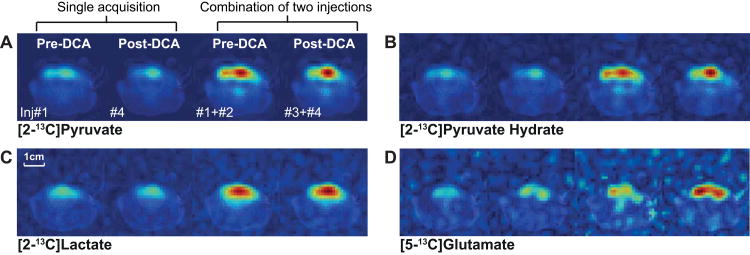
Despite the lengthy period of anesthesia, the brain pyruvate SNRs did not change significantly between baseline and post-DCA (table 1). However, the SNR of brain glutamate was higher in the second post-DCA injection than in the first post-DCA injection (P < 0.04) probably due to the increasing DCA effect over time (reported in literature up to ∼10 hrs28). When combined, the SNRs of [2-13C]lactate and [5-13C]glutamate in brain were increased by 29.4% and 24.5%, respectively, at baseline and 22.0% and 29.2%, respectively, at post-DCA (table 1, fig. 6). The metabolite ratios were consistent in data from single injections and the combined data for both pre- and post-DCA (table 1). There was a trend of increasing glutamate/tC (0.021 ± 0.002 at the 1st and 0.026 ± 0.003 at the 2nd post-DCA) over time but the difference was not statistically significant (P = 0.1).
Figure 6. Comparison of metabolite maps of healthy rat brain from individual injections.
Metabolite maps (the 3rd axial slice of fig. 5A) of (A) [2-13C]pyruvate, (B) [2-13C]pyruvate hydrate, (C) [2-13C]lactate, and (D) [5-13C]glutamate reconstructed from the single acquisition data and the combined data of two injections (left to right: pre-DCA single data, post-DCA single data, pre-DCA combined data, post-DCA combined data).
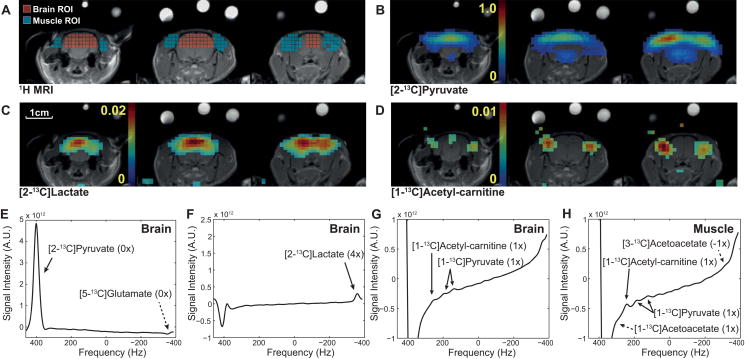
Figure 7 shows reconstructed [2-13C]pyruvate (fig. 7B), [2-13C]lactate (fig. 7C), and [1-13C]acetyl-carnitine (fig. 7D) from the post-DCA data of healthy rat brain acquired using the under-sampling scheme 2. The spectra averaged over brain (fig. 7E-G) and muscle (fig. 7H) resolved pyruvate, lactate, and acetyl-carnitine peaks. The [2-13C]pyruvate peak overlapped with the aliased [2-13C]pyruvate hydrate peak but the contribution of pyruvate hydrate was negligible due to the relatively small concentration (< 10% of pyruvate) and spatial blurring effect from spectral aliasing (3×). Although [5-13C]glutamate peak (fig. 7E) and downfield peak of [2-13C]lactate doublet (73.3 ppm) also partially overlap after 4× spectral aliasing, the larger [2-13C]lactate could be reconstructed (fig. 7F). Lactate/tC was measured as 0.045 and 0.038 in brain of healthy rat pre- and post-DCA, respectively (table 1). The natural abundance [1-13C]pyruvate doublet was also detected in brain (fig. 7G). [1-13C]acetyl-carnitine, however, was primarily from the peripheral muscle/fat tissue surrounding the brain (fig. 7D, G, H). For the scheme 2, the line-width was 34.5 Hz for [2-13C]pyruvate and 25.8 Hz for [2-13C]lactate in brain at baseline (post-DCA: 33.7 Hz for pyruvate and 25.7 Hz for lactate), and 26.2 Hz for [1-13C]acetyl-carnitine in post-DCA muscle.
Figure 7. Post-DCA metabolite maps and spatially averaged spectra of healthy rat brain using scheme 2.
(A) 1H MRI marked with brain (red) and peripheral muscle (blue) ROIs. Metabolite maps of (B) [2-13C]pyruvate, (C) [2-13C]lactate, and (D) [1-13C]acetyl-carnitine. Brain spectra reconstructed separately for (E) [2-13C]pyruvate and [5-13C]glutamate, (F) [2-13C]lactate, and (G) [1-13C]acetyl-carnitine and [1-13C]pyruvate. (H) Spectrum reconstructed from muscle ROI. The parentheses indicate the number of aliasing with a positive sign towards smaller chemical shifts.
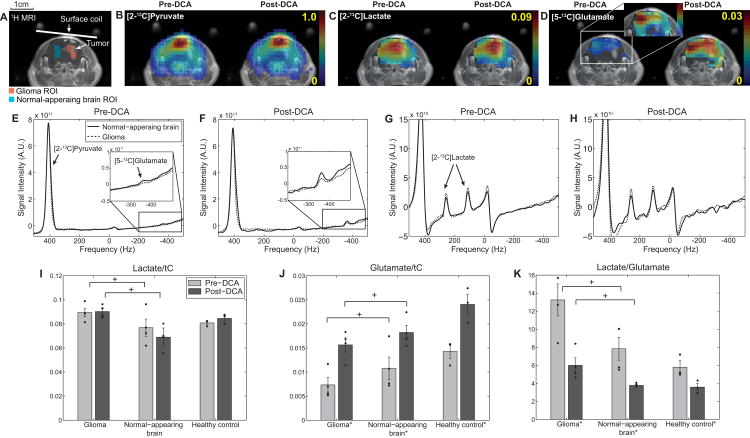
The tumor-specific glioma metabolism was also successfully differentiated as compared to normal brain in vivo. As presented in figure 8, lactate/tC in the glioma ROI (0.089 ± 0.004, N = 4) was higher than that in the normal-appearing brain ROI (0.077 ± 0.009, P < 0.04), whereas glutamate/tC was lower in glioma (0.007 ± 0.002) than normal-appearing brain (0.012 ± 0.002, P < 0.05). DCA significantly increased glutamate/tC in both glioma (0.016 ± 0.001, P < 0.01) and normal-appearing brain (0.018 ± 0.001, P < 0.02). The lactate-to-glutamate ratio (lactate/glutamate), a biomarker for measuring the metabolic fate of the labeled carbon from [2-13C]pyruvate towards glycolysis versus the TCA cycle, was calculated as 13.2 ± 1.8 in glioma and 7.8 ± 1.3 in normal-appearing brain, decreasing to 6.0 ± 0.8 (P < 0.02) and 3.8 ± 0.1 (P < 0.04), respectively, due to the DCA effect. Higher lactate and glutamate were measured in healthy brain of control rats than normal-appearing brain of glioma rats, but the differences were not significant (P > 0.6 for lactate/tC, P > 0.3 for glutamate/tC). In particular, lactate/glutamate were comparable between healthy control and normal-appearing brain both pre-DCA (P > 0.3) and post-DCA (P > 0.6).
Figure 8. DCA effects on metabolite ratios in glioma and normal-appearing brain.
(A) Contrast-enhanced T1-weighted 1H MRI from a tumor slice of a representative glioma-implanted rat brain. ROIs of glioma and normal-appearing brain are marked as red and blue voxels, respectively. Metabolite maps of (B) [2-13C]pyruvate, (C) [2-13C]lactate, and (D) [5-13C]glutamate, measured pre- and post-DCA using scheme 1. Spatially averaged spectra of normal-appearing brain (solid line) and glioma (dotted line) ROIs were reconstructed separately for (E, F) [2-13C]pyruvate and [5-13C]glutamate, and (G, H) [2-13C]lactate. Individual data points measured from the glioma-bearing (N = 4) and healthy control (N = 3) rats using scheme 1 are summarized in (I-K). (I) Lactate/tC was higher (N = 4, P < 0.04) and (J) glutamate/tC was lower (P < 0.05) in glioma than in normal-appearing brain. DCA-modulation increased glutamate/tC of both glioma (P < 0.01) and normal-appearing brain (P < 0.02). (K) Lactate-to-glutamate ratio also decreased both in glioma (P < 0.02) and in normal-appearing brain (P < 0.04). + indicates significant differences (P < 0.05) between glioma and normal-appearing brain. * indicates significant change after DCA infusion (P < 0.05). No significant difference was observed between normal-appearing brain of glioma rats and health controls (lactate/glutamate: P > 0.2 for pre-DCA and P > 0.6 for post-DCA).
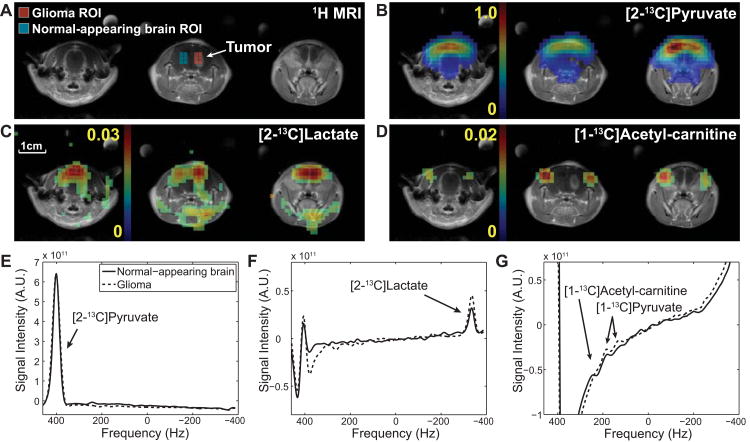
A tumor-bearing rat imaged using aliasing scheme 2 showed a similar observation as the healthy rat as no [1-13C]acetyl-carnitine was detected in tumor ROI (fig. 9). Lactate production was comparable at pre- and post-DCA in both normal-appearing brain (lactate/tC, pre: 0.040, post: 0.039) and glioma (pre: 0.060, post: 0.056).
Figure 9. Post-DCA metabolite maps of glioma-bearing rat brain with scheme 2.
Axial imaging slice that contains tumor and adjacent slices of (A) contrast-enhanced proton MRI, marked with glioma (red) and normal-appearing brain (blue) ROIs, (B) [2-13C]pyruvate, (C) [2-13C]lactate (one peak of double), and (D) [1-13C]acetyl-carnitine. Spatially averaged spectra from the normal-appearing brain (solid line) and the glioma (dotted line) ROIs were reconstructed separately for (E) [2-13C]pyruvate, (F) [2-13C]lactate, and (G) [1-13C]acetyl-carnitine.
Discussion
The volumetric spiral CSI sequence with spectral under-sampling schemes presented here permits metabolic imaging of hyperpolarized [2-13C]pyruvate and its metabolic products without CSDA. As shown in figure 5, the metabolite maps acquired from representative healthy brain are correctly aligned to the corresponding proton images (fig. 5A). In particular, the matching distributions of [2-13C]pyruvate (fig. 5B) and [2-13C]pyruvate hydrate (fig. 5C) demonstrate the improved localization without CSDA.
By permitting the simultaneous detection of pyruvate, lactate, and glutamate, the proposed method allows the observation of metabolic pathways altered in glioma metabolism. High lactate/tC likely indicates up-regulated aerobic glycolysis in glioma, and low glutamate/tC implies that the metabolic pathway from pyruvate to the TCA cycle is suppressed in tumor as compared to normal-appearing brain. This is consistent with the results of the previous [1-13C]pyruvate study11, reporting lower 13C-bicarbonate/tC and higher [1-13C]lactate/tC in glioma as compared to normal-appearing brain. [5-13C]glutamate from [2-13C]pyruvate may be a more direct and accurate biomarker for the oxidative phosphorylation rather than 13C-bicarbonate from [1-13C]pyruvate because the labeled carbon must enter the TCA cycle to generate [5-13C]glutamate. Moreover, the measured glutamate and its increase by DCA in glioma suggest that dysregulated mitochondrial metabolism of glioma might be recoverable. Metabolic imaging using hyperpolarized [2-13C]pyruvate therefore should be also useful in assessing the response to cancer treatment29, in particular for therapies that target the altered balance between glycolysis and TCA cycle oxidative phosphorylation.
The lack of cerebral production of [1-13C]acetyl-carnitine measured by the spiral CSI with under-sampling scheme 2 is consistent with the observation in the previous study19 and is probably due to the concentration of carnitine acetyltransferase (CAT), the entry enzyme that connects acetyl CoA and fatty-acid metabolism, being low in brain (12.3 μmol/min/g protein)30. Therefore, there is no significant effect of acetyl-carnitine on the [2-13C]pyruvate map in under-sampling scheme 1 despite the peak overlap, also confirming that the scheme 1 itself is suitable for imaging cerebral metabolism using hyperpolarized [2-13C]pyruvate. Signal intensity of [2-13C]lactate images acquired from the under-sampling scheme 2 was about half of what it should be since these were reconstructed from only the downfield peak (73.3 ppm) of the lactate doublet. The upfield lactate peak (68.8 ppm) overlaps with [2-13C]pyruvate and [2-13C]pyruvate hydrate. Little effect is expected of the partially overlapping glutamate peak on the lactate quantitation, considering that the glutamate peak is severely blurred after 4× spectral aliasing when reconstructing lactate. The single peak measurement was however quite sensitive to noise as shown in table 1.
Comparison of Cerebral [1-13C]Pyruvate and [2-13C]Pyruvate Metabolism
The lactate and glutamate signals are not fully aligned with the tumor location probably due to the inhomogeneous transmit/receive sensitivity of the surface coil (fig. 8). Computing ratios between metabolites produced intracellularly not only compensates the inhomogeneous spatial coil sensitivity profile but also achieves a perfusion-independent metabolic assessment. However, analyses using metabolite ratios should be interpreted carefully to assess the relative contributions of factors such as enzyme concentration and intrinsic pool sizes to the multiple complex metabolic interactions occurring concurrently.
The lactate-to-glutamate ratio measured with [2-13C]pyruvate is potentially a better biomarker than lactate/bicarbonate from [1-13C]pyruvate for evaluating the balance of glycolysis versus oxidative phosphorylation, because the lactate/glutamate metric reflects the metabolic fate of the pyruvate within the TCA cycle whereas lactate/bicarbonate ratio measures PDH and lactate dehydrogenase (LDH) activities. In cerebral metabolism however lactate/bicarbonate from hyperpolarized [1-13C]pyruvate might be sufficient to assess the change in the balance of glycolysis and the oxidative phosphorylation since the conversion of acetyl CoA towards fatty-acid metabolism is typically low in normal brain30. The contribution of acetyl CoA to ketogenesis is also minor in normal brain because most ketone bodies are formed in the liver although the other direction, the consumption of ketone bodies, can be significant31. Indeed, in glioma-bearing rat brains, the effects of DCA on the ratios were comparable; [1-13C]lactate/13C-bicarbonate was decreased by 72.1% in glioma and 54.7% in normal-appearing brain11, while data from our study showed [2-13C]lactate/[5-13C]glutamate decreased by 77.1 ± 14.6% in glioma and 57.0 ± 5.8 in normal-appearing brain. Nonetheless, comparing the changes in 13C-bicarbonate/tC and [5-13C]glutamate/tC from hyperpolarized [1-13C]pyruvate and [2-13C]pyruvate, respectively, may still be of interest for correlating the activities of PDH and the TCA cycle because other metabolic factors might affect the 13C-glutamate production. For example, glutamate production can be affected by upregulated isocitrate dehydrogenase (IDH)32,33 activity or Myc-associated increase of glutamine uptake and glutaminase activity in several types of glioma34,35.
Technical Considerations and Limitations
The proposed volumetric imaging method with spectral under-sampling requires careful selection of the spectral width based on prior knowledge of the chemical shifts and amplitudes of target metabolite resonance peaks.
As a non-selective hard pulse is used for excitation, the imaging coverage in the slice-encoding direction has to be at least as large as the sensitive volume of the receive coil to avoid aliasing in z-direction. In our experiments, no aliasing along z-direction was observed because the coverage along z-direction (64.8 mm) was more than twice of the 13C surface coil diameter (28 mm).
The inhomogeneous sensitivity profile of surface coils cause spatially inhomogeneous excitations and reception. The constant flip-angle RF excitations between interleaves and the centric phase-encoding scheme lead to an extra apodization effect along z-encoding direction, resulting in a thicker slice profile and, therefore, increased partial volume effects. Using a transmit-only volume coil with a more homogeneous B1 profile in combination with a variable flip angle scheme26 would improve the spatial PSF.
Higher SNR and homogeneous excitation would be necessary for more reliable and accurate metabolic assessment. Multi-channel receiver coils in combination with homogeneous volume excitation can achieve higher SNR as well as reduced point-spread functions. SNR can be also improved by increasing substrate polarization36,37 and proton decoupling38. With improved SNR, the short acquisition time (< 6 s) of the proposed imaging method should permit dynamic 3D visualization of [2-13C]pyruvate metabolism without CSDA.
Conclusion
We demonstrated reliable volumetric CSI of hyperpolarized [2-13C]pyruvate, [2-13C]lactate, and [5-13C]glutamate simultaneously in rat brain without chemical shift displacement artifacts. We also assessed mitochondrial metabolism of normal brain and glioma-bearing brains before and after DCA administration. The proposed method may be particularly useful for studies of brain pathologies, such as tumor or neurodegenerative diseases, for which assessments of aerobic glycolysis and TCA cycle activity are needed.
Acknowledgments
National Institute of Health CA176836, EB009070, AA005965, AA0018681, AA13521-INIA, S10 OD012283, P41 EB015891; Department of Defense PC100427; Nadia's Gift Foundation; The Lucas Foundation
References
- 1.Ardenkjaer-Larsen JH, Fridlund B, Gram A, Hansson G, Hansson L, Lerche MH, Servin R, Thaning M, Golman K. Increase in signal-to-noise ratio of > 10,000 times in liquid-state NMR. Proc Natl Acad Sci U S A. 2003 Sep 2;100(18):10158–63. doi: 10.1073/pnas.1733835100. [DOI] [PMC free article] [PubMed] [Google Scholar]
- 2.Golman K, in't Zandt R, Thaning M. Real-time metabolic imaging. Proc Natl Acad Sci U S A. 2006 Jul 25;103(30):11270–5. doi: 10.1073/pnas.0601319103. [DOI] [PMC free article] [PubMed] [Google Scholar]
- 3.Albers MJ, Bok R, Chen AP, Cunningham CH, Zierhut ML, Zhang VY, Kohler SJ, Tropp J, Hurd RE, Yen YF, Nelson SJ, Vigneron DB, Kurhanewicz J. Hyperpolarized 13C lactate, pyruvate, and alanine: noninvasive biomarkers for prostate cancer detection and grading. Cancer Res. 2008 Oct 15;68(20):8607–15. doi: 10.1158/0008-5472.CAN-08-0749. [DOI] [PMC free article] [PubMed] [Google Scholar]
- 4.Schroeder MA, Cochlin LE, Heather LC, Clarke K, Radda GK, Tyler DJ. In vivo assessment of pyruvate dehydrogenase flux in the heart using hyperpolarized carbon-13 magnetic resonance. Proc Natl Acad Sci U S A. 2008 Aug 19;105(33):12051–6. doi: 10.1073/pnas.0805953105. [DOI] [PMC free article] [PubMed] [Google Scholar]
- 5.MacKenzie JD, Yen YF, Mayer D, Tropp JS, Hurd RE, Spielman DM. Detection of inflammatory arthritis by using hyperpolarized 13C-pyruvate with MR imaging and spectroscopy. Radiology. 2011 May;259(2):414–20. doi: 10.1148/radiol.10101921. [DOI] [PMC free article] [PubMed] [Google Scholar]
- 6.Lee P, Leong W, Tan T, Lim M, Han W, Radda GK. In vivo hyperpolarized carbon-13 magnetic resonance spectroscopy reveals increased pyruvate carboxylase flux in an insulin-resistant mouse model. Hepatology. 2013 Feb;57(2):515–24. doi: 10.1002/hep.26028. [DOI] [PubMed] [Google Scholar]
- 7.Warburg O. On the origin of cancer cells. Science. 1956 Feb 24;123(3191):309–14. doi: 10.1126/science.123.3191.309. [DOI] [PubMed] [Google Scholar]
- 8.Vander Heiden MG, Cantley LC, Thompson CB. Understanding the Warburg effect: the metabolic requirements of cell proliferation. Science. 2009 May 22;324(5930):1029–33. doi: 10.1126/science.1160809. [DOI] [PMC free article] [PubMed] [Google Scholar]
- 9.Nelson SJ, Kurhanewicz J, Vigneron DB, Larson PE, Harzstark AL, Ferrone M, van Criekinge M, Chang JW, Bok R, Park I, Reed G, Carvajal L, Small EJ, Munster P, Weinberg VK, Ardenkjaer-Larsen JH, Chen AP, Hurd RE, Odegardstuen LI, Robb FJ, Tropp J, Murray JA. Metabolic imaging of patients with prostate cancer using hyperpolarized [1-13C]pyruvate. Sci Transl Med. 2013 Aug 14;5(198):198ra108. doi: 10.1126/scitranslmed.3006070. [DOI] [PMC free article] [PubMed] [Google Scholar]
- 10.Atherton HJ, Schroeder MA, Dodd MS, Heather LC, Carter EE, Cochlin LE, Nagel S, Sibson NR, Radda GK, Clarke K, Tyler DJ. Validation of the in vivo assessment of pyruvate dehydrogenase activity using hyperpolarised 13C MRS. NMR Biomed. 2011 Feb;24(2):201–8. doi: 10.1002/nbm.1573. [DOI] [PMC free article] [PubMed] [Google Scholar]
- 11.Park JM, Recht LD, Josan S, Merchant M, Jang T, Yen YF, Hurd RE, Spielman DM, Mayer D. Metabolic response of glioma to dichloroacetate measured in vivo by hyperpolarized (13)C magnetic resonance spectroscopic imaging. Neuro Oncol. 2013 Apr;15(4):433–41. doi: 10.1093/neuonc/nos319. [DOI] [PMC free article] [PubMed] [Google Scholar]
- 12.Schroeder MA, Clarke K, Neubauer S, Tyler DJ. Hyperpolarized magnetic resonance: a novel technique for the in vivo assessment of cardiovascular disease. Circulation. 2011 Oct 4;124(14):1580–94. doi: 10.1161/CIRCULATIONAHA.111.024919. [DOI] [PMC free article] [PubMed] [Google Scholar]
- 13.Menendez JA, Lupu R. Fatty acid synthase and the lipogenic phenotype in cancer pathogenesis. Nat Rev Cancer. 2007 Oct;7(10):763–77. doi: 10.1038/nrc2222. [DOI] [PubMed] [Google Scholar]
- 14.Kuhajda FP. Fatty-acid synthase and human cancer: new perspectives on its role in tumor biology. Nutrition. 2000 Mar;16(3):202–8. doi: 10.1016/s0899-9007(99)00266-x. [DOI] [PubMed] [Google Scholar]
- 15.Wolf A, Agnihotri S, Guha A. Targeting metabolic remodeling in glioblastoma multiforme. Oncotarget. 2010 Nov;1(7):552–62. doi: 10.18632/oncotarget.190. [DOI] [PMC free article] [PubMed] [Google Scholar]
- 16.Schroeder MA, Atherton HJ, Ball DR, Cole MA, Heather LC, Griffin JL, Clarke K, Radda GK, Tyler DJ. Real-time assessment of Krebs cycle metabolism using hyperpolarized 13C magnetic resonance spectroscopy. FASEB J. 2009 Aug;23(8):2529–38. doi: 10.1096/fj.09-129171. [DOI] [PMC free article] [PubMed] [Google Scholar]
- 17.Schroeder MA, Lau AZ, Chen AP, Gu Y, Nagendran J, Barry J, Hu X, Dyck JRB, Tyler DJ, Clarke K, Connelly KA, Wright GA, Cunningham CH. Hyperpolarized (13)C magnetic resonance reveals early- and late-onset changes to in vivo pyruvate metabolism in the failing heart. Eur J Heart Fail. 2013 Feb;15(2):130–40. doi: 10.1093/eurjhf/hfs192. [DOI] [PMC free article] [PubMed] [Google Scholar]
- 18.Josan S, Park JM, Hurd R, Yen YF, Pfefferbaum A, Spielman D, Mayer D. In vivo investigation of cardiac metabolism in the rat using MRS of hyperpolarized [1-13C] and [2-13C]pyruvate. NMR Biomed. 2013 Dec;26(12):1680–7. doi: 10.1002/nbm.3003. [DOI] [PMC free article] [PubMed] [Google Scholar]
- 19.Park JM, Josan S, Grafendorfer T, Yen YF, Hurd RE, Spielman DM, Mayer D. Measuring mitochondrial metabolism in rat brain in vivo using MR Spectroscopy of hyperpolarized [2-13C]pyruvate. NMR Biomed. 2013 Oct;26(10):1197–203. doi: 10.1002/nbm.2935. [DOI] [PMC free article] [PubMed] [Google Scholar]
- 20.Mayer D, Levin YS, Hurd RE, Glover GH, Spielman DM. Fast metabolic imaging of systems with sparse spectra: application for hyperpolarized 13C imaging. Magn Reson Med. 2006 Oct;56(4):932–7. doi: 10.1002/mrm.21025. [DOI] [PubMed] [Google Scholar]
- 21.Chronik B, Alejski A, Rutt BK. Design and fabrication of a three-axis multilayer gradient coil for magnetic resonance microscopy of mice. MAGMA. 2000 Jun;10(2):131–46. doi: 10.1007/BF02601848. [DOI] [PubMed] [Google Scholar]
- 22.Benda P, Lightbody J, Sato G, Levine L, Sweet W. Differentiated rat glial cell strain in tissue culture. Science. 1968 Jul 26;161(3839):370–1. doi: 10.1126/science.161.3839.370. [DOI] [PubMed] [Google Scholar]
- 23.Stacpoole PW. The pharmacology of dichloroacetate. Metabolism. 1989;38(11):1124–4. doi: 10.1016/0026-0495(89)90051-6. [DOI] [PubMed] [Google Scholar]
- 24.Mayer D, Yen YF, Takahashi A, Josan S, Tropp J, Rutt BK, Hurd RE, Spielman DM, Pfefferbaum A. Dynamic and high-resolution metabolic imaging of hyperpolarized [1-13C]-pyruvate in the rat brain using a high-performance gradient insert. Magn Reson Med. 2011 May;65(5):1228–33. doi: 10.1002/mrm.22707. [DOI] [PMC free article] [PubMed] [Google Scholar]
- 25.Golay X, Gillen J, van Zijl PCM, Barker PB. Scan time reduction in proton magnetic resonance spectroscopic imaging of the human brain. Magn Reson Med. 2002 Feb;47(2):384–7. doi: 10.1002/mrm.10038. [DOI] [PubMed] [Google Scholar]
- 26.Yen YF, Kohler SJ, Chen AP, Tropp J, Bok R, Wolber J, Albers MJ, Gram KA, Zierhut ML, Park I, Zhang V, Hu S, Nelson SJ, Vigneron DB, Kurhanewicz J, Dirven HA, Hurd RE. Imaging considerations for in vivo 13C metabolic mapping using hyperpolarized 13C-pyruvate. Magn Reson Med. 2009 Jul;62(1):1–10. doi: 10.1002/mrm.21987. [DOI] [PMC free article] [PubMed] [Google Scholar]
- 27.Mayer D, Yen YF, Levin YS, Tropp J, Pfefferbaum A, Hurd RE, Spielman DM. In vivo application of sub-second spiral chemical shift imaging (CSI) to hyperpolarized 13C metabolic imaging: comparison with phase-encoded CSI. J Magn Reson. 2010 Jun;204(2):340–5. doi: 10.1016/j.jmr.2010.03.005. [DOI] [PMC free article] [PubMed] [Google Scholar]
- 28.Stacpoole PW, Nagaraja NV, Hutson AD. Efficacy of dichloroacetate as a lactate-lowering drug. J Clin Pharmacol. 2003 Jul;43(6):683–91. [PubMed] [Google Scholar]
- 29.Griguer CE, Oliva CR. Bioenergetics pathways and therapeutic resistance in gliomas: emerging role of mitochondria. Curr Pharm Des. 2011;17(23):2421–7. doi: 10.2174/138161211797249251. [DOI] [PubMed] [Google Scholar]
- 30.Marquis NR, Fritz IB. The distribution of carnitine, acetylcarnitine, carnitine acetyltransferase in rat tissues. J Biol Chem. 1965 May;240:2193–6. [PubMed] [Google Scholar]
- 31.Morris AA. Cerebral ketone body metabolism. J Inherit Metab Dis. 2005;25:109–121. doi: 10.1007/s10545-005-5518-0. [DOI] [PubMed] [Google Scholar]
- 32.Reitman ZJ, Jin G, Karoly ED, Spasojevic I, Ynag J, Kinzler KW, He Y, Bigner DD, Vogelstein B, Yan H. Profiling the effects of isocitrate dehydrogenase 1 and 2 mutations on the cellular metabolome. Proc Natl Acad Sci U S A. 2011 Feb;108(8):3270–5. doi: 10.1073/pnas.1019393108. [DOI] [PMC free article] [PubMed] [Google Scholar]
- 33.Chaumeil MM, Larson PE, Yoshihara HA, Danforth OM, Vigneron DB, Nelson SJ, Pieper RO, Philips JJ, Ronen SM. Non-invasive in vivo assessment of IDH1 mutational status in glioma. 2013 Sep;4:2429. doi: 10.1038/ncomms3429. [DOI] [PMC free article] [PubMed] [Google Scholar]
- 34.Yang C, Sudderth J, Dang T, Bachoo RM, McDonald JG, DeBerardinis RJ. Glioblastoma cells require glutamate dehydrogenase to survive impairments of glucose metabolism or Akt signaling. Cancer Res. 2009 Oct;69(20):7986–93. doi: 10.1158/0008-5472.CAN-09-2266. [DOI] [PMC free article] [PubMed] [Google Scholar]
- 35.DeBerardinis RJ, Lum JJ, Hatzivassillou G, Thompson CB. The biology of cancer: metabolic reprogramming fuels cell growth and proliferation. Cell Metab. 2008 Jan;7(1):11–20. doi: 10.1016/j.cmet.2007.10.002. [DOI] [PubMed] [Google Scholar]
- 36.Jóhannesson H, Macholl S, Ardenkjaer-Larsen JH. Dynamic Nuclear Polarization of [1-13C]pyruvic acid at 4.6 tesla. J Magn Reson. 2009 Apr;197(2):167–75. doi: 10.1016/j.jmr.2008.12.016. [DOI] [PubMed] [Google Scholar]
- 37.Ardenkjaer-Larsen JH, Leach AM, Clarke N, Urbahn J, Anderson D, Skloss TW. Dynamic nuclear polarization polarizer for sterile use intent. NMR Biomed. 2011 Oct;24(8):927–32. doi: 10.1002/nbm.1682. [DOI] [PubMed] [Google Scholar]
- 38.de Graaf RA, Mason GF, Patel AB, Behar KL, Rothman DL. In vivo 1H-[13C]-NMR spectroscopy of cerebral metabolism. NMR Biomed. 2003 Oct-Nov;16(6-7):339–57. doi: 10.1002/nbm.847. [DOI] [PubMed] [Google Scholar]


